Dissertation Report Master in Electrical Engineering
High Efficient Cogeneration Potential
GABRIEL NAPOLEON PESANTEZ PALACIOS
Dissertation Report Master in Electrical Engineering
High Efficient Cogeneration Potential
GABRIEL NAPOLEON PESANTEZ PALACIOS
Dissertation/Report developed under the supervision of Doctor Luís Neves, professor at the School of Technology and Management of the Polytechnic Institute of Leiria and co-supervision of Engineer Rodrigo Sempértegui, professor at the Faculty of Engineering of the University of Cuenca.
Dedication
I dedicate my dissertation work to my family. A special feeling of gratitude to my loving parents, Jaime and Fanny whose words of encouragement and push for tenacity ring in my ears
Acknowledgements
I would like to thank to SENECYT, University of Cuenca and Polytechnic Institute of Leiria, for the support which allowed the development of the work here described. I wish to thank my tutors who were more than generous with their expertise and precious time. A special thanks to Dr. Luis Neves, dissertation supervisor, for his countless hours of reflecting, reading, encouraging, and most of all patience throughout the entire process.
Resumo
Devido aos problemas atuais que surgem nas áreas ambiental, energética e económica, é necessário um aumento na eficiência no uso de combustível fóssil para reduzir a dependência dos hidrocarbonetos e melhorar a qualidade de vida. A cogeração é uma opçao que visa alcançar esse objetivo, através do uso dos gases de escape e energia térmica dos sistemas de refrigeração de equipamentos térmicos, para fornecimento de energia térmica a outros processos, produzindo assim várias formas de energia final de forma combinada, habitualmente energia mecânica ou elétrica, e térmica.
O principal objetivo deste trabalho é avaliar o potencial de cogeração no setor industrial do Equador. Neste quadro, é apresentada uma breve introdução sobre o desenvolvimento da cogeração nas últimas décadas, e também uma classificação da cogeração de acordo com a sequência usada na produção de eletricidade e calor, e de acordo com o tipo de motor primário. O conceito de trigeração é analisado brevemente. É também apresentado um resumo dos estudos realizados como base para o trabalho, bem como a situação atual do mercado de eletricidade no Equador, sendo igualmente analisados os dados de consumo de energia publicados pelo INEC em 2011.
Com base nos fatores apresentados na bibliografia consultada, foi calculado o potencial de cogeração, nas atuais condições do mercado de eletricidade no Equador, usando-se as necessidades elétricas das indústrias como base para o cálculo. A análise económica foi realizada usando quatro tipos de equipamento e considerando os efeitos da altitude acima do nível do mar como um fator particularmente importante. Finalmente, foram analisadas duas indústrias específicas, um caso na indústria do papel e outro da indústria alimentar, como estudo de casos para avaliar a implementação da cogeração.
Abstract
Due to the current problems that arise in the environmental, energy and economic areas, an increase of the efficiency of the use of fossil fuels is absolutely needed to reduce the dependence on hydrocarbons and improve tue quality of life. Cogeneration is a supply option that aims to achieve this goal, cogeneration by using the exhaust gases, and thermal energy from cooling systems from thermal equipment to supply useful thermal energy to other processes, producing two useful energy streams combined, usually mechanical or electric and thermal energy at the same time.
The principal objective of this work is to evaluate the potential of cogeneration in the industrial sector of Ecuador. In this framework, a short introduction about the development of cogeneration over the last decades is presented, and a classification of cogeneration according to the sequence of production of electricity and heat, and according to the prime mover type is also presented. The concept of trigeneration is analyzed briefly. A summary of the studies used as a source for the present work as well as the current situation of the electricity market in Ecuador is also shown, being also analyzed the energy consumption data published by the INEC in 2011.
Using the factors presented in the consulted bibliography, the cogeneration potential was calculated, considering the current electricity market structure of Ecuador, and using the electrical needs of industries as a base-line. An economic analysis was carried out using as four types of equipment and considering the effects of altitude above sea level as an important parameter. Finally, two specific facilities, representing the paper and the food industry were used as case studies to evaluate the implementation of cogeneration.
Table of Contents
1. INTRODUCTION ...1
2. STATE OF THE ART ...3
2.1 Brief history of Cogeneration ...3
2.2 Concepts ...3 2.2.1 Classification of Cogeneration ...4 2.1.1 Prime Movers ...6 2.3. Trigeneration ...9 2.3.1 Absorption Chillers ...10 2.3.2 Adsorption Chillers ...10
2.4 Cogeneration Potential at a Country Level ...11
2.4.1 United States of America. ...11
2.4.2 Portugal ...15
2.4.3 Spain ...18
2.4.4 Germany ...22
2.2.5 Comparison of the Presented Methodologies. ...28
2.3 Development of Cogeneration ...28
2.4 Market Characteristics...30
3. METHODOLOGY ...31
3.1 Objectives ...31
3.2 Ecuador Energy Outlook. ...31
3.3 Concepts and Data Requirements ...33
3.4 Demand Estimation. ...34
3.5. Thermal and Electric energy production estimation ...37
3.5.1 General Issues ...37
3.5.2 Limitations due to Topographic ...39
3.7 Economic Analysis ...43 3.8 Efficiency Analysis ...48 4. CASE STUDY ...51 4.1 Introduction ...51 4.2. Industry A ...51 4.2.1 Demand Estimation. ...52 4.2.2 Economic Analysis ...53 4.2.3 Efficiency Analysis ...55 4.3. Industry B ...56 4.3.1 Demand Estimation. ...57 4.3.2 Potential Analysis ...57 4.3.3 Efficiency Analysis ...60 5. CONCLUSIONS...61 APPENDIX I ...65 APPENDIX II ...66 APPENDIX III ...67 APPENDIX IV...69 APPENDIX V ...72 REFERENCES ...75
List of Figures
Figure 1. 1 Traditional System compared with a Cogeneration System ... 1
Figure 1. 2 Current and project CHP capacities under and accelerated CHP scenario, 2015 and 2030 ... 2
Figure 2. 1 Classic System to Produce Electrical Energy ... 4
Figure 2. 2 Classification of Cogeneration Systems According to sequence production of Electricity and heat ... 5
Figure 2. 3 Basic schema of Steam Turbine ... 6
Figure 2. 4 Condensing Steam Turbine ... 7
Figure 2. 5 Back Pressure Steam Turbine ... 7
Figure 2. 6 Basic Schematic of Gas Turbine………..8
Figure 2. 7 Basic Schematic of Internal Combustion Engine ... 9
Figure 2. 8 Combined Cooling, Heat and Power ... 9
Figure 2. 9 Abortion Chiller Cycle ... 10
Figure 2. 10 Flowchart for determining district heating cogeneration potential ... 26
Figure 2. 11 Annual and cumulated installed owner of cogeneration in Spain ... 29
Figure 3. 1 Comparison of Supply and Demand of Oil Products ... 32
Figure 3. 2 Economic sectors’ energy consumption by energy sources ... 32
Figure 3. 3 Structure of Electricity supply ... 33
Figure 3. 4 Division of Business according to Principal Activity ... 34
Figure 3. 5 Sub-sector of manufacturing business ... 35
Figure 3. 6 Heat requirement in the year (MWh) ... 37
Figure 3. 7 Electrical Requirement in the year (MWh) ... 37
Figure 3. 8 Heat Requirement only considered 50% of Diesel oil (MWh) ... 41
Figure 3. 9 Price of kWh generated for diesel engine ... 44
Figure 3. 10 Price of kWh generated for gas engine (350kW -950kW)... 45
Figure 3. 11 Price of kWh generated for gas engine ... 46
Figure 3. 12 Price of kWh generated for gas Turbine ... 47
Figure 4. 1 Cogeneration System proposed ... 51
Appendix Figure. 1 Basic System ... 69
Appendix Figure. 2 Recovery Boiler scheme ... 72
List of Tables
Table 2. 1 Industrial CHP Market ... 12
Table 2. 2 Commercial CHP Target Market ... 12
Table 2. 3 WHP CHP Target Markets ... 14
Table 2. 4 Proportion of the consumption of heat that can be supplied through a source of residential heat ... 17
Table 2. 5 Structure of the Demand Centre’s ... 19
Table 2. 6 Classification of indirect and direct categories ... 19
Table 2. 7 Uses of the tertiary sector and classification direct and indirect demand .... 21
Table 2. 8 2012 Cogeneration Act surcharge rates ... 23
Table 2. 9 CHP considered ... 24
Table 2. 10 Characteristics of CHPP Types of Plants ... 25
Table 2. 11 Town Categories ... 27
Table 2. 12 Comparative Table ... 29
Table 3. 1 Energy Import (kBOE) ... 31
Table 3. 2 Individual categories of ISIC ... 33
Table 3. 3 Percentage to Heat used for Cogeneration ... 38
Table 3. 4 Ratios Considered for each subsector... 39
Table 3. 5 Percentage of Industries in the different region to the country ... 39
Table 3. 6 Potential to Cogeneration considering 100% of diesel ... 41
Table 3. 7 Potential to Cogeneration considering 50% of diesel ... 42
Table 3. 8 Characteristics of equipment to analysis ... 43
Table 3. 9 Economic Analysis diesel engine ... 44
Table 3. 10 Economic Analysis for gas engine (350kW-950kW) ... 45
Table 3. 11 Economic Analysis for gas engine ... 46
Table 3. 12 Economic Analysis for gas turbine ... 48
Table 3. 13 Energy Efficiency indicators ... 49
Table 4. 1 Engine Characteristics ... 53
Table 4. 2 Energy consumed and produced by cogeneration ... 54
Table 4. 3 Economic parameters ... 55
Table 4. 4 Operative cost caused for energy consumption ... 55
Table 4. 5 Efficiency energy Dates ... 55
Table 4. 6 Engine Characteristics ... 58
Table 4. 7 Energy consumed and produced by cogeneration ... 59
Table 4. 8 Economic parameters ... 59
Table 5. 1 Technical Cogeneration Potential ... 61 Table 5. 2 Example of Percentage of PES with right to additional payment ... 62 Table 5. 3 Economic Indicators for the example case ... 62
List of Acronyms
BHPP Block Heat and Power Plant BOE Barrel of Oil Equivalent
CCHP Combined Cooling, Heat and Power CHP Combined Heat and Power
CHPP Combined Heat and Power Plant CTS Commerce, Trade, Services
DGEG Portuguese Directorate Energy Association
EU European Union
FLO Full Load Operation G&S Gas & Steam
GT Gas Turbine
ICE Internal Combustion Engine
IDEA International District Energy Association IEA International Energy Agency
INEC National Institute of Statistics and Census IRR Internal Rate of Return
ISIC International Standard Industrial
Classification of all Economic Activities LHV Lower Heating Value
LPG Liquid Petroleum Gas
MNI Manufacturer´s News Inc High Tech Database
NG Natural Gas
NPV Net Present Value ORC Organic Rankine Cycle P/H Power-to-Heat
PES Primary Energy Saved PURPA Public Utility Regulatory Act RES Renewable Energy Source
ST Steam Turbine
USA United States of America WHP Waste Heat to Power
1. INTRODUCTION
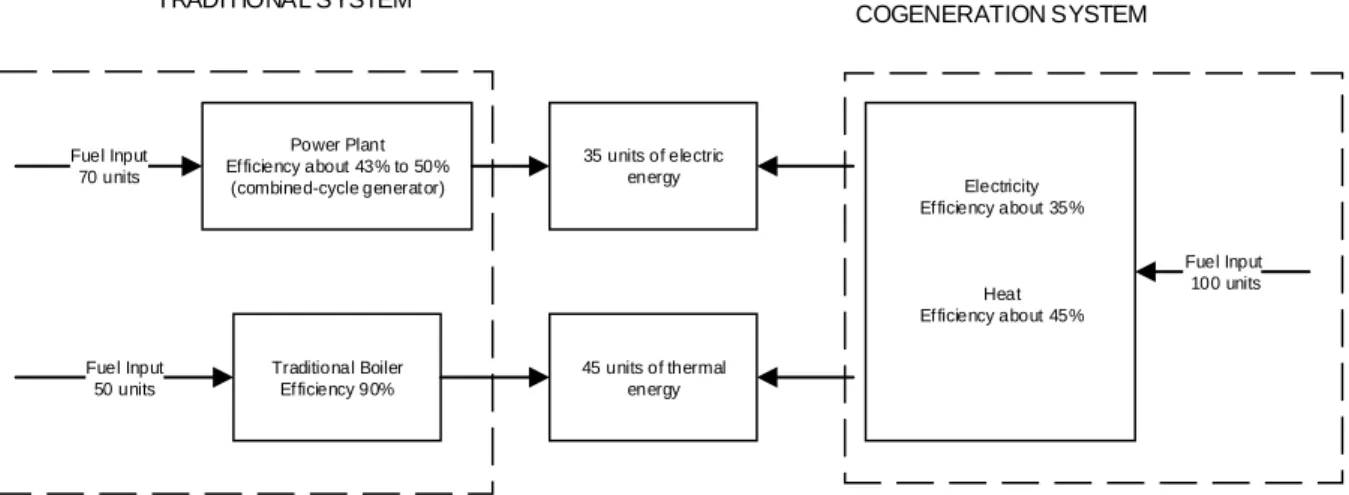
Generally, thermal energy is locally generated in industry from fossil fuels while electricity is obtained from the electric power grid. However, a significant part of electric energy is generated in thermal power plants which waste a large part of the input energy through exhaust gases and cooling systems. The waste of energy can be partly reduced by taking advantage of the heat in exhaust gases and cooling water of the prime movers to produce useful energy. This can be a way to raise the global efficiency of the system, reducing cost, pollution and other problems.
Figure 1.1 shows the energetic benefit produced by applying this concept called Cogeneration. The primary energy saved is 20% of the input energy when compared with the traditional system.
Power Plant Efficiency about 43% to 50% (combined-cycle generator) Traditional Boiler Efficiency 90% Fuel Input 70 units Fuel Input 50 units Electricity Efficiency about 35% Heat Efficiency about 45% 45 units of thermal energy 35 units of electric energy Fuel Input 100 units TRADITIONAL SYSTEM COGENERATION SYSTEM
Figure 1. 1 Traditional System compared with a Cogeneration System
Based on this advantage produced by cogeneration as well as the continuous increment in fossil fuel price, many countries look at this alternative as a way to elevate efficiency was well as a move to clean energies. It is not possible to eradicate fossil fuel dependence at the moment, but cogeneration allows to reduce its negative impacts, begins a form to reduce primary energy consumption and greenhouse gases emissions, which can be economically attractive, thus getting acceptation for investment by the private sector.
Industrialized countries have already chosen this option in their energy policies, issuing programs and laws to promote cogeneration since the 1960s, but the remaining untapped potential for efficient cogeneration is still high. Figure 1.2 shows the cogeneration potential for the main industrialized countries.
Figure 1. 2 Current and project CHP capacities under and accelerated CHP scenario, 2015 and 2030 (IEA, 2008, p. 21)
In this dissertation, the cogeneration potential of Ecuador is evaluated as an alternative way to promote a reduction in fossil fuel consumption and its related problems, increasing industrial efficiency. An economic analysis is also performed with the purpose of evaluating possible investment.
The document is organized in 5 chapters. Chapter one presents a brief introduction. Chapter two gives a first approach about cogeneration, dealing with topics such as definitions, classifications according to sequence, general prime movers, and finally different studies developed in other countries.
In chapter three, a review of the available information about the economic sector is carried out. Some considerations about the industrial sector are taken. Furthermore, thermal and electrical needs are established, and the procedure to evaluate cogeneration potential is presented. Finally, an economic analysis is carried out to evaluate the feasibility of cogeneration.
Chapter four presents an individual analysis for two industries in the country. The first industry manufactures paper products, and the second industry produces milk and natural juice products.
Conclusions obtained from this work are presented in chapter five, including a future work discussion.
2. STATE OF THE ART
2.1 Brief history of Cogeneration
Cogeneration started to be used more than 100 years ago, at first in Europe and from them expanding to the USA.
In the 1900s, the electric grid was small, unreliable and expensive, leading to the use of local electricity generation.
In this situation, cogeneration was an economic and practical form to fix the problem. Some industries applicated this solution, and as an example, in the USA in 1900, cogeneration produced around half of the electric energy needed for industrial, when steam for the in industrial facilities, such as petroleum refineries, pulp and paper mills or chemical plants (Joseph A. Orlando, 1991, p. 2), industries where still today cogeneration is a natural option, proving good rentability.
The construction of a better and interconnected electric grid, is a reliable source of cheap electric energy, reduced the economic interest in cogeneration.
However, the petroleum crisis in the 1970s and 1980s, leading to a huge increment in the price of the fuel, let to a new interest in alternative forms to produce energy, and to generally increase efficiency, with a main purpose of ending or reducing the petroleum dependence of the USA and several other countries, namely in Europe.
The legislation needed for the introduction or expansion of cogeneration in some countries, considered significant differences when compared with traditional generation entities. In the USA, the Public Utility Regulatory Act (PURPA) introduced some benefits, eliminated constraints to the grid access for cogeneration and renaveble based independent producers, a move followed by several European Countries. Later, the European Union prepared and started a Directive to promot the development of high efficiency cogeneration and clarifying the benefits to the potential investors (Joel Bluestein and Marie Lihn, n.d., p. 481).
2.2 Concepts
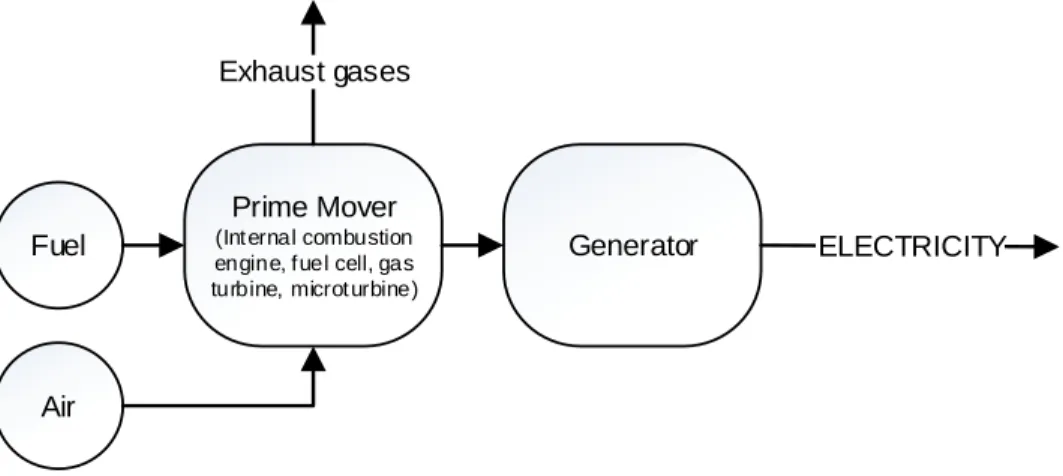
Consumption of thermal, mechanical and electrical energy is a common issue in almost every industry. At the same time, the traditional process to produce electricity from any fossil fuel combustion has important problems (Neil Petchers, 2003).
The principal problem in the conversion of heat to mechanic energy is due to losses of thermal energy, which are unavoidable. According to the second thermodynamic law, the best performance is around 50%, being the other 50% converted in heat lost in the exhaust gases and absorbed in the necessary cooling systems.
Fuel
Prime Mover
(Int ernal combustion engine, f uel cell, gas turbine, microt urbine)
Generator ELECTRICITY
Air
Exhaust gases
Figure 2. 1 Classic System to Produce Electrical Energy
Cogeneration or CHP (Combined Heat and Power) is defined as the sequential use of a primary energy stream to produce two useful energy forms-thermal and power. (Joseph A. Orlando, 1991, p. 4), in a way that increases the global efficiency when compared to the separated production of the two forms of useful energy.
The use of cogeneration elevates the global efficiency in the system, making it a good option for society as a whole, but, in a few cases, a natural and a traditional option in the industry, namely when the combination of a cheap fuel, like residual of the industrial process, and a significant demand for heat makes it very attractive to also locally produce electricity, as, e.g. in Pulp & Paper.
2.2.1 Classification of Cogeneration
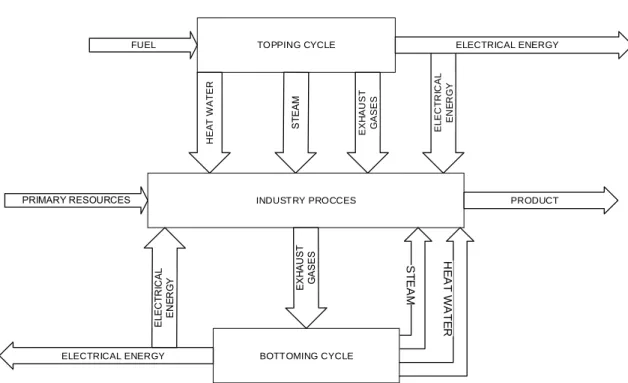
According to the sequence in which heat and power are generated, which will strongly depend on the industrial process (figure 2.2), two types of cogeneration cycles are defined; topping and bottoming.
Topping Cycle
Topping cycle is the most common. In this type of cycle a fuel source is typically used to produce mechanical or electrical energy as a first main output, and the residual heat is used to feed a manufacturing process in the industry or the heating system of a building. These systems are characterized by the use of a fluid at high temperature and pressure,
as a means for energy transfer, being more effective when the end use processes have lower requirements for temperature and pressure. (Javier Miranda, 2010)
For industrial processes that have temperature requirements from 250 ºC to 600 ºC, the use of topping cycle is common, e.g. in the pulp & paper, beer, food, sugar, petroleum, textile and other industries.
The first element of the process, are the prime movers, typically one of the following technologies:
- Gas Turbine - Steam Turbine
- Internal Combustion engine
- Combined Gas Turbine and Steam turbine (Combined cycle).
TOPPING CYCLE INDUSTRY PROCCES BOTTOMING CYCLE FUEL H E A T W A T E R E X H A U S T G A S E S E L E C TR IC A L E N E R G Y ELECTRICAL ENERGY PRODUCT S T E A M H E A T W A T E R ELECTRICAL ENERGY
Figure 2. 2 Classification of Cogeneration Systems According to sequence production of Electricity and heat
Bottoming Cycle
As the opposite to topping cycle, in the bottoming cycle, the primary energy is used in the industrial process and the exhaust heat is recycled to produce electrical or mechanical energy in a second step. (Neil Petchers, 2003)
The bottoming cycle has been common use in cement, steel, glass, chemical, mining and other industries that have residual heat from around 250ºC to 1200ºC.
2.1.1 Prime Movers
This subsection describes the main technologies used for prime movers Steam Turbine
BOILER
STEAM TURBINE GENERATOR
SUPER HEATSTEAM
CONDENSING EXHAUST STEAM
CONDENSING STEAM
Figure 2. 3 Basic schematics of Steam Turbine
It is a system used for industries that need steam at medium and high pressure. Usually is formed by a boiler, steam turbine, the condenser and a generator.
This system is based on the Rankine cycle, and its performance depends on the maximum temperature supplied by the boiler as well as the minimum practical temperature of the working fluid at the input of the boiler. It uses steam pressure around 90 to 110 bars (9000 to 11000 kPa) bars and temperatures above 450ºC
Fuel is burnt to heat the working fluid (water or steam) converting it to superheated steam at high pressure and temperature, which will be used to produce electrical or mechanical energy in a turbine. The steam loses temperature and pressure throughout this latter process, and the exhaust steam can then be used for an industrial process or re-introduced in the system again.
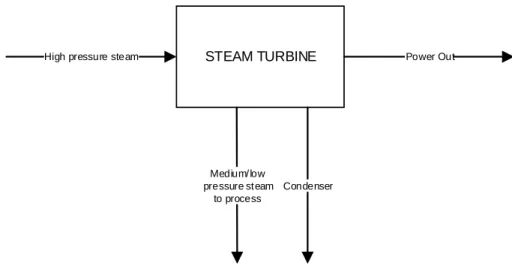
Steam turbine according to steam discharge can be classified in two categories:
Condensing Steam turbine. – In this case the steam has two exit points, in the first outlet the steam still has a medium to low pressure, and in a second outlet the remaining steam has already a low pressure and is normally carried to the condenser, where it will turn into water again, re-entering the cycle. This is shown in Figure 2.5
Back Pressure Steam Turbine. – In this case, all steam is used to produce rotation, and the exhaust steam at low pressure, in some cases lower than ambient pressure, is used for other industrial processes, not being immediately condensation.
STEAM TURBINE
High pressure steam Power Out
Condenser Medium/ low
pressure steam to process
Figure 2. 4 Condensing Steam Turbine
STEAM TURBINE
St eam Source Power Out
To process Low Pressure steam
Figure 2. 5 Back Pressure Steam Turbine
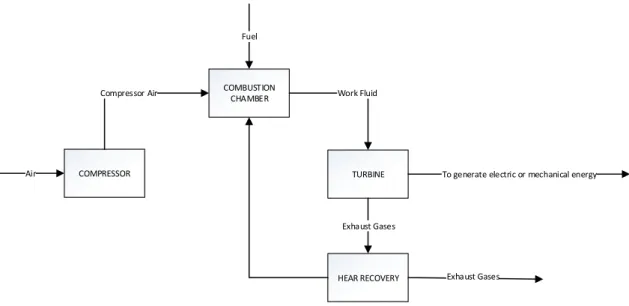
Gas Turbine
This type of turbine burns gaseous or thin liquid fuels which can be injected at high pressure in the combustion chamber. It is generally formed by a compressor, combustion chamber and turbine.
The gas turbine functions according to the Brayton thermodynamic cycle, using a gas, normally air as a work fluid. The work fluid is compressed by an adiabatic process in the compressor, producing an increment of pressure (four to thirty times) and temperature. The compressed and hot gas is introduced into the combustion chamber with the fuel, where the mixture is burned to produce high pressure and temperature exhaust gases at around 800ºC to 1200ºC. These gases are expanded in the turbine to produce work
that moves the compressor and an electric generator or mechanical parts (Javier Miranda, 2010, p. 31). Exhaust can then be used in other steps on the system or as an input to another system, e.g. a recovery boiler to produce steam.
COMPRESSOR TURBINE COMBUSTION
CHAMBER
HEAR RECOVERY Air
Compressor Air Work Fluid
Exhaust Gases
Exhaust Gases
To generate electric or mechanical energy Fuel
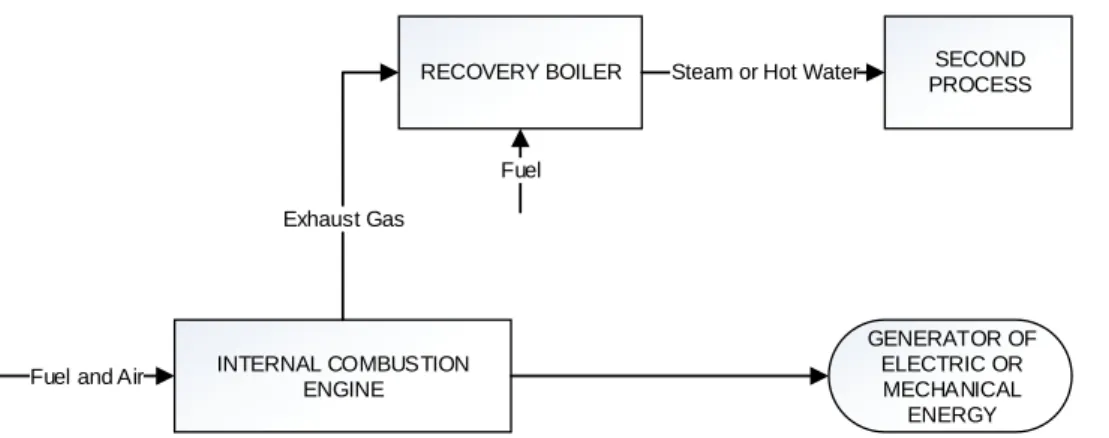
Figure 2. 6 Basic Schematic of Gas Turbine Internal Combustion Engine
Internal combustion engines (ICE) used for power generation can be based on the Otto thermodynamic cycle (similar to the engines of gasoline powered cars) or on the Diesel thermodynamic cycles. The main difference of both is the ignition process, which in the former is caused by a spark produced electrically, and in the second results from the compression of the fuel. The ICE is capable of taking faster load changes than other technologies.
Compared to the above described thermodynamic cycles based on turbines, ICEs have a lower power-to-size ratio, being more limited in power ratings and increased maintenance costs. However, they present better efficiencies, namely the big, low speed, diesel engines derived from marine applications (Joseph A. Orlando, 1991).
As in other prime movers, the high temperature exhaust gases can be used by a recovery boiler to produce steam, eventually with additional fuel burning.
Hot water can be also produced through the use of a heat exchanger, both in the exhaust, or using the engine cooling fluid (radiator).
INTERNAL COMBUSTION ENGINE SECOND PROCESS RECOVERY BOILER GENERATOR OF ELECTRIC OR MECHANICAL ENERGY Fuel and Air
Exhaust Gas
Steam or Hot Water
Fuel
Figure 2. 7 Basic Schematic of Internal Combustion Engine
2.3. Trigeneration
The traditional system to produce cooling energy is formed by a compressor driven by an electrical motor in a configuration known as a heat pump. Although such a device has a very high efficiency, it needs electricity that is probably generated in thermal power plants with low efficiency. As an alternative, there are technologies that can use the residual heat for this purpose, namely the absorption and adsorption chillers. Generally, this technology present interesting alternative in industrial sector with important consumption of energy for cooling needs.
Using an absorption or adsorption chiller to convert part of the heat produced in a cogeneration plant into cooling energy makes what is called as a trigeneration system. The first part of this system produces mechanical energy, typically converted into electrical power. Secondly, the residual heat is used to produce steam or other useful form heat as for heating buildings. A third part uses the unused residual heat to produce cooling energy.
2.3.1 Absorption Chillers
Absorption chillers function based on a sorption process, where a liquid or solid sorbent absorbs refrigerant molecules and charges physically and/or chemically the process.
The absorption chiller cycle, starting with the evaporator, allows the refrigerant to evaporate and to be absorbed by the absorbent, a process that extracts heat from the building. The combined fluids then go to the generator, which is heated by the heat source in the form of gas or steam, driving the refrigerant back out of the absorbent. The refrigerant then goes to the condenser to be cooled back down to a liquid, while the absorbent is pumped back to the absorber. The cooled refrigerant is released through an expansion valve into the evaporator, and the cycle repeats itself. Typically, absorption chillers use either lithium bromide-water (LiBr/H2O) or ammonia-water solution, the former used to produce chilling water at 5-7 ºC, being the later more used for freezing temperatures. The LiBr/H2O system uses lithium bromide as the absorber and water as the refrigerant. The ammonia-water system uses water as the absorber and ammonia as the refrigerant. (New Buildings Institute for the Southern California Gas Company, 1998, p. 3)
Generally, absorption chillers are classified according to the exposition to the heat source, as direct or indirect fired. Also, regarding the type of construction and number of phases, the abortion chillers can be built as single, double or triple stage.
CONDENSER GENERATOR EVAPORATOR ABSORBER Heat Source Diluted Solution Heat Water Refrigerant Steam Refrigerant Cooling Water
Figure 2. 9 Absorption Chiller Cycle 2.3.2 Adsorption Chillers
The adsorption chillers consist of two sorbent compartments, one evaporator and one condenser. While the sorbent in the first compartment is regenerated using hot water from the external heat source, e.g. a solar collector, the sorbent in the second compartment adsorbs the water steam entering from the evaporator. Compartment 2 must then be cooled in order to enable a continuous adsorption. Due to the low-pressure conditions in the evaporator, the refrigerant in the evaporator is transferred into the gas
phase by taking up the evaporation heat from the chilled water loop and thereby producing the useful "cold". If the sorption material in the adsorption compartment is saturated with water steam to a certain degree, the chambers are switched over in their function. The simple mechanical construction of adsorption chillers and their expected robustness is an advantage. A disadvantage is a comparatively large volume and weight. Furthermore, due to the small number of produced items, the price of adsorption chillers is currently still high.
2.4 Cogeneration Potential at a Country Level
This section presents different methodologies used in different countries to estimate the potential for cogeneration at a national level
Several countries have developed studies for estimating the potential for CHP as an autonomous initiative or as result of obligations imposed by pluri-national agreements and structures (e.g. E.U.). In the particular case of the European Union, a recent legislation mandated the member countries to assess the potential for high efficiency cogeneration according to specific rules.
The following cases describes the approaches used by different countries. - USA
- Portugal - Spain - Germany
2.4.1 United States of America.
According to the study: “Combined Heat and Power Technical Potential in the United States” realized in 2016, three different types of CHP applications were included in the evaluation of technical potential (Anne Hampson et al., 2016), namely:
- Traditional Topping Cycle CHP (including cooling) - Waste Heat to Power (WHP) CHP
- District Energy including CHP
The document only considered sites with a CHP Technical Potential of 50kW and higher. For all cases, the document makes the determination of the technical market potential, including the following steps:
- Identification of the target market where CHP provides a reasonable adjustment to the electric and thermal needs of the user.
- Quantification of the number and size distribution of target candidate facilities in each target application, that meet the electric and thermal load requirement for CHP.
- Estimation of the CHP potential in terms of MW electric capacity. The CHP potential is derived from the thermal and electric load for each site. The total CHP potential for each target market is then calculated by the amount of CHP potential in each size category.
- Subtraction of the existing CHP from the identified sites to determine the remaining technical potential.
Traditional Topping Cycle CHP
In this case, the selected cases were commercial buildings and industrial facilities that characteristically have sufficient and coincident thermal and electric loads for CHP. The next two tables show the industrial and commercial target market
Table 2. 1 Industrial CHP Market (Anne Hampson et al., 2016)
For identifying potential targets, two primary sources were the Dun and Bradstreet (Hoover´s) database and the Manufacturer´s News (MNI) database.
For the identification of Traditional CHP target facilities, they use two different estimations.
- The first reference is the estimated electric load. To estimate the electric load, they considered consumption factors applied to the number of employees on the site or another similar characteristic, e.g. number of students, numbers of beds. For some cases, they have specific information about the site, e.g. consumption of equipment, production, or others (Anne Hampson et al., 2016).
- The second reference is the estimated thermal load, as it is important to properly size the CHP system for high thermal utilization. CHP systems should be sized to meet the base thermal loads of each site, as this makes the most efficient CHP system operation. An important indicator of the use of the produced energy is the power-to-heat ratio (P/H) of the facility which should be compared with the P/H ratio of a typical CHP system of identical size range. This factor indicates the ratio of electricity generation to thermal energy generation. (Anne Hampson et al., 2016)
Lastly, the work considered five varied sizes for CHP, according to the final application: - 50kW – 500kW
- 500kW – 1MW - 1 – 5MW - 5 – 20MW - >20MW CHP
These sizes were used for characterization purposes, especially in the economic analysis. (Anne Hampson et al., 2016)
Waste Heat to Power (Bottoming-Cycle CHP)
Anne Hampson et al. (2016) defined waste heat to power technologies as the ones that produce power by taking some form of waste heat as input energy, typically steam, and converting it into electricity. The industrial process equipment, e.g. a kiln or furnace, uses a fuel as energy input to a combustion process, and the heat rejected from the process is then captured and used for power production.
According to those authors, the determination of the waste heat to power cogeneration (WHP CHP) technical potential includes the following stages:
- Identification of target markets with available waste heat flow and where WHP CHP provides a reasonable fit to the electric needs of the user.
- Quantification of the number and size distribution of target markets.
- Estimation of WHP CHP potential in terms of MW electric capacity, derived from the waste heat quality and electric load for each site.
WHP CHP systems require a constant and ample supply of waste heat, because WHP CHP systems will typically run for most hours of a year. Typically, heavy industrial processes such as cement production, advanced oil extraction and refining, or paper, production, have the waste heat stream necessary to drive a WHP CHP system (Anne Hampson et al., 2016).
Table 2. 3 WHP CHP Target Markets (Anne Hampson et al., 2016)
The methodology to estimate the WHP CHP system size used the temperature of the stack gas emissions minus an assumed minimum temperature of 122ºC. This difference was then multiplied by the average specific heat for combustion of 0.26 BTU/lb (60.476 kJ/kg). The result was the energy content of the stack gas emissions (Anne Hampson et al., 2016).
Technical Potential for District Energy
Other market included in the analysis performed in the USA as a target market for CHP is district energy. It is a system that produces and delivers steam, hot water and/or chilled water, through dedicated underground piping networks, to heat or cool buildings in a
given area. Typical settings ideal for district energy are downtown urban areas, college campuses, military bases, airports, or hospital campuses. (Anne Hampson et al., 2016) For this study, a dataset of existing district energy systems compiled by the International District Energy Association (IDEA) was used to identify district energy loops operating in the U.S. that have CHP and those that do not.
This system is unique from other energy markets because multiple legal entities are recipients of energy generated on the system. This may create a complex scenario on how trade the energy generated inside (Anne Hampson et al., 2016).
2.4.2 Portugal
The Portuguese Study used mainly public data or existing data supplied by the Portuguese Directorate General for Energy and Geology (DGEG), (ISR-UC and INESC Coimbra, 2016) namely:
- National energy Balance
- Consumption of electricity and of the main fuels by council area - Survey on the consumption of energy in the domestic sector 2010.
- Statistics on construction and housing and censuses (National Statistics Institute).
Due to limitations in data, some simplifications were assumed in order to estimate consumption as accurately as possible.
The study looked for compliance with the Annex VII of Directive 2012/27/EU, aiming to identify:
- Heating and cooling demands, including
o Municipalities and urban area with a plot ratio of at least 0.3
o Industrial zones with a total annual heating and cooling consumption of more than 20GWh.
- Existing and planned district heating and cooling infrastructures. - Potential heating and cooling supply points, including
o Electricity generation installations with a total annual electricity production of more than 20GWh.
o Waste incineration plants.
o Existing and planned cogeneration installations and district heating installations.
As part of this effort, the following hypotheses were therefore formulated in order to estimate residential consumption at the smallest possible administrative level:
- The application of the average consumption by dwelling and the number of dwellings in each civil parish.
- The application of statistics on consumption or sales by council area for all energy sources, with the exception of biomass.
- The application of the above and an estimation of the total consumption for space heating using statistics on heating systems procession by civil parish.
- Complementing the above statistics with estimations on cooling energy by using statistics on air conditioning possession.
For the case of the sectors of agriculture and fishing, industry and services, the mapping was made based on the administrative and geographic boundaries of the Portuguese municipalities, due to limitations in the data. (ISR-UC and INESC Coimbra, 2016) The Annex VII of Directive 2012/27/EU also requires the mapping of industrial zones with a total annual heating and cooling consumption of more that 20GWh but the lack of data regarding the location and consumption of industrial areas prevented this determination. For the case of the manufacturing industry, only the subsectors with greater cogeneration potential were considered, the selection being made based on the amount of heat consumed, and the typical share of heat that can be replaced, namely:
- Food, drink and tobacco - Textiles
- Paper and paper products - Chemical and plastics - Wood and wooden articles - Rubber
ISR-UC and INESC Coimbra (2016) used reference data from Eva-Maria Klotz et al., (2014), the consumption of heat at temperatures under 300ºC, which are considered as replaceable by a source of residual heat, are distributed by the different sub-sectors of the manufacturing industry.
In the case of the services buildings, the use of cogeneration was considered in the sub-sectors where this option already meaningful, and whose total consumption accounts to around 40% of the consumption of electricity and thermal energy in buildings(INESC Coimbra, ISR-UC, 2016).
Table 2. 4 Proportion of the consumption of heat that can be supplied through a source residual heat (Eva-Maria Klotz et al., 2014)
The analysis was performed considering four sectors - Agriculture and fisheries
- Industry - Services
- Residential Sector
In the case of Agriculture and Fisheries sector an adequate profile of energy needs was created, namely the demand for heat and cooling. For such, the main energy sources as well as the consumption of primary energy in this sector. As the sector is very heterogeneous, only the locations where both the climate and soil are adequate for agriculture, were considered, such as Évora, Porto, Braga and Aveiro. These areas have a high density of agricultural holdings (ISR-UC and INESC Coimbra, 2016).
The consumption of the energy in this sector in mostly associated with the production of cooling. This represent 72% of the electricity consumption. The thermal needs represent 4.66% (ISR-UC and INESC Coimbra, 2016).
Regarding the industrial sector, the first important information gathered was the shares of different energy sources, being the most important, Natural Gas (NG), electricity, petroleum coke and Liquid Petroleum Gas (LPG). The consumption of diesel and regular gasoline is also relevant.
As for the case of agriculture, an attempt was made to identify areas with a consumption of 20GWh or more. In this sector the heating needs account for 67.1% of the energy consumption of the sector, and the cooling needs are around 4% of the electricity consumption (ISR-UC and INESC Coimbra, 2016).
The service sector is very heterogeneous, ranging from small commercial units to large shopping centers, large hospitals and also including office blocks, schools, sporting facilities, hotels, etc. The wide variation in terms of size and number of hours of use, makes the determination of the typical thermal needs by subsector, extremely difficult, not forgetting that, in general, terms this sector is influenced by the climate zone, purpose of the building and large population centers. The principal energy source are diesel, NG, electricity and regular gasoline. The use of fuel and PLG is low (ISR-UC and INESC Coimbra, 2016).
The heat and cooling needs represent 21.8% and 17.7% respectable, of the total energy consumption of the sector (ISR-UC and INESC Coimbra, 2016).
In the case of residential sector, Portugal has a very low consumption, namely regarding the consumption fror heat and for space cooling. The main energy sources in this sector are electricity, LPG, solar thermal, gas, fuel and Biomass.
2.4.3 Spain
Spanish government ordered a “Full Assessment of the potential use of High- Efficient Cogeneration and Efficient District Heating and Cooling Systems”, also in compliance with the Annex VII of Directive 2012/27/EU (Ministry of Industry, Energy and Tourism of Spain, 2016).
As a first step to localize demand for energy, a database was created using as main source of information for each of the country´s municipalities, the Land Registry of Spain, completed with other sources for more singular centers. In parallel, a second database was prepared, including a set of consumer centres with high thermal demands that require different treatment (Ministry of Industry, Energy and Tourism of Spain, 2016), as represented in Table 2.5
On a second step, for facilitating analysis of the energy demand, consumers were separated in two major categories, as represented in Table 2.6, and described below:
- Direct Demand Centre’s: This include demand centers with particularly relevant consumption that require individual treatment. In industrial level, they include all
the installations that have thermal demands essentially due to productive processes and not to heating and cooling systems.
- Indirect Demand Centre´s: this refers to those points of the tertiary and industrial sector not included in the previous section.
Typology Information
Hospital and healthcare centres
Number of Beds
Geographical coordinates Area
Buildings belonging to the Central Government
Final energy savings Geographical coordinates Area
Prisons
Final energy savings Number of prisoners Geographical coordinates Airports Annual traffic Altitude Geographical coordinates
CNAE (National Classification of Economic Activities) code
Major Industries
Annual CO2 emissions
Cogeneration plant availability
Characteristics of the cogeneration plant Availability of natural gas
Shopping Malls.
Final energy savings Area
Geographical coordinates
CNAE (National Classification of Economic Activities) code
Table 2. 5 Structure of the Demand Centre’s (Ministry of Industry, Energy and Tourism of Spain, 2016)
INDIRECT CATEGORY DIRECT CATEGORY
Demand
- Residential Sector - Indirect Tertiary Sector
Offices Health Sports Shows
Leisure and hospitality industry Cultural
- Indirect Industrial Sector
Demand - Tertiary Sector Hospitals Prisons Institutional buildings Airports Shopping malls - Industrial Sector
Table 2. 6 Classification of indirect and direct categories (Ministry of Industry, Energy and Tourism of Spain, 2016)
Additionally, supplementary classifications were made in accordance with climate variation, establishing three different climatic zones:
- North Atlantic - Continental - Mediterranean
This additional classification affects the residential and tertiary sector but not the industrial sector.
To characterize the thermal demand of each of the three defined sectors. Residential Sector.
Regarding this sector, the Spanish study establishes that the energy demand is characterized as being very sensitive to the climatic zone where it is located, due to the heavy influence this has on the overall consumption of dwellings. Another factor is the type of dwelling mainly regarding the thermal insulation and the surfaces in contact with the outside.
The characterization of the residential sector in Spain used the SECH-SPAHOUSEC project (Ministry of Industry, Energy and Tourism of Spain, 2016).
The energy consumption is there divided between: - Type of dwelling o One-dwelling building o Block - Climate Zone o North Atlantic o Continental o Mediterranean
- Breakdown of energy consumption by household o Heating o Hot Water o Cooling o Lighting + electricity o Others (kitchen) Terciary Sector
This sector is still characterized by a thermal demand highly depending on atmospheric conditions.
There are centers with a relevant volume of energy consumption that require individual treatment. Consequently, the following have been considered as direct demand centers (Ministry of Industry, Energy and Tourism of Spain, 2016):
- Hospitals and health centers
- Airports
- Shopping Malls
Table 2.7 summarizes the classification of each type of building regarding the type of demand.
Id Use Direct Demand Indirect
Demand
4 Offices X Ok
5 General trade X Ok
6 Market or Supermarket X Ok
7 Indoor sports; swimming pools X Ok
8 Auxiliary sports X Ok
9 Shows X Ok
10 Leisure and Hospitality industry with residence X Ok
11 Leisure and Hospitality industry without residence X Ok
12 Health and welfare with residence Hospitals Ok
13 Health and welfare without residence Health Centers Ok
14 Cultural and religious with residence X Ok
15 Cultural and religious without residence X Ok
16 Administrative Central Government buildings Ok
17 Prison Prisons Ok
39 Service Stations X Ok
40 Airports Airports Ok
Table 2. 7 Uses of the tertiary sector and classification into direct and indirect demand (Ministry of Industry, Energy and Tourism of Spain, 2016)
Thermal and cooling demand for the indirect type was determined from energy audits classifying these by climatic zone. The following data was obtained:
- Energy consumption by floor area unit (kWh/m2) - Energy balance (%), divided into:
o Climate o Office IT equipment o Lighting o Other equipment o Hot Water o Other
Industrial, Agricultural and Fishing sectors.
This sector has an appreciable variation in the energy consumption of the productive process, depending on the type of industry analysis. For this reason, an individualized treatment is required.
The sector was divided according to the type of demand, as Direct and Indirect, following the same direction followed in the tertiary sector.
Regarding Direct Demand, heat and cooling needs were determined, based on the records of CO2 emissions in 2013. (Ministry of Industry, Energy and Tourism of Spain,
2016).
The process followed four steps, namely:
- Identification and characterization of the industries based on the registry of CO2
emissions, using their total carbon dioxide emissions.
- Calculation of fuel consumption associated with CO2 emissions.
- Calculation of overall fuel consumption by industrial sectors.
Additionally, cooling demand requirements in the industry are also very heterogeneous in terms of its use, and therefore complex to characterize. The most common uses regarding cooling services, are:
- Pharmaceutical industry. - Food industry.
- Chemical Industry
- Beverage manufacturing industry.
To estimate the cooling demand in the aforementioned sectors, energy studies and audits in different industries, were consulted. The methodology followed included the following steps:
- Calculation of the electricity consumption of each industry.
- Calculation and standardisation of electricity consumption in each subsector. - Direct cooling consumption in industries.
2.4.4 Germany
German also developed the study according to the Directive 2012/27/EU (Eva-Maria Klotz et al., 2014).
The first of the step study considered two sectors for realizing a Cost-Benefit analysis, namely:
- “Private Houses” and “Commerce, Trade, Services” (CTS). - Industrial Generation
A Second step considered for both cases, the energy prices reference prognosis conditions 2014 - 2050. It is assuming that the law is the same in the period 2014 - 2050. A third step considered uniform assumptions for calculation in both sectors, namely
- The applicable prices for varied sizes of cogeneration equipment were based of the 2012 Cogeneration act, and can be found in Table 2.8.
- Finally, the calculation was based on 14 typical CHPP and their capacity parameters, costs and revenue, as seen in Table 2.9.
Plants entitled to a
surcharge By Capacity
Cogeneration euro
charge Payment Period
Small CHPP up to and including 50k𝑊𝑒𝑙
5.41 cents/kWh
10 years or 30000 hours’ full load operation (FLO); fixed payment possible for plants < 2kW Small plants >50k𝑊𝑒𝑙 50-250k𝑊𝑒𝑙 4.00 cents/kWh 30000h FLO >250k𝑊𝑒𝑙 2.40 cents/kWh New high-efficiency plants
<50k𝑊𝑒𝑙 5.41 cents/kWh 30000h FLO (for plants
in emissions trading, the surcharge rises as of 1 January 2013 by 0.3 cents/kWh) 50-250k𝑊𝑒𝑙 4.00 cents/kWh 250k𝑊𝑒𝑙 – 2M𝑊𝑒𝑙 2.40 cents/kWh >2M𝑊𝑒𝑙 1.80 cents/kWh Modernised/ retrofitted high- efficiency plants (>2M𝑊𝑒𝑙)
As for new high efficiency plants
As for new high-efficiency plants
Max. 30000h FLO (plants <50k𝑊𝑒𝑙: max.
10 years or 30000h FLO)
Table 2. 8 2012 Cogeneration Act surcharge rates (Eva-Maria Klotz et al., 2014) Private Households and CTS
This analysis considered individual properties in the private household and the CTS sector to compare the economic viability of various heat supply options, based on the net present value of typical applications (Eva-Maria Klotz et al., 2014).
The assumptions made, included:
- Heat pumps are considered only in new buildings.
- In the residential sector, four single-houses, and eight apartment blocks, was selected as a standard sample.
- Centralized building heating systems (Block Heat and Power Plant (BHPP)) are not considered for private households in apartment blocks.
- In the CTS sector, the economic viability of BHPP depends enormously on the specific building and the perspective taken.
- For the case of BHPP five parameters were calculated:
o A cogeneration Index, qualifying the solution (power production/heat production).
o Specific investment sum. o Specific fixed operating costs. o Specific variable operating costs.
- In the CTS sector, the following three typical applications were considered: o Hospital with heat requirement of 2000 MWh/year
o Office building with heat requirement of 100MWh/year.
o Commercial undertaking with heat requirement of 2000 MWh/year. - For one-family house, both air-water heat pumps and brine-water heat pumps
are taken into account, both in combination with geothermal sources and solar water heaters. Plant BHPP 1 BHPP 2 BHPP 3 BHPP 4 BHPP 5 ST1 GT1
Network level Low Voltage Medium Voltage
Size k𝑊𝑒𝑙 1 5 50 500 200 5000 1000
0 Investment cost incl.
planning costs 𝐸𝑈𝑅2013/kW 150000 5300 2750 1300 850 1500 800 Efficiency rating - electrical % 26% 27% 34% 39% 42% 25% 30% Efficiency rating - thermal % 66% 66% 57% 51% 48% 60% 55% Efficiency rating – overall % 92% 93% 91% 90% 90% 85% 85% Calculation period a 10 10 10 15 15 15 15
Fixed operating costs 𝐸𝑈𝑅2013/kW,
a 280 110 30 15 10 10 16 Variable operating costs 𝐸𝑈𝑅2013/MW h 60 40 25 13 9 8 6 Revenue from network user fees saved 𝐸𝑈𝑅2013/MW h 7 7 7 5 5 5 5 Plants: BHPP 6
G&S 1 G&S 2 G&S 3 G&S 4 Coal
1
Coal 2
Network level MV High Voltage
Size k𝑊𝑒𝑙 10000 20000 100000 200000 450000 4000
00
8000 00 Investment cost incl.
planning costs 𝐸𝑈𝑅2013/kW 700 1300 1300 1200 1100 1500 Efficiency rating - electrical % 46% 35% 45% 50% 55% 38% 45% Efficiency rating - thermal % 42% 53% 43% 38% 33% 15% 15% Efficiency rating – overall % 88% 88% 88% 88% 88% 53% 60% Calculation period a 15 20 20 20 20 20 20
Fixed operating costs 𝐸𝑈𝑅2013/kW,
a 9 20 16 16 16 24 22 Variable operating costs 𝐸𝑈𝑅2013/MW h 6 4 1.8 1.5 1.5 3 2.5 Revenue from network user fees saved
𝐸𝑈𝑅2013/MW
h
5 2 2 2 2 2 2
Preliminary conclusions showed that
- For BHPP applications, large apartment block are large preferable to small residential buildings.
- In the CTS, the economic viability of BHPP depends enormously on the specific building.
Industrial Cogeneration
For industrial case in order to determine the economic viability of private generation in a CHPP, the electricity production costs were compared to the costs of purchasing electricity from third parties, which depend on the quantity purchased, the voltage level and the energy intensity, as well as the negotiating skills of the individual undertaking, which may vary within very wide margins. (Eva-Maria Klotz et al., 2014).
The analysis of industry allowed the identification of 6 typical applications of cogeneration, as shown in table 2.10 with their average characteristics.
Designation Unit Type of plant BHPP Steam turbine Gas Turbine Gas and Steam Turbine
Size of plant (el.) kW/MW 50kW 500kW 2MW 5MW 10MW 20MW
Network Level Voltage LV MV MV MV/HV MV HV
Application - Property cogeneration Property Cogeneration, DH, Industry
Industry Industry Industry, DH Investment cost
incl. planning costs
Euro2013/kW 2750 1300 850 1500 800 1300 Lifetime years 10 10 15 15 15 15 Efficiency rating - electrical % 34 39 42 25 30 35 Efficiency rating – thermal % 57 51 48 60 55 53 Overall efficiency rating % 91 90 90 85 85 88 Fixed operating costs 𝐸𝑈𝑅2013/kW, a 30 15 10 10 16 20 Variable operating costs 𝐸𝑈𝑅2013/MWh 20 13 9 8 6 4 Revenue from network user fees saved 𝐸𝑈𝑅2013/MWh 7 5 5 5 5 2 Cogeneration Act cogeneration surcharge 𝐶𝑒𝑛𝑡/𝑘𝑊ℎ 5.41 3.34 32.64 2.43 2.27 2.18
Table 2. 10 Characteristics of CHPP Types of Plants (Eva-Maria Klotz et al., 2014)
For the analysis fuel taxes were not considered and the renewable energy sources (RES) act and cogeneration levies were disregarded (Eva-Maria Klotz et al., 2014).
In a following step, they analyzed the cost-effectiveness of trigeneration as a way to increase the utilization of CHPP in the summer. However, the high cost of absorption
chiller compared with conventional compression chiller, makes this option only viable in very specific situations, namely in the chemical industry or food industry.
The economic viability of Organic Rankine Cycle (ORC) plants was also assessed. This thermodynamic cycle uses organic substances with a low boiling point as its working thermofluid. The use of this fluid allows the use of heat sources between 90ºC and 450ºC, ORC use heat sources, namely ground heat, waste heat from use of biomass, industrial waste heat, etc. (Eva-Maria Klotz et al., 2014).
Analysis of the Potential
In the case of Private Households and CTS, 41 representative model towns were used, extrapolating the results for comparable towns (Eva-Maria Klotz et al., 2014). A distinction was made when determining potential between:
- The potential of settlement cogeneration (urban heating) - The potential of property cogeneration.
Potential of heat line-bound cogeneration.
For the calculation of this value, a number of assumptions were made, namely: - The heat requirement must be estimate or extrapolated for all towns. - A large number of towns (model towns) was investigated in detail.
- These model towns were also clustered in order to take account of different settlement conditions
- The town clusters were analyzed in an economic viability calculation to determine the economic viability of district heating cogeneration.
- Finally, the information obtained from the clusters and model towns was used to extrapolate the settlement cogeneration potential for Germany.
41 model tows
Determine economically viable cogeneration potential per town
category Prepare town grids and clusters
Economic viability calculation for 1403 clusters
Heat requirement determined by property
Determine input data Economic viabilit y
Building statistics of 4598 associations of municipalities of municipalities/towns in
Heat Requirement per
Classify in nine town categories
Heat requirement of town categories
Extrapolate district heating cogeneration in Germany
Typology value per building
In base of the number of inhabitants for km2 of settlement area, nine categories were
defined as shown in Table 2.11.
Category Town Categories Number
Old Federal States:
I Municipalities with more than 350 000 inhabitants 14 II Municipalities with 150 001 to 350 000 inhabitants 30 III Municipalities with 80 001 to 150 000 inhabitants 48 IV Municipalities with 50 001 to 80 000 inhabitants 79 V Municipalities with 20 000 to 50 000 inhabitants 476 VI Municipalities with 20 000 to 80 000 inhabitants in the periphery of a city. 22
Total Old Federal States: 669 New Federal States:
VII Municipalities with more than 80 000 inhabitants 14 VIII Municipalities with 20 000 to 80 000 inhabitants 97 Total new federal states: 111
Total in Germany: 780 Other:
Municipalities with fewer than 20 000 inhabitants 3818 Table 2. 11 Town Categories (Eva-Maria Klotz et al., 2014, p. 58)
The study of economic viability has been performed for each of the 1403 existing clusters in accordance with the following conditions:
- The distribution costs are divided in practice between the energy supply companies and customers, such that the customers pay an additional connection cost.
- Competitive distribution heat price is not differentiated by region for this investigation, in the case of buildings that have an annual heat requirement of 20-400GWh/y, but in the smaller buildings, the initial investment is bigger than in large buildings, in this the price of fuel are more relevant.
- Specific production cost depends primary on the CHPP used but also on insurance and administrative costs, distribution costs, costs of crowding out natural gas
Potential Cogeneration.
Based on the results of the model cost-benefit analysis is determinate the settlement cogeneration potential analysis.
The approach used the following operations, carried out to calculate a national potential (Eva-Maria Klotz et al., 2014), namely:
- The numerical data for economic viability testing of a property cogeneration solution, were formed and prepared based on town clustering and the results of the district heating cogeneration potential.
- A full cost comparison based on the results of the cost-benefit analysis, order to determine the lowest heat requirement for each type of building.
- An economic viability test was carried out for each building.
- The size of the CHPP was calculated to obtain the cogeneration index, and the quantities of cogenerated heat and power were than determined for each property.
- The results were used to determine the potential of nine town categories. Potential of Industrial Cogeneration, including use of waste heat.
This potential was determined for two cases. First a possible reference development was outlined (baseline scenario) and then a policy-driving variation was considered.
The baseline scenario essentially assumed that the basic conditions that apply at the date of the reported work will continue to apply.
According to (Eva-Maria Klotz et al., 2014) the potential is determined from:
- An analysis of heat requirement up to 300ºC of the individual branches in 2012 which could theoretically be satisfied by cogeneration heat.
- An estimate of its development in the following decades.
- Assumptions on the technology used and their specific power as well as from the heat production conditions of the resultant cogenerated power production.
2.2.5 Comparison of the Presented Methodologies.
The four, methodologies reviewed in the previous sections followed different strategies, although aiming essentially the same output. Their differences come in part from the use of data sets of different natures, but a summary of their advantages and disadvantages is presented in Table 2.12.
2.3 Development of Cogeneration
During the last 25 years cogeneration experimented an important development worldwide, mainly due to the growing price of petroleum and numerous incentives promoted by the governments. These factors make cogeneration economically attractive for private investments.
Cogeneration contributes with a significant share of the global electric energy. An example of this are the USA represents around 8% of the total generated energy (Anne Hampson et al., 2016).
Spain had a considerable increase in cogeneration between 1993 and 2002, mainly due to economic incentives for cogeneration in the UE, and the high price of fossil fuels (Ministry of Industry, Energy and Tourism of Spain, 2016).
Considering the continuous increase in fuel prices, and the requirement to elevate general efficiency in the industry to reduce greenhouse emissions: cogeneration will be and interesting option in the future
Figure 2. 11 Annual and cumulated installed power of cogeneration in Spain (Ministry of Industry, Energy and Tourism of Spain, 2016)
COUNTRY STRENGTHS WEAKNESSES
USA Considered three different markets for CHP, allowing to a gathering of more exhaustive information
Requires a considerable database to evaluate potential.
PORTUGAL Agriculture and fishing industries were considered as an isolated sector.
The cogeneration potential is restricted by the European directive definitions.
The total reliance on external information limits the accuracy of the study.
SPAIN A detailed work to obtain information was carried out
The cogeneration potential is restricted by the European directive definitions.
The detail level in the study requires high resources and time of development.
GERMANY The use of economic indicators to evaluate cogeneration produce realistic results.
The cogeneration potential is restricted by the European directive definitions.
Significant requirements regarding historic data.
2.4 Market Characteristics
The Electric market in Ecuador is a monopoly managed by the National Government. Rules for a free electric market do not exist, but some regulations for renewable energy generation were in operative until 2016, namely:
- CONELEC 001/09: introduction of cogeneration - ARCONEL 004/15: introduction of renewable energy.
- CONELEC 003/11: determination of the price of generation and autogenerating projects
These regulations were operative until 2016. Today, clear rules for especial generation systems do not exist. For this reason, the implementation of new forms of alternative energies stopped.
3. METHODOLOGY
3.1 Objectives
The main objective of this chapter is to determine the cogeneration potential in the industrial sector. A technical and economic characterization is made, considering there are no regulations or laws available that will allow preferential market prices.
3.2 Ecuador Energy Outlook.
Ecuador is located in northeast South America. Its economy mainly depends on oil exploitation, followed by the services sector. There is also a small contribution from its industrial sector, focused primarily on meeting the basic needs of the population. Although oil exploitation remains Ecuador’s main economic activity, the country lacks the necessary industrial infrastructures needed to elaborate products from this raw material. Additional oil refineries have not been built accordingly, to meet the needs of the country, and so as the difference between the internal consumption of fuel and production increases, the government is forced to import the growing difference.
Table 3.1 illustrates the importation of energy to Ecuador, and Figure 3.1 shows the difference between supply and demand.
The main problem is clearly the consumption of regular gasoline and diesel. The consumption of fuel by sector is an important indicator and Figure 3.2, indicates the consumption of different fuels.
ITEM |YEAR 2004 2005 2006 2007 2008 2009 2010 2011 2012 2013 2014 Electricity 1018 1069 974 534 310 695 541 803 148 411 519 LPG 4796 5369 5649 6499 6222 6083 6294 6522 6038 3409 7191 Gasolines 4138 5374 5496 6928 5542 8355 10838 11250 12691 14275 17737 Kerosene/Jet Fuel 67 78 53 77 248 Diesel Oil 5540 8122 11325 11845 11160 14460 19930 15089 17023 20841 24970 Fuel Oil 915 2551 2858 3207 3647 2312 3229 3663 2804 2157 1079 Total Secundaries 16407 22485 26302 29013 26948 31983 40885 37327 38704 41170 51744
Table 3. 1 Energy Import (kBOE) (David Delgado, 2015)
Also noteworthy is the consumption of electric energy. In recent years, the government has made a significant investment in this sector, which has contributed to a decrease in the dependency of thermal power plants, reducing fuel consumption and gas emissions. Figure 3.3 illustrates the contribution of each type of power plant to the electric grid.
Figure 3. 1 Comparison of Supply and Demand of Oil Products (David Delgado, 2015, p. 24)
Figure 3. 2 Economic sectors’ energy consumption by energy sources (David Delgado, 2015, pp. 30–31)
Considering these facts, and focusing on the study of the industrial sector as our main objective, the possibility of improving energy efficiency is presented, leading to an improvement in the economy of industries by reducing operating costs as well as fuel consumption, and therefore also reduction of the emission of greenhouse gases.