Repositório ISCTE-IUL
Deposited in Repositório ISCTE-IUL: 2019-01-17Deposited version: Post-print
Peer-review status of attached file: Peer-reviewed
Citation for published item:
Sarikaya, C.K., Akbar, D., Ribeiro, M. A. & Altan, H. (2018). Understanding the detection mechanism of mm wave radiation in glow discharge detectors. In Millimetre Wave and Terahertz Sensors and Technology XI 2018. Berlin: SPIE.
Further information on publisher's website: 10.1117/12.2324440
Publisher's copyright statement:
This is the peer reviewed version of the following article: Sarikaya, C.K., Akbar, D., Ribeiro, M. A. & Altan, H. (2018). Understanding the detection mechanism of mm wave radiation in glow discharge detectors. In Millimetre Wave and Terahertz Sensors and Technology XI 2018. Berlin: SPIE., which has been published in final form at https://dx.doi.org/10.1117/12.2324440. This article may be used for non-commercial purposes in accordance with the Publisher's Terms and Conditions for self-archiving.
Use policy
Creative Commons CC BY 4.0
The full-text may be used and/or reproduced, and given to third parties in any format or medium, without prior permission or charge, for personal research or study, educational, or not-for-profit purposes provided that:
• a full bibliographic reference is made to the original source • a link is made to the metadata record in the Repository • the full-text is not changed in any way
The full-text must not be sold in any format or medium without the formal permission of the copyright holders.
Serviços de Informação e Documentação, Instituto Universitário de Lisboa (ISCTE-IUL) Av. das Forças Armadas, Edifício II, 1649-026 Lisboa Portugal
Phone: +(351) 217 903 024 | e-mail: [email protected] https://repositorio.iscte-iul.pt
Understanding the detection mechanism of mm-wave radiation
in glow discharge detectors
Cemre Kusoglu Sarikaya*
a, Demiral Akbar
a, Marco A. Ribeiro
b, Hakan Altan
aa
Dept. of Physics, Middle East Technical University, 06800, Ankara, Turkey;
bDept. of Information
Science and Technology, ISCTE-University Institute of Lisbon, 1649-026, Lisbon, Portugal
ABSTRACT
Sub-mm and mm waves are used in many applications such as spectroscopy and imaging, detection of weapons concealed under clothing, detection of diseases and non-destructive product inspection. By developing the THz detection mechanisms, the quality of this usability can be enhanced considerably. The commercial detectors currently used to detect THz waves range from Shottky diodes to bolometers, Golay cells and pyroelectric detectors. However, many of these detectors have limitations in terms of speed and responsivity. In addition, they have a common disadvantage of being expensive. For these reason, glow discharge detectors (GDDs) can be a good alternative since they are cheap and can detect mm-wave or THz radiations without the aforementioned limitations. To obtain optimal detection parameters, one needs to understand the interaction of the radiation with the plasma particles. In the literature, efforts to explain this interaction has focused on qualitative descriptions with analytical models. However, these theories have not been tested with real discharge parameters. For that reason, in this study, the plasma in the GDD is simulated by using previously developed parallel 1d3v Particle in Cell/Monte Carlo Collision (PIC/MCC) code to obtain the plasma parameters and determine the gas mixture ratios. Initial results show that the discharge current approximates the current measured through the home built glow discharge detector. Using these results an accurate simulation of the GDD discharge parameters has been performed. This platform will allow for understanding the effect of mm sub-mm radiation when added to the simulation which can aid in understanding optimum detection parameters.
Keywords: Glow discharge detectors, mm-wave, THz radiation
1. INTRODUCTION
Applications based on THz and mm-waves are now being encountered in many areas. However, the detection mechanisms of these waves are expensive and their limitations in terms of speed and response time prevent these waves from being used efficiently. However, recent studies1,2,3,4 have shown that the performance of neon lamps or glow discharge detectors (GDDs) is the same as that of detectors available today which are pyroelectric detectors, Golay cells, bolometers and Schottky diodes, and even better in terms of speed and response time. Moreover, the cheapness of these lamps is another advantage of them. For that reason, investigation of the usability of the GDDs for THz and mm-wave detection is of great importance.
The detection mechanism of GDD is based on the radiation-plasma interaction. It is known that the plasma frequency in the discharge tube (sub-GHz to GHz range) is smaller than THz and mm-wave frequency1,5. For that reason, these waves can penetrate through the plasma. It is thought that during this penetration, electrons absorb the energy from electromagnetic waves and the discharge current changes as a result of cascade ionization and diffusion current6. Cascade ionization leads to an increase in the discharge current, while as a result of the diffusion current, there is a decrease. During the interaction, it is thought that both of these events have occurred, but that one is dominant6. Indeed, in some studies with GDDs, it was observed that the discharge current decreased after the interaction2, while it increased in some other studies1,6. These theories provide a great contribution to understanding GDD, but are limited to analytical models and qualitative explanations. Yet, there is no clear explanation of the physical events that occur as a result of the interaction between THz/mm-wave and the plasma in GDD. For this reason, in this study, GDD simulation is performed with the previously developed7 parallel 1d3v PIC/MCC code. With this simulation, first, it is aimed to determine the unknown parameters of the plasma in GDDs. In order to be able to do this, the simulation results should be tested for compatibility with the experimental results.
In the following section, this test is performed by simulating the experiment in the home built discharge chamber, which was built and designed in our laboratory, with certain parameters and comparing the experiment and simulation results. After showing that the simulation result is compatible with that of experiment, the studies for determining the plasma parameters in GDDs are explained in Section 3. Finally, the results obtained are discussed in Section 4.
2. VALIDATION OF THE SIMULATION CODE
As known, GDDs are low pressure non-local thermal equilibrium plasma lamps. Since the energy exchange between the particles in these type of plasmas does not take place efficiently, these particles must be examined with a kinetic model. For this reason, in this study, the PIC/MCC code, which can be used to explain kinetic behaviors of particles, is used to understand GDDs. The code is written in Fortran 90 language and parallelized with OPEN MPI library to improve the performance7. Before starting to use this code for GDDs, the code was tested by simulating the experiment performed in home built discharge chamber, designed and built in our laboratory, with certain parameters to show whether the code could give the experimental results. In the experiment, the Ar gas was held at a constant pressure of 1.7 Torr at a distance of 1.2 mm between the electrodes. The background pressure is reduced to 0.01 Torr.
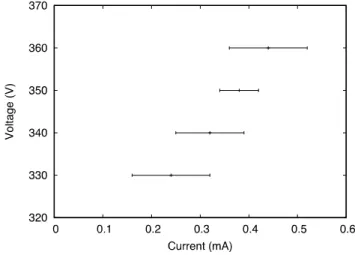
Figure 1. The voltage-current characteristic obtained for argon gas in the home built plasma discharge chamber.
Figure 1 shows the voltage-current characteristic obtained for Ar gas. It is understood that a current of 0.38 0.04 mA is obtained under the potential difference of 350 Volts. Considering this value, the experiment is simulated. In the simulation, between electrons and neutrals, elastic, excitation and direct ionization; between ions and neutrals, isotropic scattering and backward scattering are taken into consideration. Collision cross section graphs describing these collisions are shown in Figure 2 and Figure 3. Numerical parameters used in the simulation are summarized in Table 1.
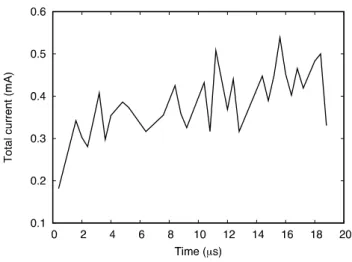
As a result of the simulation, the total current including electron, ion and displacement current is obtained with respect to time (Figure 4). As can be seen from the graph, the current is fixed at about 0.4 mA. This result shows that the code can obtain experimental results and thus it can be used to determine unknown plasma parameters of GDD.
Figure 2. Elastic, excitation, direct ionization cross section curves for electrons in Argon gas8.
Figure 3. Isotropic and backward scattering cross section curves for ions in Argon gas9.
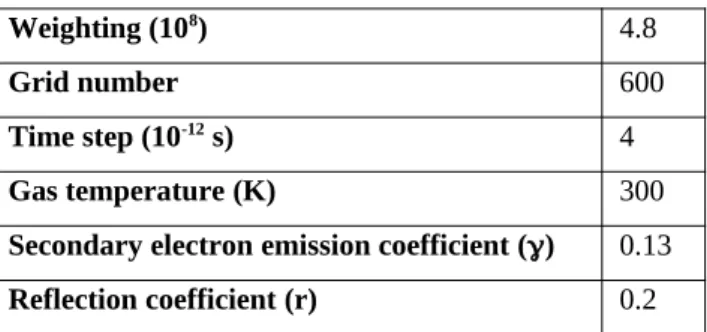
Table 1. The numerical parameters used in the PIC/MCC simulation of Argon gas.
Weighting (108) 4.8
Grid number 600
Time step (10-12 s) 4
Gas temperature (K) 300
Secondary electron emission coefficient () 0.13
Figure 4. The change of the total current with time as a result of the simulation of Ar glow discharge.
3. PARALLEL 1D3V PIC/MCC SIMULATION OF GDD
3.1 Model
Parallel 1d3v PIC/MCC simulation of GDD is performed by using Neon gas and Ne-Ar mixture separately. The collision types considered between electrons and neutrals and the cross section curves describing these collisions can be seen in Figure 5. It is assumed that isotropic scattering and charge transfer collisions occur between ions and neutrals, with cross-section values11 of 210-19 and 310-19 m2, respectively.
Figure 5. Elastic, excitation, direct ionization curves for electrons in Neon gas10.
Besides all of these reactions, secondary electron emission and reflection reactions, which take place in the electrodes, also have an important effect on the plasma. When the electrode is thought to be tungsten, the secondary electron emission coefficient, , for the neon ion is known12 to be 0.2. However, it is known that coatings on electrodes are used
to reduce the work function in neon lamps. In the literature it has been stated13,14 that this coating reduces the work function by about 50-60%. For this reason, the secondary electron emission coefficient is increased in the simulation by the same amount. Remaining parameters used in the GDD simulation are summarized in Table 2.
Table 2. The parameters used in the PIC/MCC simulation of GDD.
Weighting (108) 5.2
Grid number 600
Time step (10-12 s) 4
Gas temperature (K) 300
Secondary electron emission coefficient () 0.35
Reflection coefficient (r) 0.2
3.2 Simulation Results
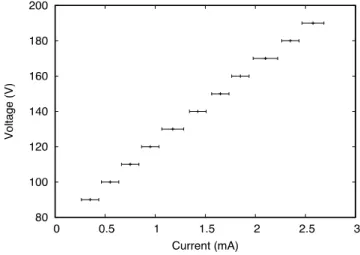
In order to determine unknown plasma parameters, firstly a voltage-current characteristic was obtained experimentally for a GDD with N520A code (Figure 6). In the circuit, a resistance of 47 k is connected in series to the GDD.
Figure 6. The current-voltage characteristic obtained for a GDD with N520A code.
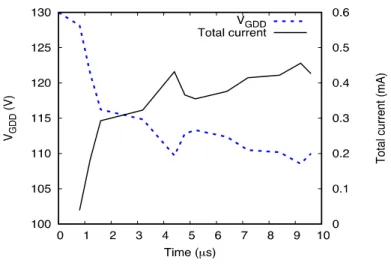
It is seen in Figure 6 that 1.18 0.11 mA current is obtained when a voltage of 130 Volts is applied. This applied voltage corresponds to a GDD voltage of 74.5 Volts. For this reason, in the simulation, the potential difference is initially set at 130 Volts and is set to decrease as the plasma is generated and the current increases. The change of the potential and the total current which includes electron, ion and displacement current over time for a pressure of 25 Torr can be seen in Figure 7. In order to obtain the experimental current value, the simulation results are examined for different pressures.
Figure 7. The change of the electric potential and the total current over time in GDD for a pressure of 25 Torr.
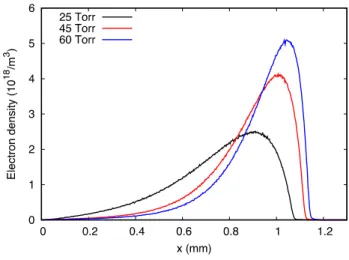
The change of the number of electron super particles with time (Figure 8) shows that converged results have not been obtained yet. For this reason, the simulation will continue until the number of super particles is fixed with respect to time. Looking at the intermediate results, firstly, a graph of electron density obtained for different pressure values can be seen in Figure 9. With the effect of the high secondary electron emission value, the maximum density observed near the cathode reveals the glow near the cathode which is observed in neon lamps.
Figure 8. Time-dependent change of electron super particle number obtained for different pressures in GDD.
It can be seen in the electric field and electric potential graphs (Figure 10) corresponding to these density profiles that the quasineutral region expands as the pressure increases, while the cathode region (the region where the electric field is high) becomes narrower. According to the potential profiles, the GDD potential, which should fall to 74.5 volts, appears to drop to 100 volts for 60 torr. Looking at the non-converged results, it is understood that the pressure of the GDD with
N520A code is higher than 25 Torr. However, it should be noted that these result may change after the number of super particles has converged.
Figure 9. Electron density distributions obtained for different pressure values by using pure neon.
Figure 10. Electric field and electric potential profiles obtained for different pressure values by using pure neon.
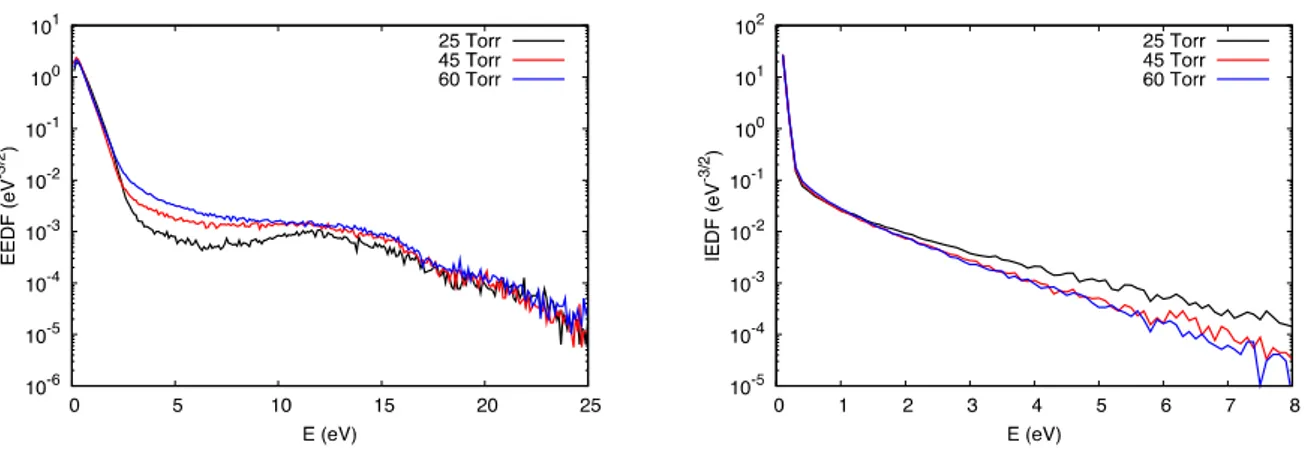
Electron and ion energy distribution functions (Figure 11) appear to be composed of two distinct regions of low and high energetic particles. The high energy particles are formed by the high electric field observed around the cathode, and the low energy particles are generated by the efficient elastic collisions in the quasineutral region. In the high energy region of the electron energy distribution function, a peak around 14 eV is observed. This peak is thought to be resulted from the acceleration of the electrons generated by secondary electron emission in high electric field. The disappearance of the peak with increasing pressure is a result of the particles making energy exchange more efficiently. In addition, high-energy ions are more likely to collide with neutrals and lose their high-energy via charge transfer collision with increasing pressure.
Figure 11. Electron and ion energy distribution function profiles obtained for different pressure values by using pure neon.
4. CONCLUSIONS
GDD is simulated using the previously developed7 parallel 1d3v PIC/MCC code to attempt to determine unknown plasma parameters. In order to obtain accurate results, the experiment performed in the home-built gas discharge chamber with certain parameters is simulated. It has been shown that the simulation results are consistent with those obtained from the experiment. The experimental current-voltage characteristic of the GDD is then obtained. In order to obtain the same characteristic, simulation results with different pressure values are examined. Although the converged results haven’t been obtained yet, the initial results show that the GDD with N520A code used in the experiment should have a pressure greater than 25 Torr. However, it should be noted that these results may change after super particle number has converged. In addition, the fact that the maximum density is observed in the cathode region explains why the glow is observed near the cathode in neon lamps.
ACKNOWLEDGEMENTS
The work was supported by the Scientific and Technical Research Council of Turkey (TUBITAK) 115F226. This research is also sponsored in part by the NATO Science for Peace and Security Program under grant MD.SFPP 984775. The simulations were performed using High Performance and Grid Computing Center (TRUBA Resources) at TUBITAK ULAKBIM.
REFERENCES
[1] Kopeika, N. S., “Glow discharge detection of long wavelength electromagnetic radiation: cascade ionization process internal signal gain and temporal and spectral response properties,” IEEE Trans. Plasma Sci. 6, 139-157 (1978).
[2] Abramovich, A., Kopeika, N. S., Rozban, D. and Farber, E., “Inexpensive detector for terahertz imaging,” Appl. Opt. 46, 7207-7211 (2007).
[3] Abramovich, A., Kopeika, N. S., Rozban, D. and Farber, E., “Terahertz detection mechanism of inexpensive sensitive glow discharge detector,” J. Appl. Phys. 103, 093306 (2008).
[4] Hou, L. and Shi, W., “Fast terahertz continuous-wave detector based on weakly ionized plasma,” IEEE Electron Device Lett. 33, 1583-1585 (2012).
[5] Kopeika, N. S. and Farhat, N. H., “Video detection of millimeter waves with glow discharge tubes: part I-physical description; part II-experimental results,” IEEE Trans. Electron Devices 22, 534-548 (1975).
[6] Kopeika, N. S., “On the mechanism of glow discharge detection of microwave and millimeter-wave radiation,” Proc. IEEE 63, 981-982 (1975).
[7] Kusoglu Sarikaya, C., Rafatov, I. and Kudryavtsev, A. A., “Particle in Cell/Monte Carlo collision analysis of the problem of identification of impurities in the gas by the plasma electron spectroscopy method,” Phys. Plasmas 23, 063524 (2016).
[8] “Compilation of electron cross sections used by A. V. Phelps,” http://jilawww.colorado.edu/ avp/collision_data/electronneutral/ELECTRON.TXT (4 May 2018).
[9] “Phelps database,” http://www.lxcat.net (4 May 2018).
[10] “Biagi database (Magboltz versions 8.9 and higher),” http://www.lxcat.net (11 April 2018).
[11] Cramer, W. H., “Elastic and inelastic scattering of low velocity ions: He+ in Ne, Ne+ in He, and Ne+ in Ne,” J. Chem. Phys. 28, 688-690 (1958).
[12] Hagstrum, H. D., “Auger ejection of electrons from tungsten by noble gas ions,” Phys. Rev. 104, 317-318 (1956).
[13] Bruining, H., [Physics and Applications of Secondary Electron Emission], Philips Research Laboratories, Eindhoven, Netherlands, (1954).