*Corresponding author: Ana Francisca Rozin Kleiner, Avenida Érico Veríssimo, s/n, Barão Geraldo, Cidade Universitária “Zeferino Vaz”, Caixa Postal 6134, CEP 13083-970, Campinas, São Paulo, Brazil, Tel: +5519 3521-6626; E-mail:
Received September 5, 2014; Accepted September 30, 2014; Published October 30, 2014
Citation: Kleiner AFR, Galli M, Rigoldi C, Carmo AA, Barros RM L (2014) Effects of Flooring and Hemi body on Ground Reaction Forces and Coefficient of Friction in Stroke Gait. Int J Neurorehabilitation 1: 122. doi:10.4172/2376-0281.1000122
Copyright: © 2014 Kleiner AFR. This is an open-access article distributed under the terms of the Creative Commons Attribution License, which permits unrestricted use, distribution, and reproduction in any medium, provided the original author and source are credited.
Keywords:
Stroke; Gait; Ground reaction forces; Coefficient of friction; FlooringIntroduction
Safe and independent walking at home or at public facilities requires gait pattern modifications to negotiate environmental features, such as the flooring. The new pattern that emerges in such a situation can be affected by many factors, for instance, the gender [1] and/or some pathological condition [2-6]. However, with few exceptions [7], most of the stroke gait studies have focused on measuring the walk in rehabilitation environments which may be less complex than the environment typically encountered in the home setting.
The required coefficient of friction (RCOF) is the minimum coefficient of friction (COF) necessary at the foot-floor interface to support walking, and has been compared to the environmentally available COF as an assessment of slip probability [8-10].The probability of a slip rises when either the friction that an individual utilizes increases or the available friction from the floor surface decreases [9]. The relationship between available friction and RCOF is an effective way of evaluating the interaction between intrinsic and extrinsic factors, giving a reliable estimate of the risk of slipping [10].
Previous studies have shown that peak RCOF varies with age [1], gender [1], limb dominancy [11,12] and the presence of a disability [2-6]. Those with a disability would appear to be at potentially greater risk owing to the largest changes in gait characteristics and GRFs.
Buczek et al. [2] found that persons with a disability (amputations, broken leg, osteotomy of the fifth metatarsal) had higher peak RCOF during level walking when compared to persons without a disability. Durá et al. [4] also examined a diverse sample including amputees, Parkinson’s disease, and stroke individuals. Their results suggested that the RCOF for all subjects other than amputees was similar to that for normal walkers, while that for the amputees was substantially higher (approximately 0.25 versus 0.39). Burnfield et al. [3] conducted a study to examine the difference in RCOF among young, healthy elderly, and elderly subjects with diabetes mellitus, lower extremity arthritis and unilateral stroke. No significant differences were found between any of
these groups, in agreement with Durá et al. [4]. The lack of significant differences in RCOF among subject groups suggested that individuals with the selected medical conditions were at no greater risk of slipping when walking at a self-selected step than were healthy older or younger adults.
Examination of the collective results of these studies [2,3], suggests that only one class of individuals with walking impairments (i.e., those with prosthetics/amputations) is likely to require higher levels of slip resistance than do normal walkers. Moreover, these studies [2-4] did not systematically examine a unique medical condition (i.e., stroke); different medical conditions analyzed at the same time can have higher data variability and enshroud some results.
With regards of these results [2-6] the first question of this study is: does the walking over different flooring affects the ground reaction forces (GRF) and RCOF in stroke patients, especially when the lower limb asymmetries are compared?
Studies suggested asymmetrical spatial-temporal, kinematic [13] and RCOF [11,12] differences between dominant legs and non-dominant legs in healthy young adults, most of the studies found no difference in leg strength between legs unless a young individual had experienced unilateral leg injury [14]. However, significant strength or power imbalance was presented in the elderly fallers in comparison to the non-fallers [15].
Abstract
The aim of this study was to investigate the possible effects of flooring and affected hemi body on the ground reaction forces and on the required coefficient of friction (RCOF) in stroke barefoot gait. Twenty-four volunteers participated in this study, being 12 stroke patients and 12 age-matched healthy subjects as control group. The participant was oriented to walk barefoot, on its own preferred speed, over two force plates on the following flooring: 1) homogeneous vinyl (HOV); 2) carpet; 3) heterogeneous vinyl (HTV); 4) mixed (the first half part of the pathway were covered by HOV and the second by HTV). All the four surfaces presented safe coefficient of friction (ranging from 0.44-0.55) and they are widely used in residences and public facilities. The flooring effect was found on RCOF during the toe off for the affected and unaffected side. Moreover, differences among hemi bodies for RCOF in heel contact and toe off phases were also observed. The control group presented higher RCOF than the stroke unaffected and affected side, and the unaffected showed higher friction than the affected side. In conclusion, the gait of stroke patient was altered due to the four flooring tested in the toe off phase.
Effects of Flooring and Hemi body on Ground Reaction Forces and Coefficient
of Friction in Stroke Gait
Ana Francisca Rozin Kleiner1,2,4*, Manuela Galli3,4, Chiara Rigoldi3, Aline Araújo do Carmo1,5 and Ricardo M L Barros1
1Laboratory of Instrumentation for Biomechanics, College of Physical Education, University of Campinas, Campinas, Brazil 2CAPES Foundation, Ministry of Education of Brazil, Brasília, Brazil
3Luigi Divieti, Posture and Movement Analysis Laboratory, Department of Electronics, Information and Bioengineering, Politecnico di Milano, Milano, Italy 4Motion analysis Lab, IRCCS San Raffaele Pisana, Via della Pisana, 235, Rome, Italy
Moreover, in pathological gait marked asymmetry has been noted between the stroke subjects’ affected and unaffected lower limbs. Decreased GRF have been reported on the affected limb relative to the unaffected limb in the gait of persons with stroke [16,17].
As shown, stroke gait analysis has increased in the last years, however, the possible effect of flooring in association with stroke hemibodies, on gait parameters such as ground reaction forces and friction, to the best of our knowledge, has not yet been studied. So, the aim of this study was to investigate the effect of flooring in the GRF and foot/floor friction during stroke gait considering this population’s lowers limb asymmetry (affected and unaffected lower limbs). It was hypothesized that: the stroke group will exhibit lower RCOF than the healthy age-matched peers, especially when the different flooring types are compared.
Methods
The Research Ethics Committee approved this study (protocol No. 319/2011) and the volunteers gave written informed consent to participate.
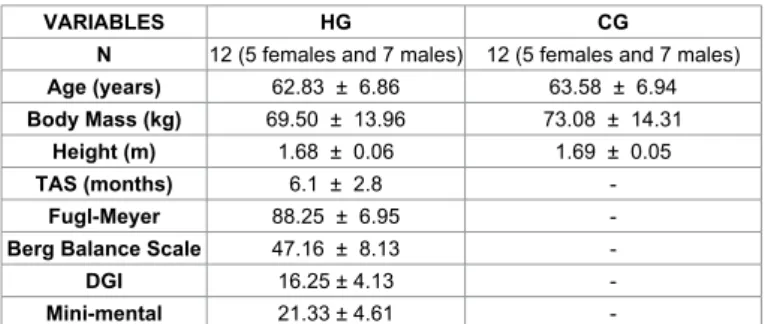
The hemiparetic group (HG) consisted of 12 individuals affected by stroke and the control group (CG) consisted of 12 healthy adults. The Table 1 describes the anthropometric data for each group.
Three flooring types under four different experimental conditions were selected and experimentally tested previously to evaluate study volunteers:
Homogeneous vinyl (HOV)
Homogeneous single layered vinyl flooring, Pavifloor prisma tile, 2mm thickness, 2X8m, (ref 909, Charcoal)/ Tarkett Fademac.
Heterogeneous vinyl (HTV)
Compact flexible vinyl floor covering, Floor Chinese teak/ natural, 2,50mm thickness, 2X8m (imagine Wood)/ Tarkett Fademac.
Carpet
Needle punch carpets, Needle punch carpet plain quality - 100% pet fiber, 2mm thickness, 2X8m (Flortex eco)/ Inylbra.
Mixed
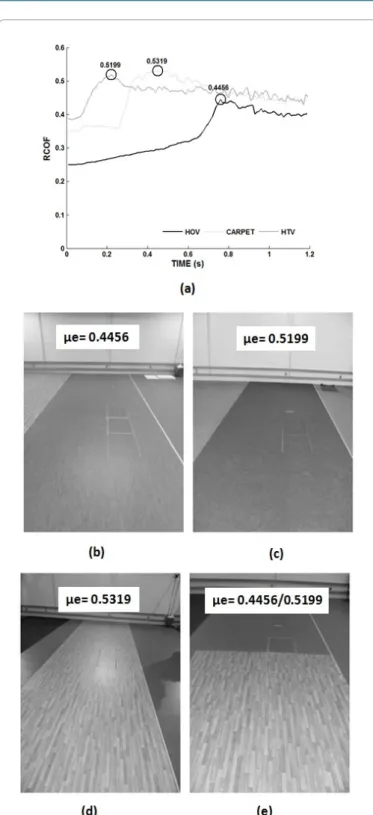
To simulate the situations where a person walks from a room to another and the flooring changing during this task the mixed condition was included. As illustrated in Figure 1d, the first 4m of the pathway were covered by HTV and the second 4m of the pathway were covered by HOV.
In order to characterize the flooring used in this study, the static coefficient of friction (μe) was calculated using the pulley test. The chosen flooring was positioned on a force platform (Kistler 9286BA) and over this flooring a halter was positioned (H1) weighing18.42 kg. The H1 was pulled by another halter (H2) weighing17.32 kg. H1 was connected to H2 by a steel cable which slid on a system of three rollers, one fixed on the floor and two on the laboratory roof. Analyzing the curve of coefficient of friction provided by the force plate along time, the μe was determined as the maximum friction previous to the movement start. The Figure 1a illustrates the COF curves. All the flooring chosen for this study presented μe values around 0.5 within standards of safety according to Templer (1992) and Miller (1983), (Figures 1a-1d).
The participants were oriented to walk barefoot, at him/her self selected speed, along the pathway covered by the experimental flooring and over two force platforms (Kistler 9286BA), embedded in the data collection room floor, as shown in Figure 1. The participants were aware of the position of the force plates. Three trials for each experimental condition were performed. Because of the difficulties associated with changing flooring conditions, all subjects completed each flooring treatment condition in the same order, with the HOV as the first condition, Carpet the second, HTV the third and mixed as the last condition.
The force plates’ GRF data were normalized by the subject body weight (%BW) and expressed in function of the percent of support phase. Data acquisition was performed using BioWare software (Version 4.0.x). Kinetic raw data were filtered using a 2nd order
low-pass digital Butterworth filter, with a cut-off frequency of 10 Hz. An algorithm developed in Matlab was used to filter raw data and to calculate dependent variables.
The independent variables were: type of flooring surface (HOV, HTV, carpet and mixed) and hemibody (the hemibody of stroke patients were classified as affected (AS) or unaffected (US) and the control group left limb (CG).
The variables used in the study were obtained from the GRF components curve and the coefficient of friction (COF) curves as described below:
The Fz GRF component
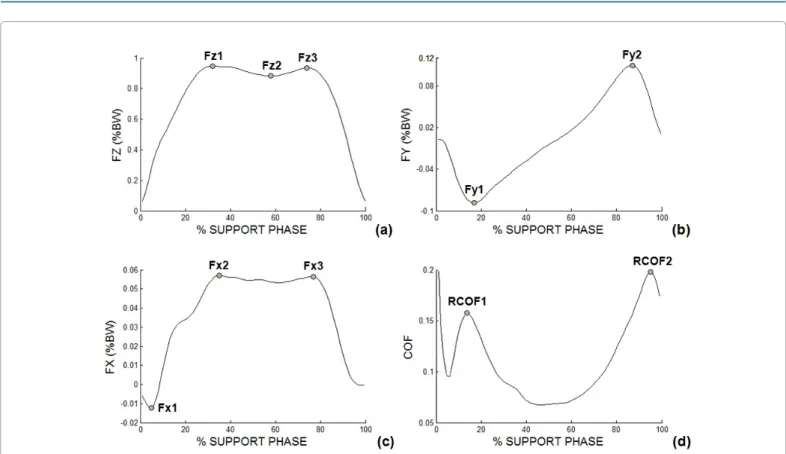
Has a greater magnitude than the other GRF components (anterior-posterior and lateral) and it is characterized by two peaks and one valley. So, for this component the following discrete variables were calculated: first peak of impact (Fz1), maximum value of first curve peak; valley (Fz2), minimum value between the first and the second peak of the vertical component curve; and the propulsion peak (Fz3), maximum value of the second curve peak (Figure 2a).
The Fy GRF component
Have a negative phase (deceleration) during the first half of support and a positive phase (acceleration) during the other half of support. So, for this GRF component, the discrete variables were: negative phase (deceleration or braking - Fy1), minimum value of the anterior-posterior GRF in the first half of the support phase and positive phase (acceleration - Fy2), maximum value of the anterior-posterior GRF in the second half of the support phase (Figure 2b).
The Fx GRF component
has a very small magnitude, and its variability component may be due to the diversity in foot positioning, which may be pointing inwards
VARIABLES HG CG
N 12 (5 females and 7 males) 12 (5 females and 7 males)
Age (years) 62.83 ± 6.86 63.58 ± 6.94
Body Mass (kg) 69.50 ± 13.96 73.08 ± 14.31
Height (m) 1.68 ± 0.06 1.69 ± 0.05
TAS (months) 6.1 ± 2.8
-Fugl-Meyer 88.25 ± 6.95
-Berg Balance Scale 47.16 ± 8.13
-DGI 16.25 ± 4.13
-Mini-mental 21.33 ± 4.61
-Legend: N = number of participants; TAS = time after stroke; DGI = Dynamic Gait Index Scale; HG = hemiplegic group; CG = control group.
(adduction of the foot) or outwards (abduction of the foot) during the period of support. So, for this GRF component the discrete variables were: maximum lateral force (Fx1), minimum value of the curve; first maximum medial force (Fx2), maximum value of the curve on in the first half of the support phase; and second maximum medial force (Fx3), maximum value of the curve in the second half of the support phase (Figure 2c).
The RCOF
To determine this variable, the instantaneous COF is calculated
as the ratio of the shear to normal ground reaction force during stance (see equation 1 and Figure 2d) [8-10]. The RCOF1 is considered to be the local of the maximum in the instantaneous COF curve at ~20% of the stance phase (see Figure 2d). Another local maximum occurs at ~90% of the stance phase of gait during push-off, identified as ‘RCOF2’ in Figure 2d.
2 COF = ( ) ( )FY2 FX2
COF= FZ+
(1)
Contact time: defined as the time elapsed between heel strike and toe off and it is expressed in seconds.
For the statistical analysis, firstly the differences between right and left lower limbs for CG were tested. The Kolmoronov-Smirnov Test revealed non-normal distribution therefore Mann-Whitney Test (α ≤ 0.05) was applied. Since no statistical difference was found between limbs the left one was selected to represent the control group hemibody for all comparisons.
The comparisons among flooring type (HOV, carpet, HTV and Mixed) for each hemibody (affected, unaffected and control) were performed by the Friedman test for related samples. Also, the comparisons among hemibodies (AS, US and CG) for each flooring type (HOV, carpet, HTV and Mixed) were performed by the Kruskall-Wallis test for independent samples. Bonferroni pair-wise comparisons were computed for all-level of combination of factors and interactions. All differences in effect were analyzed in the SPSS ® software (SPSS for Windows, version 19.0) with a significant level α ≤ 0.05 for all tests.
Results
The ANOVA one way test revealed no significant differences between stroke and control groups for age (F1,23=0.071; p=0.793), body mass (F1,19=0.385; p=0.541) and height (F1,19=0.352; p=0.559).
There was difference regarding the flooring surface for the AS for the following variables: Fy1, Fy2 and RCOF2. The AS performed lower breaking, acceleration and RCOF2 during the walking on HOV in comparison to the other flooring. The Table 2 presents the statistical test results for the comparisons between AS and flooring conditions.
The same behavior was assumed by the US in the acceleration phase. Moreover, the US presented different behavior in RCOF2 for each flooring. The HOV and mixed presented lower RCOF2 than the other surfaces (see Table 2). However, there were no differences among surfaces and the ground reaction forces and RCOF variables for the control group.
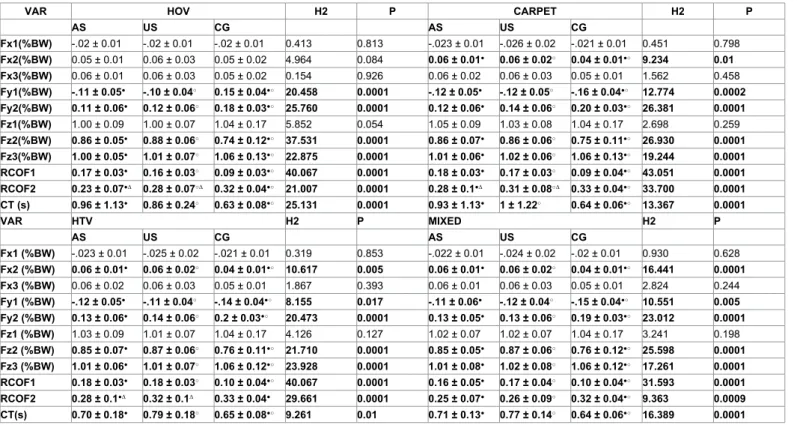
The Kruskall-Wallis test revealed differences among hemibodies and flooring type for: Fx2, Fy1, Fy2, Fz2; Fz3 and contact time. For these variables, in all the flooring conditions the stroke AS and US did not present differences, but differences were found between the stroke group with the control group. However, for the Fx2 there are no differences between hemibodies in the HOV. The Table 3 presents these comparisons among lower limbs (AS, US and CG) for each flooring type (HOV, carpet, HTV and Mixed). Moreover, for the RCOF1 and RCOF2 in the HOV, Carpet, HTV and Mixed conditions the stroke AS and US performed lower dynamic friction during the hell contact than CG (Table 3). Also the stroke AS performed lower RCOF during the push off phase than the stroke US and CG (Table 3).
Figure 1: Illustration of the static friction pattern (a) and the flooring conditions with the pulley tests results: Homogeneous Vinyl (HOV - b); Carpet (c); Heterogeneous Vinyl (HTV – d); Mixed (HOV and HTV – e).
Discussion
This study compared the gait of stroke patients to that of healthy age matched peers in an effort to quantify differences that may be predisposing the stroke population to falls in everyday environments.
When the hemibody effects were compared both AS and US for stroke group performed higher valley (Fz2) and lower propulsion peak (Fz3) than the CG, stroke patients may lose the heel-strike and push-off mechanism, altering the GRF pattern from ‘M’ to pathological shapes. These results are related to the stroke gait features, specially the main alterations found in the affected lower limb joints as decreased ankle, knee and hip flexion/extension range of motion [19].
The lost of the heel-strike and push-off mechanism during stroke gait also contributed for the anterior-posterior (Fy) and lateral (Fx) ground reaction force components. The stroke AS and US performed higher braking (Fy1) and lower forward propulsion (Fy2) when compared with the CG for the anterior-postior forces. At the lateral components, the stroke US medial maximum force (Fx2) showed higher values than the AS and control group. This is reflected by a hemiplegic gait with reduced knee flexion at toe-off and mid-swing in the paretic limb [20].
Not only the dynamic friction but also the first peak (Fz1) and the negative peak (Fy1) in shear force are considered to be the most critical with respect to slips resulting in falls [9]. The results of this study showed that stroke patients have lower breaking and acceleration ability respectively during the heel strike and the toe off. Thus, for this population, the forces specially occurring at toe off are of critical importance in determining if the frictional capabilities of the foot/floor
interface will be sufficient to prevent slips, and it also could be another relational aspect with increased falls occurrence of this population.
Contradicting Durá et al. [4] and Burnfield et al. [3], differences in hemibody for dynamic friction during the push off phase were also observed in this study. The control group presented higher dynamic friction than the stroke US and AS, and the US showed higher friction than the AS. Since the shear forces are higher near the heel contact and toe off phases [9,21] these are the moments where slips occur more often. The toe off causes backward slip on the sole forepart, which can be more easily counteracted by stepping forward with the leading foot during normal gait [22]. As a results of the lack of ankle range of motion the stroke patients don’t have the ability to easily counteracted the fall with this strategy.
Moreover, there were differences regarding the flooring surface for the stroke AS and US for RCOF2. It is well known that surface roughness plays an important role in floor slipperiness in walking shoes [23-25]. Our results confirm the same effect during the barefoot walking, more specifically when pathology is considered. It seems that even when stroke patients have loss of plantar proprioception [26] they are still able to detect the flooring roughness. However, false subjective perception of slipperiness might lead to an inappropriate gait pattern, which might result in higher probability of a slip-induced fall accident on the stroke population. So, understanding the relationship between the stroke gait parameters and friction demand characteristics may help identify slip prone individuals thereby reducing fall accidents.
Future studies should considerer the inclusion of spatiotemporal and kinematic variables such as the heel contact velocity and the
Figure 2: Illustration of the GRF component curves represented by the average curve for all stroke participants in the HOV condition and the discrete variables of the: (a) FZ - GRF vertical component; (b) FY - GRF anterior-posterior component; (c) FX - GRF lateral component; (d) COF – coefficient of friction. Legend: %BW: percentage of body weight.
VAR AFFECTED SIDE X2 P UNAFFECTED SIDE X2 P
HOV Carpet HTV Mixed HOV Carpet HTV Mixed
Fx1(%BW) -.02 ± 0.01 -.02 ± 0.01 -.02 ± 0.02 -.02 ± 0.01 1.941 0.585 -.022 ± 0.01 -.026 ± 0.02 -.025 ± 0.02 -.024 ± 0.02 2.094 0.553 Fx2(%BW) 0.05 ± 0.01 0.06 ± 0.01 0.058 ± 0.01 0.06 ± 0.016 1.309 0.727 0.06 ± 0.03 0.06 ± 0.02 0.06 ± 0.02 0.06 ± 0.02 1.111 0.774 Fx3(%BW) 0.06 ± 0.01 0.06 ± 0.02 0.06 ± 0.02 0,06 ± 0.018 0.266 0.966 0.06 ± 0.03 0.06 ± 0.03 0.06 ± 0.03 0.06 ± 0.02 1.413 0.703 Fy1(%BW) -.10 ± 0.05○● -.12 ± 0.05○ -0.12 ± 0.05● -.11 ± 0.061 8.378 0.039 -.104 ± 0.04 -.118 ± 0.05 -.111 ± 0.04 -.120 ± 0.04 6.936 0.074 Fy2(%BW) 0.11 ± 0.06○●+0.12 ± 0.06○ 0.13 ± 0.06● 0.13 ± 0.058+14.179 0.003 0.12 ± 0.06○●+ 0.14 ± 0.06○ 0.14 ± 0.06● 0.14 ± 0.06+ 19.291 0.001 Fz1(%BW) 1.00 ± 0.09 1.05 ± 0.09 1.03 ± 0.09 1.02 ± 0.07 5.431 0.143 1.00 ± 0.07 1.03 ± 0.08 1.01 ± 0.07 1.02 ± 0.07 3.519 0.318 Fz2(%BW) 0.86 ± 0.05 0.86 ± 0.07 0.85 ± 0.07 0.85 ± 0.053 2.024 0.567 0.88 ± 0.06 0.86 ± 0.06 0.87 ± 0.06 0.87 ± 0.06 4.853 0.183 Fz3(%BW) 1.00 ± 0.05 1.01 ± 0.06 1.01 ± 0.06 1.01 ± 0.07 3.543 0.315 1.01 ± 0.07 1.02 ± 0.06 1.01 ± 0.07 1.02 ± 0.08 1.292 0.731 RCOF1 0.17 ± 0.03 0.18 ± 0.03 0.17 ± 0.03 0.16 ± 0.05 2.911 0.406 0.16 ± 0.04 0.17 ± 0.03 0.17 ± 0.03 0.17 ± 0.04 4.911 0.178 RCOF2 0.23 ± 0.07○●+0.28 ± 0.1○ 0.28 ± 0.1● 0.25 ± 0.07+ 9.264 0.026 0.28 ± 0.07○● 0.31 ± 0.08○∞ 0.33 ± 0.1●∆ 0.26 ± 0.09∞∆ 18.633 0.0001 CT(s) 0.96 ± 1.13 0.93 ± 1.13 0.70 ± 0.18 0.71 ± 0.13 4.453 0.217 0.86 ± 0.24 1 ± 1.22 0.79 ± 0.18 0.77 ± 0.14 6.887 0.076
Legend: VAR = variables; %BW = normilized by body weight; CT = contact time; X2 = Friedman test values; P = p-values; ○ = differences between HOV and Carpet; ● =
differences between HOV and HTV; + = differences between HOV and Mixed; ∞ = differences between Carpet and Mixed; ∆ = differences between HTV and Mixed.
Table 2: Friedman test results: comparisons among flooring type (HOV, carpet, HTV and Mixed) for each lower limb (affected and unaffected) for each variable presented in means and standard deviations.
VAR HOV H2 P CARPET H2 P
AS US CG AS US CG Fx1(%BW) -.02 ± 0.01 -.02 ± 0.01 -.02 ± 0.01 0.413 0.813 -.023 ± 0.01 -.026 ± 0.02 -.021 ± 0.01 0.451 0.798 Fx2(%BW) 0.05 ± 0.01 0.06 ± 0.03 0.05 ± 0.02 4.964 0.084 0.06 ± 0.01● 0.06 ± 0.02○ 0.04 ± 0.01●○ 9.234 0.01 Fx3(%BW) 0.06 ± 0.01 0.06 ± 0.03 0.05 ± 0.02 0.154 0.926 0.06 ± 0.02 0.06 ± 0.03 0.05 ± 0.01 1.562 0.458 Fy1(%BW) -.11 ± 0.05● -.10 ± 0.04○ 0.15 ± 0.04●○ 20.458 0.0001 -.12 ± 0.05● -.12 ± 0.05○ -.16 ± 0.04●○ 12.774 0.0002 Fy2(%BW) 0.11 ± 0.06● 0.12 ± 0.06○ 0.18 ± 0.03●○ 25.760 0.0001 0.12 ± 0.06● 0.14 ± 0.06○ 0.20 ± 0.03●○ 26.381 0.0001 Fz1(%BW) 1.00 ± 0.09 1.00 ± 0.07 1.04 ± 0.17 5.852 0.054 1.05 ± 0.09 1.03 ± 0.08 1.04 ± 0.17 2.698 0.259 Fz2(%BW) 0.86 ± 0.05● 0.88 ± 0.06○ 0.74 ± 0.12●○ 37.531 0.0001 0.86 ± 0.07● 0.86 ± 0.06○ 0.75 ± 0.11●○ 26.930 0.0001 Fz3(%BW) 1.00 ± 0.05● 1.01 ± 0.07○ 1.06 ± 0.13●○ 22.875 0.0001 1.01 ± 0.06● 1.02 ± 0.06○ 1.06 ± 0.13●○ 19.244 0.0001 RCOF1 0.17 ± 0.03● 0.16 ± 0.03○ 0.09 ± 0.03●○ 40.067 0.0001 0.18 ± 0.03● 0.17 ± 0.03○ 0.09 ± 0.04●○ 43.051 0.0001 RCOF2 0.23 ± 0.07●∆ 0.28 ± 0.07○∆ 0.32 ± 0.04●○ 21.007 0.0001 0.28 ± 0.1●∆ 0.31 ± 0.08○∆ 0.33 ± 0.04●○ 33.700 0.0001 CT (s) 0.96 ± 1.13● 0.86 ± 0.24○ 0.63 ± 0.08●○ 25.131 0.0001 0.93 ± 1.13● 1 ± 1.22○ 0.64 ± 0.06●○ 13.367 0.0001 VAR HTV H2 P MIXED H2 P AS US CG AS US CG Fx1 (%BW) -.023 ± 0.01 -.025 ± 0.02 -.021 ± 0.01 0.319 0.853 -.022 ± 0.01 -.024 ± 0.02 -.02 ± 0.01 0.930 0.628 Fx2 (%BW) 0.06 ± 0.01● 0.06 ± 0.02○ 0.04 ± 0.01●○ 10.617 0.005 0.06 ± 0.01● 0.06 ± 0.02○ 0.04 ± 0.01●○ 16.441 0.0001 Fx3 (%BW) 0.06 ± 0.02 0.06 ± 0.03 0.05 ± 0.01 1.867 0.393 0.06 ± 0.01 0.06 ± 0.03 0.05 ± 0.01 2.824 0.244 Fy1 (%BW) -.12 ± 0.05● -.11 ± 0.04○ -.14 ± 0.04●○ 8.155 0.017 -.11 ± 0.06● -.12 ± 0.04○ -.15 ± 0.04●○ 10.551 0.005 Fy2 (%BW) 0.13 ± 0.06● 0.14 ± 0.06○ 0.2 ± 0.03●○ 20.473 0.0001 0.13 ± 0.05● 0.13 ± 0.06○ 0.19 ± 0.03●○ 23.012 0.0001 Fz1 (%BW) 1.03 ± 0.09 1.01 ± 0.07 1.04 ± 0.17 4.126 0.127 1.02 ± 0.07 1.02 ± 0.07 1.04 ± 0.17 3.241 0.198 Fz2 (%BW) 0.85 ± 0.07● 0.87 ± 0.06○ 0.76 ± 0.11●○ 21.710 0.0001 0.85 ± 0.05● 0.87 ± 0.06○ 0.76 ± 0.12●○ 25.598 0.0001 Fz3 (%BW) 1.01 ± 0.06● 1.01 ± 0.07○ 1.06 ± 0.12●○ 23.928 0.0001 1.01 ± 0.08● 1.02 ± 0.08○ 1.06 ± 0.12●○ 17.261 0.0001 RCOF1 0.18 ± 0.03● 0.18 ± 0.03○ 0.10 ± 0.04●○ 40.067 0.0001 0.16 ± 0.05● 0.17 ± 0.04○ 0.10 ± 0.04●○ 31.593 0.0001 RCOF2 0.28 ± 0.1●∆ 0.32 ± 0.1∆ 0.33 ± 0.04● 29.661 0.0001 0.25 ± 0.07● 0.26 ± 0.09○ 0.32 ± 0.04●○ 9.363 0.0009 CT(s) 0.70 ± 0.18● 0.79 ± 0.18○ 0.65 ± 0.08●○ 9.261 0.01 0.71 ± 0.13● 0.77 ± 0.14○ 0.64 ± 0.06●○ 16.389 0.0001
Legend: VAR = variables; %BW = normilized by body weight; CT = contact time; X2 = Friedman test values; P = p-values; ● = differences between AS and CG; ○ = differences
between US and CG; ∆ = differences between AS and US.
Table 3: Kruskall-Wallis test results: comparisons among lower limbs (AS, US and CG) for each flooring type (HOV, carpet, HTV and Mixed) each variable presented in means and standard deviations.
acceleration of the whole body center-of-mass to analyze the stroke gait over different flooring. These variables could indicate further increase risk of slipping, for example, higher heel contact velocity can increase horizontal ground reaction force in relation to vertical ground reaction force and as a result, friction demand could increase. Furthermore, slower transitory acceleration of the whole body COM among the stroke can also increase friction demand at the foot/floor interface and increase risk of slipping.
Conclusion
This is the first study to report the relationship between hemibodies in dynamic friction variables of gait in persons after stroke during
the walking on different flooring. The flooring effect was found on RCOF during the toe off for the AS and US. Therefore, the better understanding of the biomechanical differences between people with stroke and their healthy peers presented in the present paper revealed to be an important step to identify potential risk factors of slip injuries. In case of eliciting gait adjustments (during slip avoidance), stroke individuals’ gait adaptation may encumber optimal gait adjustment strategy.
Acknowledgements
We acknowledge financial support from CAPES (BEX 11241/13-6) and CNPq.
Conflict of interest
The authors report no conflicts of interest. The authors alone are responsible for the content and writing of the paper.
References
1. Burnfield JM, Powers CM (2003) Influence of age and gender of utilized coefficient of friction during walking at different speeds. In: Marpet MI, Sapienza MA, editors. Metrology of pedestrian locomotion and slip resistance, ASTM STP 1424. West Conshohocken: ASTM International 3–16.
2. Buczek FL, Cavanagh PR, Kulakowski BT, Pradhan P (1990) Slip resistance needs of the mobility disabled during level grade walking. In Gray BE, editor. Slips, Stumbles and Falls: Pedestrian Footwear and Surfaces. Philadelphia, PA: ASTM 39-54.
3. Burnfield JM, Tsai YJ, Powers CM (2003) Comparison of utilized coefficient of friction requirements in older persons with and without a disability to younger persons during different walking tasks. In Proceedings of the 8th Annual meeting of the Gait and Clinical Movement Analysis Society 99-100.
4. Durá JV, Alcántara E, Zamora T, Balaguer E, Rosa D, et al. (2005) Identification of floor friction safety level for public buildings considering mobility disabled people needs. Safety Sci 43:407-423.
5. Lockhart T, Kim S, Kapur R, Jarrott S (2009) Evaluation of gait characteristics and ground reaction forces in cognitively declined older adults with an emphasis on slip-induced falls. Assist Technol 21: 188-195.
6. Haynes CA, Lockhart TE (2012) Evaluation of gait and slip parameters for adults with intellectual disability. J Biomech 45: 2337-2341.
7. Stephens JM, Goldie PA (1999) Walking speed on parquetry and carpet after stroke: effect of surface and retest reliability. Clin Rehabil 13: 171-181. 8. Hanson JP, Redfern MS, Mazumdar M (1999) Predicting slips and falls
considering required and available friction. Ergonomics 42: 1619-1633. 9. Redfern MS, Cham R, Gielo-Perczak K, Grönqvist R, Hirvonen M, et al. (2001)
Biomechanics of slips. Ergonomics 44: 1138-1166.
10. Chang WR, Chang CC, Matz S (2012) Comparison of different methods to extract the required coefficient of friction for level walking. Ergonomics 55: 308-315.
11. Seo JS, Kim S (2013) Asymmetrical slip propensity: required coefficient of friction. J Neuroeng Rehabil 10: 84.
12. Seo J, Kim S (2013) Prevention of Potential Falls of Elderly Healthy Women: Gait Asymmetry. Educ Gerontol 0: 1–15.
13. Sadeghi H, Allard P, Prince F, Labelle H (2000) Symmetry and limb dominance in able-bodied gait: a review. Gait Posture 12: 34-45.
14. Holder-Powell HM, Rutherford OM (2000) Unilateral lower-limb musculoskeletal injury: its long-term effect on balance. Arch Phys Med Rehabil 81: 265-268. 15. Skelton DA, Kennedy J, Rutherford OM (2002) Explosive power and asymmetry
in leg muscle function in frequent fallers and non-fallers aged over 65. Age Ageing 31: 119-125.
16. Titianova EB, Tarkka IM (1995) Asymmetry in walking performance and postural sway in patients with chronic unilateral cerebral infarction. J Rehabil Res Dev 32: 236-244.
17. Morita S, Yamamoto H, Furuya K (1995) Gait analysis of hemiplegic patients by measurement of ground reaction force. Scand J Rehabil Med 27: 37-42. 18. Mizrahi J, Susak Z, Heller L, Najenson T (1982) Variation of time-distance
parameters of the stride as related to clinical gait improvement in hemiplegics. Scand J Rehabil Med 14: 133-140.
19. Carmo AA, Kleiner AF, Costa PH, Barros RM (2012) Three-dimensional kinematic analysis of upper and lower limb motion during gait of post-stroke patients. Braz J Med Biol Res 45: 537-545.
20. Chen C, Patten C, Kothari DH (2005) Gait differences between individuals with post-stroke hemiparesis and non-disabled controls at matched speeds. Gait Posture 22: 51-56.
21. Redfern MS, Dipasquale JD (1998). Biomechanics of descending ramps. Gait Posture 6: 119- 125.
22. Grönqvist R, Roine J, Järvinen E, Korhonen E (1989) An apparatus and a method for determining the slip resistance of shoes and floors by simulation of human foot motions. Ergonomics 32: 979-995.
23. Kim IJ, Hsiao H, Simeonov P (2013) Functional levels of floor surface roughness for the prevention of slips and falls: clean-and-dry and soapsuds-covered wet surfaces. Appl Ergon 44: 58-64.
24. Kim IJ, Nagata H (2008) Research on slip resistance measurements--a new challenge. Ind Health 46: 66-76.
25. Lockhart TE, Woldstad JC, Smith JL (2003) Effects of age-related gait changes on the biomechanics of slips and falls. Ergonomics 46: 1136-1160.
26. Lin SI, Hsu LJ, Wang HC (2012) Effects of ankle proprioceptive interference on locomotion after stroke. Arch Phys Med Rehabil 93: 1027-1033.
Citation: Kleiner AFR, Galli M, Rigoldi C, Carmo AA, Barros RM L (2014) Effects of Flooring and Hemi body on Ground Reaction Forces and Coefficient of Friction in Stroke Gait. Int J Neurorehabilitation 1: 122. doi: 10.4172/2376-0281.1000122
Submit your next manuscript and get advantages of OMICS Group submissions
Unique features:
User friendly/feasible website-translation of your paper to 50 world’s leading languages Audio Version of published paper
Digital articles to share and explore
Special features:
350 Open Access Journals 35,000 editorial team 21 days rapid review process
Quality and quick editorial, review and publication processing
Indexing at PubMed (partial), Scopus, EBSCO, Index Copernicus and Google Scholar etc Sharing Option: Social Networking Enabled
Authors, Reviewers and Editors rewarded with online Scientific Credits Better discount for your subsequent articles