Maria Lucinda Fonseca
Jorge Malheiros
Alina Esteves
Maria José Caldeira
IMMIGRANTS IN LISBON:
Routes of integration
UNIVERSIDADE DE LISBOA
CENTRO DE ESTUDOS GEOGRÁFICOS
ESTUDOS PARA O PLANEAMENTO REGIONAL E URBANO Nº 56 2002
INTRODUCTION
The origins of this research lie in a report on the integration policies aimed at the immigrant population of the Lisbon Metropolitan Area, written within the scope of an international research project co-ordinated by Harlan Koff and hosted by the Ethnobarometer Program1: Migrant Integration in Selected European Cities: a Comparative Evaluation of City-based Integration Measures2 (Koff, 2002).
The work now undertaken further investigates the issues analysed in that report and is part of the Project “Reinventing Portuguese Metropolises: migrants and urban governance” of the Centro de Estudos Geográficos of the University of Lisbon, funded by the Foundation for Science and Technology (FCT) and co-financed by the European Regional Development Fund (POCTI 38599/GEO/2001).
It was not until recently that Portugal became a destination area for international migrations and, thus, the percentage of immigrants and ethnic minorities in the resident population of the Lisbon Metropolitan Area is lower than is the case in other capital regions of Central and Northern Europe. However, over the past 25 years, just like in other Southern European metropolises, there has been a significant growth in the number of foreign citizens, which has taken place alongside the ethnic and cultural diversification of those living in the Lisbon region. At the same time, the Lisbon Metropolitan Area has also undergone a process of social and spatial restructuring, with the reinforcement of the spatial segregation mechanisms based on ethnicity. Moreover, the development of ethnic enterpreneurship and the cultural and social practises specific to certain immigrant groups has led to the intensification of the original forms of appropriation of Lisbon’s urban space, the Martim Moniz area providing a paradigmatic example.
Several authors have pointed out the importance of migrations in the process of urban expansion and change. Paul White (1999, pp.155-156) has stressed this fact, maintaining that the major cities are the result of migrations
1
Ethnobarometer is an international research network on interethnic relations and migration flows in Europe (see: www.ethnobarometer.org/index.htm).
2
The research project looks at integration processes in Brussels, Lisbon, Manchester, Mannheim, Murcia, Rotterdam, Stockholm, Toulouse and Turin.
insofar as their expansion is due to the inflow of immigrants rather than to their natural demographic growth. On the other hand, the integration strategies adopted by the immigrants and the ethnic minorities in the societies and territories that host them, albeit conditioned by the political and institutional system and by the economic and social features of the destination territories, also play a pro-active role in the transformation of the urban economies, in the segregation of the residential areas and in the social, cultural and symbolic differentiation of the places of destination.
By focusing on integration policies, this paper seeks to analyse the integration processes of the immigrated communities in the Lisbon Metropolitan Area and to emphasize local and nation-wide policy-making. The paper is divided into four main sections. The first one provides an overview of both the urban structure and the demographic, economic and social composition of the population of the Lisbon Metropolitan Area. The second section addresses the principles, actions and measures that have characterised national and local policies with regard to immigrants and ethnic minorities since the introduction of the democratic regime in 1974. Naturally, more attention is devoted to the present situation and to the developments of the past 10 years – the period in which a more or less structured set of policies finally began to be designed. The third section describes the present situation of the foreign population. Specifically, it addresses the integration of immigrants in the local employment and housing markets, their political participation and their integration in the social fabric of the city. Whenever possible, a diachronic analysis of the 1990’s (taking 1990/91, 1995 and 2000/2001 as key years) is provided. However, in the case of some of the variables, the available information is not thorough and systematic, which has limited this kind of analysis. Finally, section four provides a summary of the most relevant features of the immigrant population and a brief preliminary assessment of the policies that have been adopted at the local and national levels.
It is worth pointing out that this part of the research faced considerable statistical difficulties. Due to it having been necessary to draw on various institutional sources (e.g., the National Statistical Institute - INE -, the Foreigners and Borders Office and the Department of Statistics of the Ministry of Labour and Solidarity), it was often difficult or impossible to compare some of
the variables across time and space. On the one hand, the information that could be gathered and that was provided by these institutions corresponds to various different years of the 1990’s, as well as to data from the 2001 Population Census. On the other hand, the various information providers do not use the same geographical system of disaggregation. In some instances, the information is only available at the macro-regional level (NUT II - Lisbon and Tejo Valley), whereas in other cases the units used are the districts (an old statistical division used up until the end of the 1990’s by the Foreigners and Borders Office)3. Only in a few cases (foreign population, some of the housing data), mostly corresponding to the 1991 and 2001 Census data, has it been possible to obtain information for the municipalities that integrate the official Lisbon Metropolitan Area (LMA). One other problem with the statistical information collected by the Foreigners and Borders Office (SEF) and rendered publicly available by the National Statistical Institute (INE) is the fact that it is impossible to cross variables because the database does not include such comparisons and does not take into account relevant demographic, social and economic factors such as age, level of education, professional skills or the rate of unemployment. The data includes foreign citizens (whether or not they are immigrants), excluding both the children of foreign citizens born within the national territory and the immigrants who have obtained the Portuguese nationality.
Moreover, there are difficulties involved in rendering compatible and comparing the data from the Population Census and from the Foreigners and Borders Office because the methods and criteria used by these two sources in collecting the information are different. The following situations exemplify these differences: 1) the Foreigners and Borders Office collects the data at the time of the foreigners’ arrival, whereas the Census takes place throughout the country on a specific date; 2) the Census data may include immigrants in an illegal situation and exclude those immigrants in a legal situation who did not answer the Census questionnaire; conversely, the data collected by the SEF only includes legal immigrants.
3
As we shall see in chapter 1, the Lisbon and Setúbal districts correspond, to a large extent, to the present Lisbon Metropolitan Area.
Apart from the statistical information provided by the sources mentioned above, data from academic research, reports and evaluation papers of social and economic development programmes prepared by the EU, national government, municipalities and non-profit organisations were also used in this research.
In the latter stage of the research within the ambit of this project, data collected directly, both qualitative and quantitative, shall be used. The qualitative component shall involve the use of focus groups, migration life-stories and in-depth interviews with relevant informers in state institutions (at both the national and the local levels), political parties, trade unions, charitable organisations, immigrant associations, NGOs and pressure groups concerned with migrant issues. The quantitative component shall include structured questionnaires.
The authors would like to thank Alexandre Abreu for his help in the revision of the English version of the reseent study.
I. THE LISBON METROPOLITAN AREA AND ITS FEATURES:
POPULATION, ECONOMY AND URBAN RESTRUCTURING
1. Population and urban growth
Besides being the seat of the national political power, the city of Lisbon is also the centre of a metropolitan area that is the largest demographic concentration and the main focus of economic activity in Portugal. The Lisbon Metropolitan Area (LMA) is made up of 19 municipalities in both banks of the Tejo river4. There are 10 municipalities in the North bank and 9 in the South bank (Fig. 1). By 2001, there were 2,682,687 inhabitants (25.9% of Portugal’s resident population) living in 4,643.26 Km2 (5.2% of the national territory), which is equivalent to an average population density of 577.75 inhabitants per Km2.
Between 1991 and 2001, the resident population of the Lisbon Metropolitan Area grew at a slightly higher rate than that of the country as a whole (5.6 % and 5.0%, respectively) - a fact that shall be analysed further on and which is partly a consequence of the growing immigration of foreign citizens.
The distribution of the population in the metropolitan territory is quite uneven: 21.1% live in the Lisbon municipality, 52.3% in the suburban municipalities in the North Bank of the Tejo and 26.6% in the Setúbal Peninsula (South Bank of the Tejo).
4
The Lisbon Metropolitan Area (LMA) was created in 1991, in the form of a special type of two-tier municipal association – the Metropolitan Assembly and the Metropolitan Board, both made up of indirectly elected councillors. However, the actual power of these two organs is very limited. The most important administrative unit is the municipality and the main policy decisions regarding the LMA – in the areas of transport, education, health, housing, environmental protection, energy, culture, etc. – are made by the central government.
Fig. 1- The Lisbon Metropolitan Area
0 40 km
AZAMBUJA
VILA FRANCA DE XIRA
LOURES MAFRA AMADORA LISBON ALCOCHETE SINTRA CASCAIS OEIRAS ALMADA SEIXAL BARREIRO SESIMBRA SETÚBAL PALMELA MONTIJO MOITA (MONTIJO) Tagus River
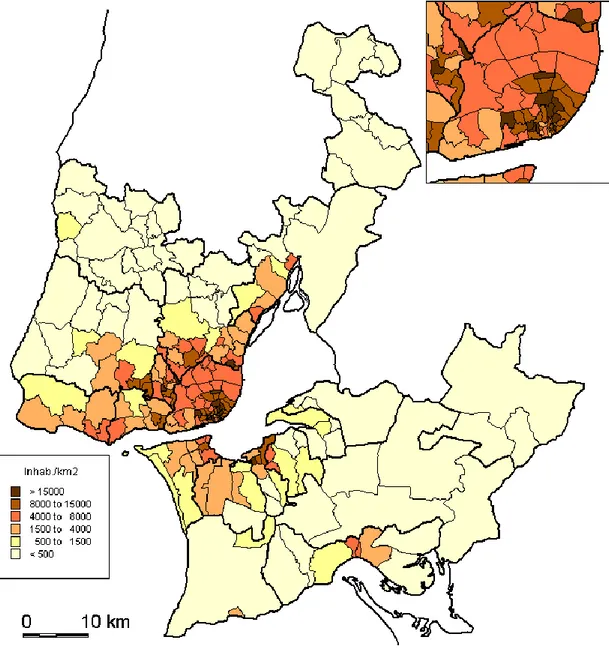
Lisbon's suburban growth took place alongside the development of the transport infrastructure, which has reflected upon the difference in the shape of its urbanised areas: in the north bank, these areas have a “bird paw”-like shape, in which the fingers correspond to the railway lines and to the main road axes (Cascais, Sintra, Loures and Vila Franca de Xira); in the Setúbal Peninsula, the reliance upon fluvial transport to get to Lisbon, before the 25th April bridge was built in 1966, led to a ring-like urbanisation process, parallel to the river (Fonseca, 1990; Fonseca, 1999). However, from the mid 1980’s onwards, along with the consolidation and expansion of the river-side ring (Almada-Alcochete), there has clearly been a significant growth along the Setúbal-Montijo/Alcochete axis. This central corridor runs parallel to the old EN 252 road and was reinforced after the Vasco da Gama bridge, linking Alcochete to Lisbon, was built in 1998. The cartography of the population density by parishes (freguesias) in 2001 (Fig. 2) illustrates the urban shape of the metropolitan area that we have just presented. To the North of the Tejo, the most densely urbanized areas consist of a ring of parishes in the municipalities around the city of Lisbon and a
number of extensions along the railway lines and the most important road axes: Costa do Sol, Amadora-Queluz-Sintra, Odivelas-Loures and Sacavém-Vila Franca de Xira. In the South bank, Tejo’s riverside ring stands out, as do the parishes that correspond to the urban perimeter of Setúbal and the Castelo parish in Sesimbra.
As we can see in Fig. 2, despite the recent demographic growth in many of the parishes, the demographic density in most of them is still much lower than in the Metropolitan Area as a whole. There are still, particularly in the municipalities of Palmela, Sesimbra, Alcochete, Montijo, Mafra, Azambuja and Vila Franca de Xira, vast rural areas with a much lower number of inhabitants per km2 than is the case in the whole of the Metropolitan Area. In 2001, the densities in some of the parishes were in fact lower than the national average: Canha, Santo Isidro de Pegões and Pegões in Montijo; Marateca and Poceirão in Palmela; Gaio-Rosário in Moita; Cachoeiras and Vila Franca in Vila Franca de Xira; Sobral da Abelheira, Santo Estêvão das Galés, Igreja Nova and Enxara do Bispo in Mafra; as well as all the parishes of the Azambuja municipality except for Aveiras de Cima and Vale do Paraíso. However, over the last few years, the improvement in the transportation infrastructure of the region has been visible in the increasing urban pressure upon these territories, which has led to the creation of new residential areas, both permanent and secondary.
This chaotic process of urbanization – characterized by both high and low densities – has reflected upon the promiscuity between urban and rural landscapes and in an urban fabric lacking in connectivity, which is due to the increasing use of private means of transportation. The increasing degree of urbanization of the metropolitan territory, both through the expansion of the consolidated urban areas with high densities and the diffusion of low density areas, scattered throughout the metropolitan territory and mainly destined for seasonal or secondary use, has had a highly negative environmental impact. This impact has been due to the reliance upon the individual automobile transportation, with all its negative effects (energy consumption, traffic jams, parking problems, time spent commuting, pollution, etc.), but also to the fact that this process has destroyed some very fragile ecologic equilibria, by causing the impermeabilization of the soils, the degradation of underground sources of water, the pollution of water streams, conflicts with farming uses, etc.
Fig. 2. Population Density in the Lisbon Metropolitan Area, 2001
The increase in mobility, made possible by the spectacular rise in the number of private cars and by the huge investments made since the mid-1980’s in transportation infrastructures, namely in road and rail structures5, allowed for
5 Among the transportation infrastructures built in the Lisbon Metropolitan Area since the 1980’s,
the following are especially worthy of mention: the expansion of the subway network, the construction of a new bridge destined for car traffic over the river Tejo (the Vasco da Gama bridge), the railroad crossing in the 25th April bridge, the construction of two regional by-passes
a better integration of the metropolitan region by shortening the distances from the furthest municipalities to Lisbon, while on the other hand bringing about a process of territorial fragmentation, by defining new central areas and by marginalizing the areas with little accessibility and with the worst equipment and infrastructures (Salgueiro, 2001; Salgueiro et al., 1997).
The distribution of “conventional dwellings” according to the time in which they were built is a good indicator of the process of urban expansion that has taken place in the Lisbon Metropolitan Area (Table 1, Fig. 3). The first conclusion that can be drawn from Table 1 is that in Lisbon, as in fact in Portugal as a whole, dwellings are in general quite recent: 60.5% of the dwellings were built after 1970 and 18.3% after 1990. For Portugal as a whole, due to the enormous increase in the number of seasonal or secondary dwellings - in the coastal areas and in the municipalities located in the Northern interior and in the Centre which were more deeply affected by emigration and by the migration to Lisbon in the 1960’s and early 1970’s -, the equivalent figures are in fact even higher: 63.2% e 21.7%, respectively.
Table 1 – Distribution of family dwellings, according to the period in which they were built (2001)
Geographic units Peroid of construction (%) Before 1919 From 1919 to 1945 From 1946 to 1970 From 1971 to 1990 From 1991 to 2001 Total Portugal 5,94 8,46 22,89 39,86 22,85 100,00
Lisbon Metropolitan Area 3,61 6,51 28,77 40,94 20,18 100,00
North bank 4,28 7,51 30,05 39,23 18,93 100,00
South bank 1,85 3,90 25,45 45,38 23,42 100,00
Source: INE – 2001 Population Census; calculations by the authors.
As might be expected, there is a higher percentage of old buildings in the North and South bank municipalities of the Lisbon Metropolitan Area than in the Setúbal Peninsula - not only because the city of Lisbon is the municipality which has the highest percentage of family dwellings built before 1919 (10.3 %) and between 1919 and the end of World War II (17.3%), but also because the river
(CRIL and CREL), the North-South axis, the A12 Highway in the Setúbal Peninsula and some major upgrade and repair works in the rail and car axes connecting Lisbon and the suburbs.
Tejo was, until the construction of the first bridge in 1966, a major barrier to the urban expansion in the Setúbal Peninsula. Therefore, in the North Bank, even without taking into account the city of Lisbon, the average age of the housing structures is slightly higher than in the South Bank. In the latter, by 2001, some 20.8% of the family dwellings were built after 1990 and 67.4% in the last two decades, whereas in the North Bank the equivalent figures were 16.5% and 60.6%, respectively.
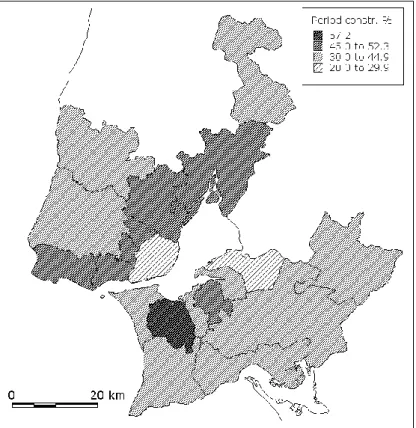
In a more detailed analysis by municipalities (Fig. 3 and 4), it is possible to see that in Sesimbra, Alcochete, Sintra, Mafra and Palmela, the residential units built in the last decade amount to around one third of the total. In the city of Lisbon and in the municipalities of the first suburban ring that went through the earlier suburbanization process, the percentage of more recent residential buildings is much lower than in the Metropolitan Area as a whole. In the 70’s and 80’s, the development of new residential areas took place, in the South Bank, mainly towards the municipalities of Seixal and, in the North Bank, along the Estoril Railway Line/Cascais highway, Odivelas-Loures and Sacavém-Vila Franca de Xira.
In the municipalities located further away from Lisbon and with the worst accessibility, the percentage of dwellings built in the 70’s and 80’s was lower than the average for the Lisbon Metropolitan Area (Table 1, Fig. 4).
Fig. 3. Distribution of the family dwellings built between 1991 and 2001
In a context of slow demographic growth, the increase in the income of the middle class families, largely due to the greater participation of women in the labour market, has allowed for some investment in secondary homes. As a consequence, a substantial part of the buildings that have recently been built near the seaside and in the areas with a deep rural landscape consist of secondary houses.
By 2001, as Table 2 clearly illustrates, 12.6% of the 1,291,652 family dwellings in the LMA were destined for seasonal or secondary occupation. As we have already mentioned, the equivalent figure for the country as a whole is considerably higher, reaching 18.4% out of a total 5,019,425 classic dwellings. It is in the North Bank municipalities of the Lisbon region that one finds 61.6% of the secondary dwellings located in the Metropolitan Area. However, their relative weight is higher in the Setúbal Peninsula, since they amount to 17.5% of all the dwellings, as opposed to a mere 10.8% in the North Bank municipalities.
Table 2 – Family dwellings according to the occupation regime, 2001
Geographic units Occupation regime (%) Permanent residence Seasonal or secondary housing Empty Total n. % n. % n. % n. % Portugal 3551229 70.75 924419 18.42 543777 10.83 5019425 100.00
Lisbon Metrop. Area 978027 75.72 163314 12.64 150311 11.64 1291652 100.00
North bank 721181 77.30 100634 10.79 111108 11.91 932923 100.00
South bank 256846 71.60 62680 17.47 39203 10.93 358729 100.00
Source: INE – 2001 Population Census; calculations by the authors.
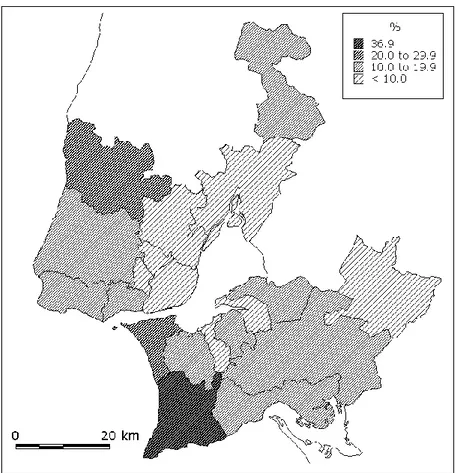
In a more disaggregated spatial analysis, one finds that the municipalities with the highest percentage of secondary dwellings are Sesimbra, Mafra and Almada. All of these municipalities have vast coastal extensions, attractive beaches and large areas of relatively low population density (Fig. 5).
Cascais, Seixal, Palmela and Azambuja, albeit for different reasons, also have a relatively high percentage of seasonal dwellings (between 15 and 20%), as compared to the urban municipalities of the Lisbon area. In the case of Cascais, the number of weekend dwellings has to do with a long-standing
tradition of touristic and leisure activities in the Sun Coast (Costa do Sol). In Seixal, the increase in the number of secondary homes is closely linked with the phenomenon of illegal housing, which has allowed for considerably lower prices than those practised in the formal housing market in the areas near Costa da Caparica and Sesimbra. In Palmela, the increase in the number of secondary houses took place somewhat later than in Seixal and was due to the scenic beauty of the area, its tradition of there being some ancient leisure estates and the richness of its built environment. Finally, in the case of Azambuja, the increase in secondary housing that took place during the past decade has largely been due to the fact that this area combines many of the attractive features of the rural areas and a good accessibility to Lisbon, while the prices for land have remained substantially lower than in the coastal areas.
Fig. 5 – Secondary and seasonal dwellings
The demographic trends of the 1990’s were akin to those of the 1980’s, persistently bringing about a demographic decline in the city (Lisbon) and in
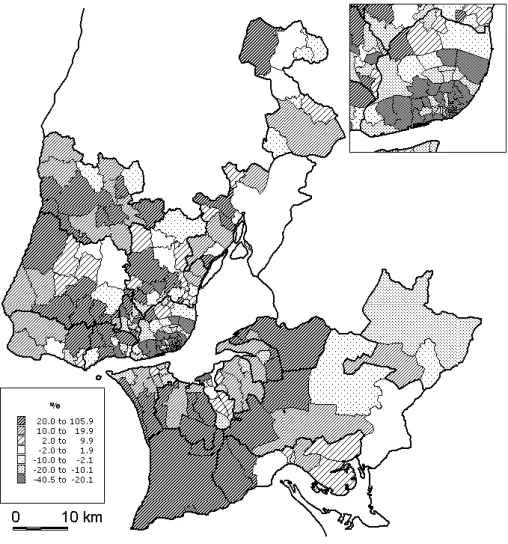
some of the parishes (freguesias) of the first suburban ring - namely in the municipalities of Amadora, Oeiras, Cascais, Loures, Odivelas, Almada and Barreiro -, as well as the expansion of urban areas increasingly further from the capital, following a territorial pattern structured along the main transportation axes (Fig. 6).
The Lisbon municipality underwent a significant demographic decline, losing 98,737 inhabitants between 1991 and 2001 (14.9%), while the other municipalities of the Metropolitan Area experienced a 12.9% growth. The decrease in the number of inhabitants of the city, which has mostly been due to the active young people moving to the suburbs, has been reinforced by the tertiarization of the central areas and by the exponential increase in the prices of land in the more central and noble areas.
In the last decade, only in four parishes of the city of Lisbon was there a population increase: Carnide, Lumiar and Charneca in the Northern periphery of Lisbon, and Encarnação in a historic neighbourhood (Bairro Alto) located on the edge of the city’s traditional centre6
(Fig. 6). The growth of the former three was due to intense processes of urbanization, promoted by both private and public capital, in certain vacant areas where once used to be old rural estates. The latter – Bairro Alto – is an altogether different case, showing early signs of a process of urban revitalization and gentrification. The desertification of the city centre, besides having a significant impact upon demographic ageing, concentration of service sector employment, increase in daily commuting, traffic jams, real estate speculation and the expansion of residential suburbia that are extremely dependent upon Lisbon in terms of services and employment, has also had some very important consequences in terms of the rise in crime and insecurity, particularly during the night, in the deserted areas of the centre (CML, 1992).
6
With 3,182 inhabitants in 2002, the Encarnação parish has undergone a population growth of 110 people in the last decade.
Fig. 6 – Lisbon Metropolitan Area: population growth (1991-2001)
The most striking feature of Figure 6 is the demographic decline of the areas that are either the most remote or which have bad accesses to Lisbon, weak economic dynamics, increasingly ageing populations or which maintain strong rural characteristics. Included in this category are the parishes of Canha, Afonsoeiro and Pegões (Montijo municipality), Poceirão (Palmela municipality), Vale Paraíso, Vila Nova da Rainha and Vila Nova de São Pedro (Azambuja municipality), Enxara do Bispo and Sobral da Abelheira (Mafra municipality) and Bucelas (Loures municipality).
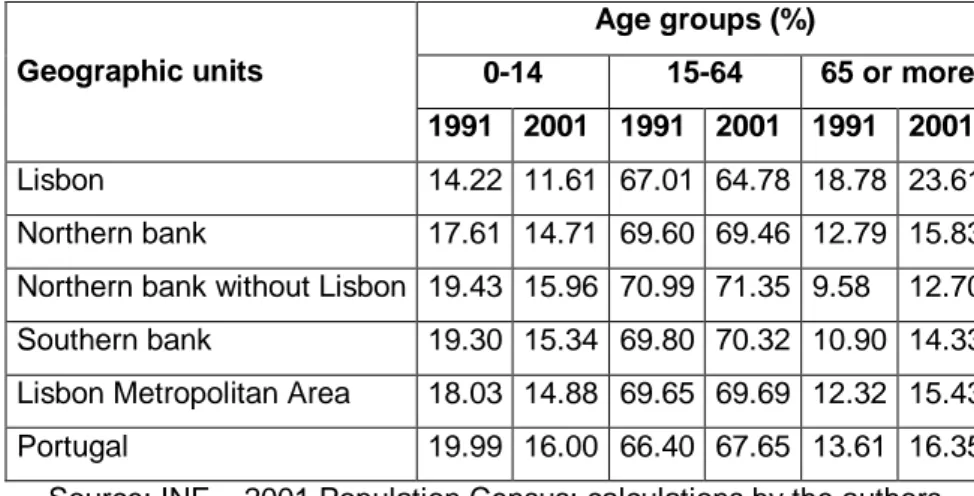
Alongside the changes in the demographic evolution and in the geographical distribution of the resident population of the Lisbon Metropolitan Area, there have been some profound changes in the age and family structures of those living in the region. The tendency towards demographic ageing has been reinforced, both at the base and at the top of the age pyramid. There has
been an increase in the number of people over 65 years of age (32.3%) and a decrease in the number of youngsters (–12.9%). As compared with the country as a whole, it is worthwhile stressing that the degree of ageing at the top of the age pyramid in the Lisbon Metropolitan Area is lower than the national average; however, the situation is quite the opposite at the base. The percentage of youngsters is lower than in the whole of the national territory (Table 3).
Table 3 – Age structure of the population living in the Lisbon Metropolitan Area and in Portugal, 1991 and 2001
Geographic units Age groups (%) 0-14 15-64 65 or more 1991 2001 1991 2001 1991 2001 Lisbon 14.22 11.61 67.01 64.78 18.78 23.61 Northern bank 17.61 14.71 69.60 69.46 12.79 15.83
Northern bank without Lisbon 19.43 15.96 70.99 71.35 9.58 12.70
Southern bank 19.30 15.34 69.80 70.32 10.90 14.33
Lisbon Metropolitan Area 18.03 14.88 69.65 69.69 12.32 15.43
Portugal 19.99 16.00 66.40 67.65 13.61 16.35
Source: INE – 2001 Population Census; calculations by the authors.
Within the Lisbon Metropolitan Area, this process of demographic ageing has been particularly active in the North Bank municipalities. That has especially been the case in the Lisbon municipality, where the elderly population accounts for 23.6% of all the residents, whereas the young people account for a mere 11.6%.
The city of Lisbon differs from the other municipalities of the metropolitan area in what regards the high proportion of elderly inhabitants (almost one quarter of the total population) and its low proportion of young people (11.6%), which indicate a higher degree of ageing than is the case in the whole of the national territory.
The evolution of the demographic structure of the various municipalities of the Lisbon Metropolitan Area is closely associated with their rates of demographic growth and, therefore, with the intra-metropolitan patterns of residential mobility. Thus, the municipalities that have undergone the largest
demographic increases, because of young couples looking for housing in the suburbs, are also those in which there is relative over-representation of the population inside the working age, particularly between 25 and 45 years of age. On the contrary, in the city of Lisbon and in the older urban nuclei of the suburban areas, there is a higher percentage of elderly inhabitants than in the whole of the Lisbon Metropolitan Area.
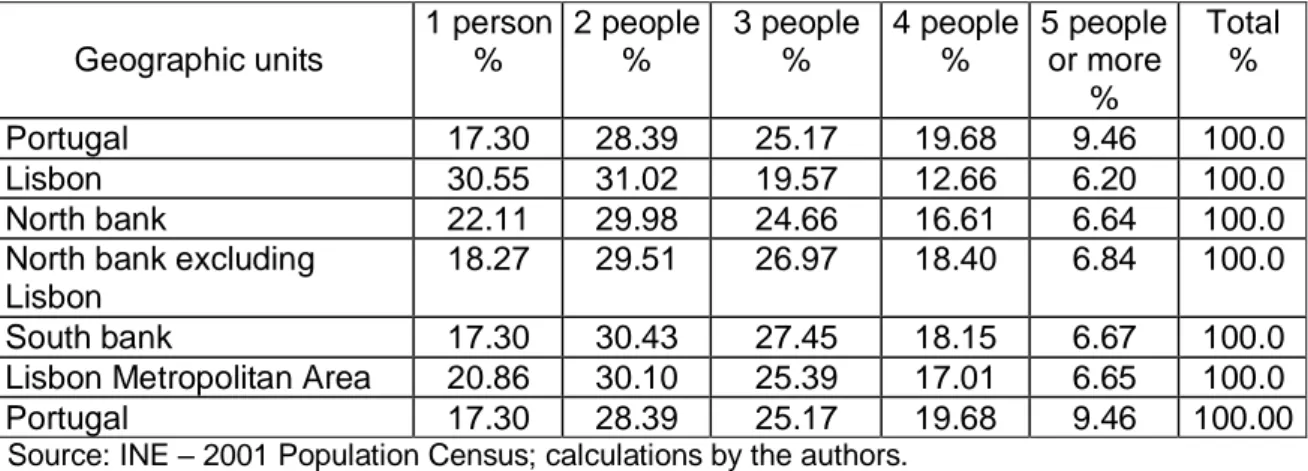
Not only has the demographic structure of the region changed, there has also been some major changes in the size, composition and social functions of the families. The increasing participation of women in the labour market, the decreasing birth rates, the increasing life expectancy and the growing tendency towards an increase in the number of divorces and de facto unions have had some important implications in terms of the social functions of the family, the division of domestic tasks and the relationships between different generations. Moreover, all these changes have been felt in the housing market as well, not only because they have tended to generate greater residential mobility but also because they have induced an increase in the demand for housing for small families, which quite often consist of just one person.
According to the conclusions reached in the 2001 Population Census, the average family size in the Lisbon Metropolitan Area is smaller than in the rest of the country (Table 4). Small families predominate (20.9% consist of just one person and 55.5% of one or two people), and those consisting of five or more members are rare (just 6.7%).
Table 4 – Distribution of the families living in Portugal and in the Lisbon Metropolitan Area according to the number of members, 2001
Geographic units 1 person % 2 people % 3 people % 4 people % 5 people or more % Total % Portugal 17.30 28.39 25.17 19.68 9.46 100.0 Lisbon 30.55 31.02 19.57 12.66 6.20 100.0 North bank 22.11 29.98 24.66 16.61 6.64 100.0 North bank excluding
Lisbon
18.27 29.51 26.97 18.40 6.84 100.0 South bank 17.30 30.43 27.45 18.15 6.67 100.0 Lisbon Metropolitan Area 20.86 30.10 25.39 17.01 6.65 100.0 Portugal 17.30 28.39 25.17 19.68 9.46 100.00
In the city of Lisbon, the proportion of families that consist of one single member is slightly higher (30.5%) than in the other municipalities of the Metropolitan Area. Three sets of factors concur to explain this: first, the high percentage of elderly people; second, the fact that the city is often chosen by economic migrants, who settle temporarily in pensions and rented rooms, as their first stop; and, finally, the fact that there are numerous university students that come from other regions in Portugal, who settle in Lisbon in order to live close to their college and to take advantage of all the leisure activities offered in the city.
2. Productive and labour market restructuring
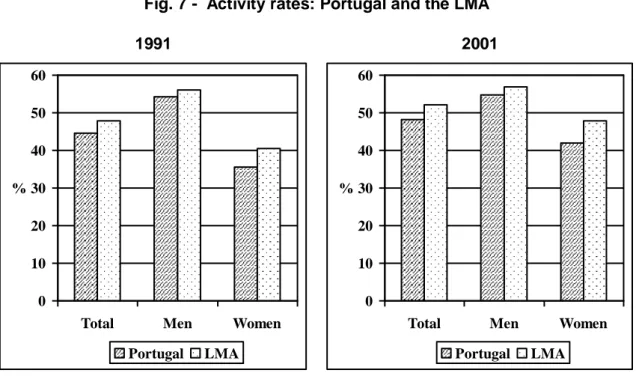
The Lisbon Metropolitan Area is the main national focus of economic activity. In 2001, it accounted for 28.1% of the active population in the Portuguese territory. The global, male and female activity rates were 52.2%, 56.9% and 46.7%, respectively - all of which were higher than the corresponding figures for Portugal, which were 48.2%, 54.8% and 42.0%. The major difference with regard to the country as a whole had to do with the female activity rate (a 4.7% difference), which shows that the feminization of employment is one aspect that clearly distinguishes the Metropolitan Area from the rest of the country.
Between 1991 and 2001, the activity rates of the Lisbon Metropolitan Area evolved in very much the same way as those of the rest of the country (Fig. 7). The total activity rate increased by 4.3%, mainly due to the growing participation of women in the labour market. Women account for an ever-increasing share of the active population: 44.1% in 1991, 47.7% in 2001.
Fig. 7 - Activity rates: Portugal and the LMA 1991 2001 0 10 20 30 40 50 60
Total Men Women
% Portugal LMA 0 10 20 30 40 50 60
Total Men Women
%
Portugal LMA
The employment rate (the ratio between the employed population and the total population over 15 years of age) has also increased, despite the differences in the age criteria used in the 1991 and 2001 census. In the 1991 Census, the notion of active population included all those over 12 years of age, but that lower limit went up to 15 years in the 2001 census. Both in 1991 and in 2001, the employment rates in the Lisbon Metropolitan Area were higher than the national average (Table 5).
In a gender-disaggregated analysis, one also finds that, at both of these times, the percentage of men old enough to work who did in fact perform some professional activity was higher than that for the women. However, that difference has slowly been on the decrease - the tendency is for male and female activity rates to grow increasingly closer (Table 5).
Table 5 - Activity and employment rates in Portugal and in the LMA, 1991 and 2001
1991 2001
Portugal LMA Portugal LMA
Total activity rate 44.6 47.9 48.2 52.2
Male activity rate 54.3 56.0 54.8 56.9
Female activity rate 35.5 40.5 42.0 47.8
Total employment rate 52.3 53.9 53.5 56.7
Male employment rate 66.1 65.5 62.6 64.5
Female employment rate 39.9 43.6 45.1 51.8
Source: INE – 1991 and 2001 Census; calculations by the authors.
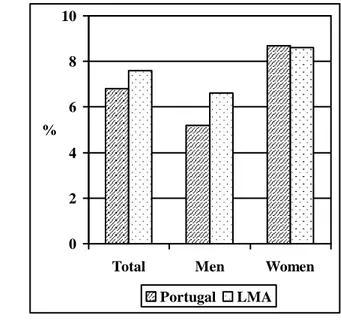
According to the 2001 census, the unemployment rate in the Lisbon Metropolitan Area was higher than the national average: 7.6, as compared to 6.8%. However, it is important to stress that the female unemployment rate in the LMA, although higher than the male unemployment rate, was very similar to that for the country as a whole (Fig. 8). This fact had certainly to do with the wider employment opportunities available for women in the Lisbon area, together with the greater predominance of the service sector in the Lisbon Region7.
Fig. 8 - Unemployment rate in the Lisbon Metropolitan Area and in Portugal, 2001
0 2 4 6 8 10
Total Men Women
%
Portugal LMA
7
In the Lisbon Metropolitan Area, women accounted in 2001 for 47.2% of the total active resident population and for 54.3% of the working population of the tertiary sector. In the
“education” and “health and social security” subsectors, the rate of feminization of the employed population reached, respectively, 76.4% e 77.8%.
By 2001, trade and services were the main sectors of economic activity, accounting for 74.7% of the working population living in the region, whereas in the national territory as a whole the tertiary sector accounted for just 59.9% of the resident population. Roughly a quarter of the labour force living in the LMA was employed in the secondary sector – 13.4% in manufature and 9.7% in construction. As for agriculture and fishing, their weight was in fact residual: a mere 1% and 0,2%, respectively, of the active population (Table 6).
Table 6 – Sectoral Structure of the Active Population, 1991 and 2001 %
Geographic units Total Primary Secondary
Tertiary Total Social Services Business Services 1991 Lisbon 100,00 0,39 20,07 79,54 27,21 52,32 Northern LMA 100,00 1,17 26,56 72,28 23,83 48,44 Setúbal Peninsula 100,00 4,00 34,10 61,90 22,30 39,61 LMA 100,00 1,84 28,35 69,81 23,47 46,34 Portugal 100,00 10,79 37,87 51,34 17,44 33,90 LMA as a % of the country as a whole 27,20 4,64 20,36 36,98 36,59 37,18 2001 Lisbon 100,00 0,48 16,22 83,31 35,64 47,66 Northern LMA 100,00 0,82 22,57 76,61 30,73 45,88 Setúbal Peninsula 100,00 2,25 28,62 69,13 29,43 39,70 LMA 100,00 1,19 24,13 74,69 30,40 44,29 Portugal 100,00 4,98 35,10 59,92 25,54 34,38 LMA as a % of the country as a whole 27,82 6,63 19,12 34,68 33,12 35,84
Source: INE - 1991 and 2001 Population Census; calculations by the authors.
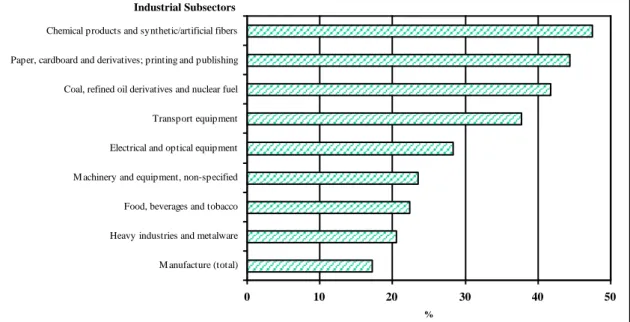
Despite the fact that the pattern of productive specialization of the Lisbon Metropolitan Area is increasingly based in the service sector, the manufacturing industries of this region still account for a significant part of the Portuguese
manufacturing industry. By 2001, 17.2% of the workers of this sector were concentrated in the region. Among the most relevant industries of the Lisbon region are the chemistry filière and the paper and pulp, graphic arts, printing and publishing, food processing, metalware, heavy machinery and transport equipment industries (Fig. 9).
Fig. 9 - Percentage of the active population working in manufacture who live in the LMA, out of the nation's total, 2001
0 10 20 30 40 50
M anufacture (total) Heavy industries and metalware Food, beverages and tobacco M achinery and equipment, non-specified Electrical and optical equipment Transport equipment Coal, refined oil derivatives and nuclear fuel Paper, cardboard and derivatives; printing and publishing Chemical products and synthetic/artificial fibers
%
Industrial Subsectors
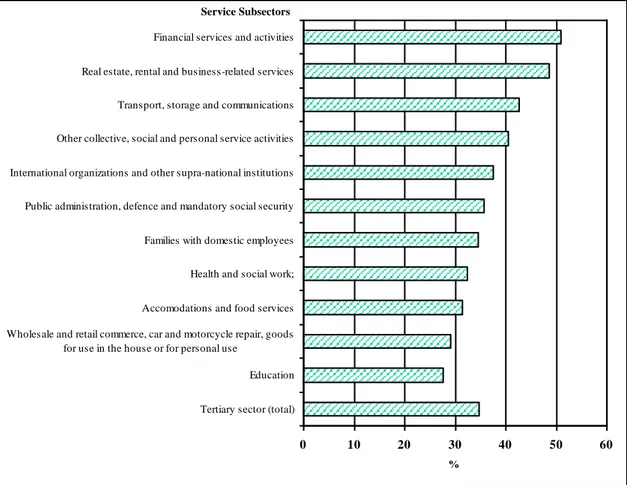
In the tertiary sector, business services stand out, accounting for 57.2% of the active population employed in this sector. With regard to the rest of the country, it is worth pointing out that some activities are extremely concentrated in the Lisbon Metropolitan Area. That is particularly the case with financial services, real estate, business-support services and transport and communications and, to a lesser extent, with the public administration, defence and social security sub-sectors (Fig. 10). From 1991 to 2001, there was, however, a decrease in the level of concentration of the trade and services activities in the Lisbon region, which was due to the improvements made in the regional coverage of the social services and to the rise in the level of consumption of the Portuguese families.
Fig. 10 - Percentage of the active population working in the tertiary sector who live in the LMA, out of the nation's total, 2001
0 10 20 30 40 50 60
Tertiary sector (total) Education Wholesale and retail commerce, car and motorcycle repair, goods
for use in the house or for personal use
Accomodations and food services Health and social work; Families with domestic employees Public administration, defence and mandatory social security International organizations and other supra-national institutions Other collective, social and personal service activities Transport, storage and communications Real estate, rental and business-related services Financial services and activities
%
Service Subsectors
In what regards the workers’ professional status in 2001, there was a clear predominance of wage earners - approximately 85%, as compared to 81.6% for the country as a whole. Various factors explain this difference: 1) the significant presence of major firms in the Lisbon Metropolitan Area; 2) the high relative weight of the civil servants that work for the central administration in the city of Lisbon; 3) the still relatively high percentage of farmers and small entrepreneurs, with or without wage-earning employees, in the Northern and Central parts of the country.
Between 1991 and 2001, alongside the growth in the service activities and the process of industrial restructuring that took place, there were some very important changes in the structure of the business fabric (the relative weight of the SME’s having increased significantly) and in the location patterns of economic activity. The percentage of self-employed workers decreased, as did
that of the unpaid family workers. On the contrary, the proportion of employers and wage-earning employees has increased (Table 7). On the other hand, employment has become increasingly precarious, which is clearly visible in the higher number of workers that hold temporary contracts and other informal labour contracts - particularly in the personal/domestic services and construction sectors, in which immigrants and ethnic minorities are largely over-represented (Baganha, Ferrão and Malheiros, 1999; Malheiros, 1998).
Table 7 – Employed active population according to professional status, 1991 and 2001 (%) Geographic unit Employers Self-employed workers Unpaid family workers Wage-earning workers Members of Cooperatives Other Total 2001 Northern LMA 9,35 4,22 0,29 84,90 0,09 1,15 100,00 Setúbal Peninsula 9,45 4,85 0,35 84,10 0,09 1,16 100,00 LMA 9,38 4,38 0,30 84,70 0,09 1,15 100,00 Portugal 10,29 6,32 0,77 81,57 0,07 0,97 100,00 1991 Northern LMA 5,94 8,75 0,53 83,28 0,14 1,36 100,00 Setúbal Peninsula 5,05 10,03 0,64 82,37 0,23 1,68 100,00 LMA 5,73 9,05 0,55 83,06 0,16 1,43 100,00 Portugal 6,42 13,52 1,96 76,74 0,16 1,20 100,00
Source: INE – 1991 and 2001 Population Census; calculations by the authors.
With regard to the territorial pattern of economic activity – not unlike what took place earlier on in other European and American metropolises – it is worth pointing out that several residential complexes and/or services and commerce areas have been created where there once were some of the old harbours and industrial areas8 of the city and of the other municipalities of its adjacent suburban ring. New industrial nuclei were created, especially in the Sintra, Mafra and Palmela municipalities, taking advantage of the abundance of available land and labour, as well as of the improved accesses to this area. Hence, outside the capital itself, three particularly important industrial areas are worthy of mention: the Setúbal Peninsula, the Amadora - Sintra axis, including
8 The urban intervention carried out in the EXPO’98 area – in the Eastern part of the city – is a
some areas in the municipalities of Oeiras and Cascais, and the Tagus Valley, including the eastern part of the Loures municipality, the Vila Franca de Xira municipality, the Carregado area and the Azambuja municipality (Fonseca, 1998, p. 160). These new industrial areas originated in different ways: in some cases – particularly within the city itself –, following the relocation of previously existing businesses; in other, resulting from new investments with the aim of creating new industrial districts in upgraded urban surroundings. In the industrial districts of this newer type, one often finds not only the production units themselves, but also storehouses, offices and support services, aimed both at the companies and at their employees, clients and suppliers (Barata Salgueiro, 2001, p. 146).
The territorial pattern of economic activity in the Lisbon Metropolitan Area has been closely linked with the development of the transportation network. Thus, the level of concentration in the Lisbon municipality is still very high, both in terms of employment and of gross value added.
As far as the service sector is concerned, despite a noticeable increase in the active population working in the trade and services sector in all the municipalities that belong to Lisbon Metropolitan Area, more than half of the total number of jobs in this sector were still concentrated in the Lisbon municipality – according to estimates published in the Lisbon Strategic Plan (Plano Estratégico de Lisboa) in the beginning of the 1990's. Therefore, the tertiarization of the active population of the other municipalities of the metropolitan territory has often been due, above all else, to the suburban expansion of the city of Lisbon, further and further away from the centre. This would not have been possible had it not been for the improvements in the accessibility network and for the stimulating effect of there being a considerable supply of housing, at much lower prices than is the case in the capital, in certain suburban areas that, while being close to the city, offer both scenic beauty and attractive social and cultural environments.
Despite the fact that employment in the LMA is highly concentrated in the city of Lisbon, there was, in the 1990’s, a steady increase in trade, accomodation and food service activities, as well as in collective and personal services, in the city’s immediate periphery, particularly in the North bank of the Tejo. This fact, which has been closely associated with the decline in industrial
employment, is noticeable in Lisbon’s decreasing weight in the total employment generated in the Metropolitan Area (53.1% in 1991, 46.9% in 1997). In the same period, the relative weight of the municipalities of the Northern part of Greater Lisbon (excluding Lisbon itself) increased from 30.9% to 36.1%. In the Setúbal Peninsula, there was also a huge expansion of employment in the service sector. Nevertheless, the Public Administration, the cultural services and the business and producer services remain highly concentrated in the city of Lisbon, even though their centre of gravity has moved up North and into the Marquês de Pombal-Avenidas Novas area. At the same time, as stated in Teresa Barata Salgueiro (2001, p. 155), a number of new office districts have appeared, along a discontinuous outer ring that stretches from the Amoreiras to the area of the Colombo shopping centre, along the Av. José Malhoa, Praça de Espanha, Av. dos Combatentes and North – South axis up until the Segunda Circular and, in the Eastern part of the city, in the Expo’98 area of intervention and its surroundings. Outside of the city, other office districts have appeared, often as a result of foreign direct investments – especially in the Oeiras municipality, by the Cascais highway.
Retail commerce has also undergone some major changes, in terms of business structure and territorial pattern. The tendency towards the commercial decline of the historical centre has persisted, alongside the emergence of new commercial areas, shopping centres and large supermarkets and general stores, both in the city of Lisbon and in its periphery, along the most accessible transportation axes. These new consumption areas, besides offering a variety of goods and services, have also been increasingly used as leisure areas, particularly by the younger population.
3. Segregation and social and spatial fragmentation of the Lisbon Metropolitan Area
3.1. The dynamics of social change
The changes in the productive structure of the LMA that we have just presented are associated with the dynamics of social change amidst its resident
population and with the new forms of spacial organization of the economic activities and of appropriation of the urban space by the various social groups.
In this section, we seek to identify and to characterize the main tendencies that were visible in the 1990’s with regard to the social and spacial reorganization of the metropolitan territory. For that, we draw on various indicators, at the municipality level, of the social-professional structure and of the housing conditions of the resident population. We should point out, however, that the municipality is a very heterogeneous territorial unit and that, therefore, the increasing social fragmentation of the urban space is hardly visible at this scale.
Over the past twenty-five years, the growing internationalization and the increasing weight of the tertiary sector in the Portuguese economy, particularly in the Lisbon Metropolitan Area, has resulted, as in other major European and world metropolises, in an increase in the income differentials between the highly qualified professionals in the areas of the new communication and information technologies and hi-tech services and an ever-increasing number of undifferentiated workers with low wages, who perform tasks that do not require any special skills or training. What is more, the persistently high level of unemployment – particularly among the women and the young people trying to enter the labour market –, along with the fact that employment has become more and more precarious due to the flexibility strategies in the labour market, has also contributed to the widening of the income span of the families of the Lisbon Metropolitan Area.
By 2001, income from work was the main means of subsistence for more than half (55.5%) of the resident population over 15 years of age in the LMA. The demographic ageing of the population and the rise in the average number of years spent in school have reflected upon the number of people who were dependent either upon retirement pensions and other benefits (22.3%) or upon their families, as is the case with students and housewives. Income from properties, unemployment benefits and other types of social benefits altogether account for less than 5%. As compared with 1991 – even though we should bear in mind that the 1991 figures include all those over 12, not 15, years of age –, it is worth pointing out that there has been an increase in the number of people in the lower echelons of the income scale, such as retired pensioners,
unemployed people and Guaranteed Minimum Income (GMI) beneficiaries (Table 8). The gender analysis of these data brings to the fore the fact that women have much less financial autonomy than men, which is due to the still relatively high number of housewives – despite the increase in female activity rates over the past few years. Moreover, women are over-represented among those living off unemployment benefits and other types of social support, such as retirement pensions or the GMI.
Table 8 – The main source of income of the resident population in 2001 and 1991 (over 15 years of age and over 12 years of age, respectively)
Main source of income 1991 2001
Portugal LMA North bank
Lisbon South bank
Portugal LMA North bank
Lisbon South bank Work 49.47 51.11 51.91 47.40 48.73 52.64 55.50 55.93 48.88 54.33 Rents and income from
holding properties
0.59 .54 .61 .92 .32 .64 .67 .74 1.01 .46
Unemployment benefits 1.10 1.35 1.20 1.08 1.81 2.19 2.47 2.33 2.04 2.89 Temporary subsidies 0.73 .66 .65 .65 .71 .65 .63 .60 .58 .69 Guaranteed Minimum
Income and social support
0.73 .52 .52 .66 .50 .82 .70 .72 1.04 .62
Retirement pensions 20.93 18.95 19.12 25.09 18.46 23.85 22.28 22.31 29.75 22.20 Dependent upon the family 23.02 23.45 22.55 20.54 26.16 17.66 16.13 15.76 15.02 17.16
Other 3.43 3.41 3.41 3.67 3.31 1.55 1-62 1.65 1.68 1.65
Source: INE – 1991 and 2001 Population Census; calculations by the authors.
This table also shows that the level of social fragmentation is higher in the city of Lisbon than in the suburban municipalities, since the relative frequencies of the categories at the two ends of the scale (people living off rents and income from holding properties, on the one hand, and people living off the GMI and other social benefits, on the other) are higher than in the metropolitan area as a whole. Moreover, it is also in the city of Lisbon that one finds the highest percentage of retired people and old aged pensioners, which is due to its higher level of demographic ageing. In turn, the level of unemployment is highest in the Setúbal Peninsula.
These processes, alongside the growing wage differentiation of those working in the service sector, have led not only to an increase in the income
differentials between skilled and unskilled professional groups, but also to a rise in the incidence of poverty and social exclusion – which has been associated with the rising level of unemployment and with the high number of old aged pensioners whose retirement benefits are extremely low. Women, young people in search of their first job, the elderly, immigrants (particularly those without permits), the poorer ethnic minorities and those that have been unemployed for a long time are among the social groups that are the most vulnerable to this new type of social marginality and poverty situations.
The changes in the socio-professional profile of the resident population of the LMA that have taken place in the 1990’s – namely, the increase in the proportion of skilled workers, intelectual and scientific specialists and professionals with intermediate qualifications and the decrease in the number of unskilled laborers and service-sector workers – have brought about an attenuation of the differences between the various municipalities of the LMA in terms of the professional structure of their resident population. This evolution is noticeable in the decrease in the variation coefficients of the percentage of workers in each group of professions for the 19 municipalities of the metropolitan area. However, at the “micro” level, these differences have tended to increase, as a consequence of the growing social fragmentation of the territory and of the intra-municipality asymetries. Nevertheless, in what regards the service sector workers with higher qualifications (managers, intelectual and scientific workers), there remains an over-representation of the former in the city of Lisbon and in the municipalities of the Estoril Coast (Oeiras and Cascais) (Fig. 11) and of the latter in the Setúbal Peninsula, particularly in the Moita and Palmela municipalities. To the North of the Tejo, both in Mafra and in Azambuja there is also a higher than average proportion of workers in the 7th, 8th and 9th categories of the National Profession Classification (NPC) (Fig. 12).
Fig. 11 – NPC categories 1 and 2 (Managers, Directors, Professionals and Scientific workers), 2001
Fig. 12 – NPC categories 7, 8 and 9 (Manufacturing and construction workers, transport workers and tool operators), 2001
3.2. The segregation of residential areas
Ever since the 1950’s, the Lisbon region has undergone a process of steady demographic growth, fostered by a series of successive migration flows: the domestic migration from other parts of the country; the return to the homeland, in 1975-76, of the people that had previously lived in the former Portuguese colonies in Africa; and the steady increase, from the mid-1980’s onwards, in the number of foreign immigrants. This demographic growth has brought forth an increase in the demand for housing, which has been adequately met neither by the formal/private markets nor by the social housing provided by the local and central authorities. Consequently, there has been an accumulated shortage of housing, resulting in the emergence of a parallel market for the subletting of rooms or parts of flats (especially in Lisbon’s historic and older neighbourhoods), along with a number of shantytowns and illegal residential areas, inhabited by those who cannot afford to buy a house in the official market9 (Fonseca, 1999).
According to the 1991 Population Census, 52,854 inhabitants of the LMA (2.08% of the total) lived by then in non-regular family dwellings, 41,829 of which in shanties. As Table 8 illustrates, non-conventional dwellings were highly concentrated in the LMA, since 71.92% of the total Portuguese population that lived in shanties inhabited this area.
The vast majority of the shanties that are known to exist in the LMA are located to the North of the Tejo (85.23%), most of which in the city of Lisbon itself (35.70%).
In the 1990’s, both the central government and the city councils undertook substantial efforts in order to eradicate the remaining shanties from the Lisbon and Porto metropolitan areas, having implemented a Special Rehousing Programme (PER) aimed at providing new houses to shanty-dwelling families.
The 2001 Population Census shows that the number of people living in shanties in the LMA has indeed decreased - particularly in the Oeiras municipality and in the city of Lisbon. Shantitowns were systematically
9
It has been estimated that, by 1981, some 300 000 inhabitants of the Lisbon Metropolitan Area lived in illegal housing units.
destroyed as their residents were given new houses, so as to prevent other people from moving in. However, some 6,818 shanties, inhabited by 23,335 people, still remained in the LMA by 2001, accounting for 0.87% of all the people living in this region10 (Table 9).
Table 9 - Percentage of people living in the various types of housing (1991-2001) Geographic Units Types of housing Conventional Shanties Other Non-conventional Collective n. % n. % n. % n. % 1991 Lisbon 629851 95.01 20695 3.12 4284 0.65 8105 1.22 North bank 1835450 96.64 39736 2.09 9283 0.49 14809 0.78 South bank 633977 98.99 2093 0.33 1742 0.27 2665 0.42 LMA 2469427 97.23 41829 1.65 11025 1.65 17474 0.69 Portugal 9705836 98.37 58161 0.59 36604 0.37 65848 0.67
LMA as a % of the country - 25.44 - 71.92 - 30.12 - 26.54
2001 Lisbon 542964 96.30 7821 1.39 2869 0.51 10164 1.80 North bank 1914542 97.32 20076 1.02 9768 0.50 22873 1.16 South bank 702528 98.31 3259 0.46 4072 0.57 4730 0.66 LMA 2617070 97.58 23335 0.87 13840 0.52 27603 1.03 Portugal 10169722 98.21 38838 0.38 43145 0.42 103573 1.00
LMA as a % of the country - 25.73 - 60.08 - 32.89 - 26.69
Source: INE – 1991 and 2001 Population Census; calculations by the authors.
In this Table, it is also possible to notice an increase in the number of people living in housing units that fall under the category “other” in the suburban municipalities around Lisbon, in both the North and South banks of the Tejo. This has had to do with the increasing prevalence of a new type of precarious dwellings, akin to shanties but made out of bricks, which are considered for statistic purposes to be neither shanties nor conventional housing units. The neighbourhoods made up of these dwellings are, for the most part, inhabited by immigrants and ethnic minorities, particularly of African origin.
The efforts undertaken by the LMA municipalities in terms of rehousing programs aimed at the shanty-dwelling population have allowed for a slight
10
decrease in this type of problems, which no longer are such a prominent feature of the LMA. However, this region remains the one in which the shortage of housing raises the most problems: according to the 2001 Census, 60.1% of the nation-wide number of people who lived in shanties were in the LMA.
At the municipality level, the largest relative number of shanty-dwellers can be found in the city of Lisbon and in the municipalities of the first suburban ring, namely Amadora, Loures, Almada, Odivelas and Cascais (Fig. 13).
Fig. 13 - People living in shanties and other “non-conventional” housing units, 2001 (%)
Apart from the shanties and the precarious housing in certain neighbourhoods of illegal origin, the most serious issue having to do with the housing sector in the Lisbon region is the degree of decay of many of the old buildings in the city itself – especially in the historic boroughs –, in the historic centres of certain suburban areas and in some of the farther and less accessible rural villages that have not yet been affected by the “urban invasion”.
By 2001, despite the progresses made in this field in the 1990’s, 4.2% of the population of the LMA did not yet have access in their homes to either water supply, basic sewage, electricity and/or a bathroom. What is more, in the peripheral municipalities of the metropolitan area, which maintain a distinctively rural flavor, the figures were even higher, in some cases reaching 10% of the resident population. Such is the case of the Mafra and Azambuja municipalities, in the North bank, and the Alcochete, Montijo and Palmela municipalities, in the South bank. (Fig. 14).
Fig. 14 – Dwellings with electricity, water supply, sewage and bathroom, 2001
As compared with the rest of the country, the average dwelling in the LMA is better equipped and served by better infrastructures, insofar as even the worst-off municipalities are in a comparatively better situation than the national average of 90.9% (percentage of dwellings with electricity, water supply, sewage and bathroom).
Between 1942 and 1985, rents were officially frozen in the city of Lisbon, leading to the growth of the suburbs and jeopardizing the rental market. The result was the development of an owner-occupied, condominium-system housing market, in which the speculative hoarding and selling of land and real estates was largely responsible for the desertification of the central areas of the city and for the concentration of service employment within the city. Consequently, throughout the 1990’s the tendency has persisted towards an increase in the percentage of families who actually own the house in which they live, by means of bank loans.
The percentage of owner-occupied housing units is substantially larger in the suburban municipalities, particularly in the South bank, than in the city of Lisbon itself, which has resulted from the process of urban expansion of the Lisbon Metropolitan Area that we have mentioned before. (Table 10).
Table 10 – Family dwellings according to type of occupation in the Lisbon Metropolitan Area, 2001
Geographic Units
Family dwellings according to the type of occupation (%) Total Owner-occupied Rental or Sub-rental Other Portugal 100.00 75.67 20.88 3.45 Lisbon 100.00 47.77 48.71 3.52 North bank 100.00 65.18 31.90 2.91 North bank exc. Lisbon 100.00 72.90 24.45 2.65 South bank 100.00 75.55 22.20 2.25 Lisbon Metropolitan
Area
100.00 67.90 29.36 2.74
Source: INE – 2001 Census (provisional data); calculations by the authors.
This tendency towards the disappearance of the offer of houses for rent has as a consequence the tremendous rigidity of the formal market for housing, which, in turn, explains the lesser residential mobility of the population. The way the vast majority of the middle and lower classes sees it, once you buy a house, you never leave it – either because it takes a very long time to repay the loan in full (whenever the house is bought by means of a bank loan); or because rents tend to fall over time even when they were originally high, since rent increases are subject to administrative control.
Along with the lesser residential mobility of the population, the rent freeze has also brought about the considerable degree of decay of the houses in the older parts of the city, as well as a substantial increase in the number of demolitions of old buildings whose rents were outdated. A process of speculative reconstruction has thus been generated, strongly increasing the density of land tenure (Fonseca, 1990).
The segmentation of the market for housing in the LMA is associated with a social and spatial dimension that reflects the quite disparate way in which the various social groups have access to the various types of housing units available and to the areas in which they are located. Hence, in the industrial city, the territorial pattern of the various types of housing units lies at the core of the spatial segregation.
Over the last few years, the restructuring of production, along with the changes in the social, professional and ethnic composition of the Lisbon Metropolitan Area (due to the economic changes and to the increase in immigration) and the major urban interventions that have taken place both in the city of Lisbon and in the suburban areas have increased the social and economic differentiation of the metropolitan territory.
The construction of several important transportation and communication infrastructures, particularly from the mid-1980’s onwards (due to the structural funds from the EU), such as the Vasco da Gama Bridge, the railway in the 25 de Abril Bridge, the CRIL and CREL ring roads, the North-South axis and the expansion of the subway network, has contributed to an increase in the differentiation between the areas that have been favoured by the aforementioned infrastructures and those that, being farther from them, have assumed an even more marginal position in the metropolitan context.
On the other hand, the urban renewal and improvement interventions undertaken in some areas of central Lisbon and in the Expo’98 world exhibition site, along with several other major real estate investments made – often by foreign investors – in the city of Lisbon and in some of the noblest and most accessible suburban areas, have in fact increased the spatial segregation between the economic activities and the residential areas of the various ethnic and social groups. This transition process has led to certain areas, which were formerly occupied by lower-income groups, being taken over by higher-status
professionals and business people who can afford higher property prices. In addition to these renewed areas, traditional upper-class zones in the western part of Lisbon and along the coast have maintained their capacity to reproduce high-quality images and socio-economic standards.
In the other end of the housing market spectrum, the least favoured groups have continued to concentrate in large social housing complexes and in conglomerates of illegal and precarious housing units. Indeed, and in spite of the efforts undertaken by the Portuguese local and central authorities to rehouse shanty dwellers and other people formerly living in derelict neighbourhoods, the fact is that, up until very recently, the rehousing of these people was carried out en masse by moving them into social housing neighbourhoods that, albeit improving their housing conditions, did not reduce the degree of social and economic spatial segregation. Moreover, the process of rehousing people in places far from where they used to live tends to disrupt their territorial identity ties with the original place of residence. The architectural features of the new buildings often make it very difficult to maintain the old ties between neighbours and, in sum, jeopardize sociability networks – leading to feelings of dissatisfaction and, sometimes, to the rejection of the residential area into which they have been moved (Malheiros, 2000; Guerra, 1994).
4. Concluding remarks
The economic restructuring and the social and demographic transformations undergone by the Lisbon Metropolitan Area over the last twenty years have brought about major changes in the urban structure and in the use of the land, both in the city itself and in the suburbs, thus altering dramatically the urban landscape.
In terms of demography, the slowdown of population growth, the considerable decrease in the number of inhabitants of the city itself, the ageing of the population (both at the top and the bottom of the age pyramid) and the increase in the number of foreign immigrants (as well as their increasingly diverse geographic origins) are all worthy of mention.
In what regards employment and the economic structure of the region, four major trends are noticeable:
the internationalisation of the economy, characterized by the regional concentration of foreign direct investment in Portugal, as well as by the polarization of foreign trade;
the growing participation of women in the labour market, along with the ever more precarious nature of employment;
the expansion of the informal economy, namely in the construction industry and in personal and household services;
the restructuring of industry and the reinforcement of a pattern of productive specialization based on service activities.
With regard to the social structure, the major noticeable changes have to do with the increased income inequality between the social groups at the top and those at the bottom, as well as with the emergence of new types of poverty and social exclusion associated with unemployment, old age and ethnicity.
As a consequence of all these trends, the territorial pattern of economic activity and of residential location has itself undergone profound changes. The result is a city that is nowadays much more fragmented than the modern city used to be, characterized by the existence of rigid spatial divisions.