Non-ruminants
Individual responses of growing pigs to threonine intake
Renan Di Giovanni Isola1, Luciano Hauschild1*, Dani Perondi1, Ines Andretta2, Jaqueline de
Paula Gobi1, Aline Remus1, Alini Mari Veira1 1 Universidade Estadual Paulista, Faculdade de Ciências Agrárias e Veterinárias, Jaboticabal, SP, Brazil. 2 Universidade Federal do Rio Grande do Sul, Faculdade de Agronomia, Porto Alegre, RS, Brazil.
ABSTRACT - A nitrogen balance test was performed to evaluate the individual responses of growing pigs to threonine intake. Eight commercial barrows were used (body weight ranging from 15 to 20 kg). A dose-response study was performed, in which the threonine supply increased in seven equidistant steps (the seven dietary threonine levels ranged from 50 to 120% of the requirements) every three days for each pig. The levels of all other amino acids were 20% higher than the tested amino acid. Nitrogen retention as a function of threonine intake was calculated per individual and per group (NLIN and NLMixed, respectively) using a linear plateau model. The highest break point value was 42.42 g of threonine intake (the most demanding individual), whereas the lowest value was 34.16 g (the least demanding individual), corresponding to a difference of 19%. In terms of N retention, the highest plateau value was 66.71 g and the lowest was 49.48 g, with a difference of 25%. There was no significant correlation between slope and plateau values or between slope and break point values. When using the model in which all parameters were random effects, the variations in threonine intake and nitrogen retention were 1.68±1.30 and 0.01±0.10 g, respectively, and no variance in the slope of the curve was detected. The average daily threonine intake values for the maximum response obtained in the group, as calculated by the NLIN and NLMixed procedures, were 13.96 and 14.02 g/day, respectively. The threonine intake for the maximum N retention between individuals ranged from 34.16 to 42.42 g, corresponding to a difference of 19%. The current recommended intake to optimize N retention is 14.02 g/day. The group responses obtained by the NLMixed procedures are very similar to those estimated by the NLIN procedure (all individuals).
Key Words: amino acids, individuals, nitrogen retention, requirements, variability
© 2018 Sociedade Brasileira de Zootecnia ISSN 1806-9290
www.sbz.org.br
R. Bras. Zootec., 47:e20170143, 2018 https://doi.org/10.1590/rbz4720170143
Received: June 2, 2017
Accepted: October 24, 2017
*Corresponding author: lhauschild@fcav.unesp.br
Copyright © 2018 Sociedade Brasileira de Zootecnia. This is an Open Access article distributed under the terms of the Creative Commons Attribution License (http://creativecommons.org/licenses/by/4.0/), which permits unrestricted use, distribution, and reproduction in any medium, provided the original work is properly cited.
Introduction
Threonine is considered an essential amino acid (AA) and is commonly the second or third limiting AA in pig diets based on corn and soybean meal; however, it may be the first limiting AA when diets are supplemented with synthetic lysine (Saldana et al., 1994). Threonine is critical for maintenance because it is used for the synthesis of muscle protein, mucin in the gastrointestinal system, and immunoglobulins (Nichols and Bertolo, 2008).
An increasing number of studies attempting to determine threonine requirements have been published (Rostagno et al., 2011; NRC, 2012) and the main methods applied are dose-response, which are based on the average response of the population, or factorial, which are based on the response of an average individual. These methods
allow only a single nutrient level to be established and supplied to all animals in a given category for a long period and do not consider the dynamics of the requirements and the variability among individuals within a population (Hauschild et al., 2010). This variability is explained by intrinsic animal factors, such as body weight, genotype, age, and sex, and by extrinsic factors, such as environmental temperature and animal density. Those factors influence the determination of the optimal requirement of a specific nutrient and are essential for understanding the biological mechanisms involved in the responses of the population to this nutrient (Pomar et al., 2003). In addition, the variability among individuals within a population must be determined to optimize the biological, economic, and environmental responses and to establish more accurate nutritional programs.
has on AA requirements (Pomar et al., 2003). In addition, when estimating animal responses to different intake levels of a nutrient, variability should be considered to increase the precision of these estimates. Therefore, the objective of the present study was to evaluate individual and group responses of growing pigs to dietary threonine supply by using a sequential short-term N balance method.
Material and Methods
The experimental procedures were reviewed and approved by the institutional committee on animal use (case no. 018435/13). The experiment was carried out in Jaboticabal, São Paulo, Brazil (21°15'16" S, 48°19'19" W, and 607 m altitude).
Eight barrow pigs (18.83±0.28 kg body weight) of the same high-performance genotype (Camborough × GPIC337; Agroceres PIC Inc.) with good health status were shipped in a single batch to a swine research facility in Jaboticabal, Brazil. All pigs were housed in metabolic cages in a room under controlled temperature (22 to 24 °C) and allowed to adapt to their new environment for eight days before the start of the experiment. Animals were weighed at the beginning and end of the experimental period.
During the adaptation period, pigs were fed a diet formulated to supply their nutritional requirements. In the last three days of the adaptation period, the diet contained 50% less threonine for adaptation to the experimental diets. Subsequently, a 21-day dose-response study was performed, in which the threonine supply increased in seven equidistant steps every three days for each pig, following Kampman-van de Hoek et al. (2013). Threonine levels ranged from 50 to 120% of the requirements (Rostagno et al., 2011). For this purpose, one concentrated diet was formulated to contain 122% of the digestible threonine requirements of pigs (Table 1) and all other amino acids were added at levels 20% higher than the threonine requirement to maintain their ideal ratio to lysine, according to Rostagno et al. (2011). This diet was sequentially diluted with a diet based on starch and free from all amino acids (diluent diet) (Table 1) to obtain the experimental diets containing the seven digestible threonine levels proposed (Table 2). Both diets contained equal levels of energy.
Pigs were offered the same amount of feed twice daily, at 8.00 and 14.00 h. The amount of feed supplied daily to each individual animal was calculated as 2.6 times its maintenance energy requirement (250 kcal metabolizable
energy kg−1 live weight0.60), according to Noblet and Shi
(1993). Pigs were offered water ad libitum throughout the
experimental period.
Faeces were collected at 8.00 h for three consecutive days for each dietary threonine level. At the end of the third day, the faeces collected during the three days were
Table 1 - Ingredients and chemical composition of experimental diets
Item Concentrated Diluent
Ingredient (g kg−1 dry matter)
Corn (78.8) 697.3
-Soybean meal (450.0) 126.7
-Corn starch - 850.0
Rice husk 53.6 101.0
Soybean oil 29.1 23.4
Dicalcium phosphate 14.2 18.0
Limestone 4.8 2.6
Sodium bicarbonate 0.8 0.8
Salt 2.1 2.9
Mineral and vitamin premix1 2.0 2.0
Butylate toluene hydroxide 0.1 0.1
L-alanine 19.3
-L-lysine HCl (780.0) 15.1
-L-valine 6.5
-L-leucine 6.5
-L-threonine 5.8
-L-isoleucine 5.1
-L-phenylalanine 3.3
-Dl-methionine 3.2
-L-histidine 2.6
-L-tryptophan 2.0
-Calculated composition
Crude protein3 (g kg−1 dry matter) 178.2 5.3
Metabolizable energy2 (kcal kg−1) 3.30 3.30
Calcium3 (g kg−1 dry matter) 6.3 6.3
Disponible phosphorus2 (g kg−1 dry matter) 3.3 3.3
SID lysine3 (g kg−1 dry matter) 17.0
-SID methionine3 (g kg−1 dry matter) 4.9
-SID threonine3 (g kg−1 dry matter) 9.4
-SID tryptophan3 (g kg−1 dry matter) 3.1
-SID valine3 (g kg−1 dry matter) 11.9
-SID isoleucine3 (g kg−1 dry matter) 9.9
-SID - standard ileal digestible.
1 Mineral and vitamin mixture (content per kg of supplement): folic acid, 350 mg;
selenium, 75 mg; copper, 9,000 mg; calcium pantothenate, 6,000 mg; biotin, 10 mg; manganese, 25,000 mg; iodine, 125 mg; cobalt, 125 mg; niacin, 14,000 mg; zinc, 48,000 mg; iron, 48,000 mg; vitamin A, 3,500,000 IU; vitamin B1, 400 mg; vitamin B12, 11,000 μg; vitamin B2, 1,600 mg; vitamin B6, 500 mg; vitamin D3, 500,000 IU; vitamin E, 5,000 IU; vitamin K, 1,000 mg; antioxidant (BHT), 2,000 mg.
2 Composition of nutritional ingredients proposed by Rostagno et al. (2011). 3 Determined through high-performance liquid chromatography analysis.
Table 2 - Mixture of diets to obtain threonine levels
Composition1 Level of digestible SID threonine (%)
50 62 74 86 98 110 122 Concentrated diet2 409.8 507.8 606.5 704.9 802.7 901.3 1000.0
Diluent diet2 590.2 492.2 393.5 295.1 197.3 98.7 0.0
Crude protein2 77.5 90.8 104.7 125.8 141.2 156.5 178.2
SID lysine2 7.6 9.6 10.2 12.5 14.2 15.8 17.0
SIS methionine2 2.1 2.8 3.2 3.7 4.2 4.7 4.9
SID threonine2 4.1 5.5 6.2 7.1 8.0 8.5 9.4
SID tryptophan2 1.4 1.7 1.9 2.3 2.5 2.7 3.1
SID valine2 5.1 6.5 7.4 8.8 9.6 10.8 11.9
SID isoleucine2 4.2 5.5 6.3 7.2 8.0 8.8 9.9
SID - standard ileal digestible.
pooled, placed in a plastic bag, with the individual pig identified, and stored in a freezer at −10 °C. At the end of the collection period, faeces were homogenized and a 0.5 kg aliquot was taken, dried in a forced-ventilation oven (60 °C for 72 h), and ground in a ball mill for subsequent chemical analyses.
Urine was collected in plastic buckets, containing 25 mL of HCl, at 8.00 h for three consecutive days for each dietary threonine level. The urine volume was measured and homogenized and a 5% aliquot was collected every 24 h. Urine samples were stored in a refrigerator at 4 °C. At the end of the third day, urine samples were pooled in each threonine level for subsequent analyses. Samples of each diet were randomly collected and analysed for total amino acid composition. The results showed that the analysed values were consistent with the calculated values. Amino acid composition was determined by high-performance liquid chromatography. The dry matter content of the diets and faeces was determined according to the AOAC (2005). The total N content of the diets, faeces, and urine was determined by the combustion method in a LECO/FP-528 apparatus.
Based on apparent N digestibility estimated by the indicator method, the daily faecal N excretion was calculated. Daily N retention was calculated as N intake at day (i) minus urinary N losses and faecal N losses at day (i+1). The threonine intake was calculated as the percentage of threonine in the diet multiplied by the feed intake (g). The obtained data were fit to a linear response plateau (LRP) model to evaluate N retention as a function of threonine intake and were then subjected to residual analysis to determine the goodness of fit of the models.
Two methodologies of analysis were applied in this study. In the first methodology, data were evaluated per individual animal and per group using the NLIN procedure of SAS (Statistical Analysis System, version 9.3). The LRP model described the N retention response (NR) as
a function of threonine intake (Thrint) according to the
following equation:
NR = NRp + b (I − Thrint)when I < Thrintand
NR = NRpwhen Thrint ≥ I,
in which NRp is the plateau, bis the slope of the ascending
line, I is the break point of the threonine intake response,
and Thrint is the dietary threonine intake.
The second methodology used to analyse the data was the NLMixed procedure of SAS, which uses sequential analyses (four steps or models) to evaluate the group response, considering the individual variability. First, the LRP model was fitted for each individual response to
determine the initial parameters to use in the subsequent analyses. The first model, considering the total set of experimental animals, was generated with fixed effects.
Subsequently, the random parameters uI, ub,and uNR were
then created to account for the variation among individuals
and to estimate the parameters I (break point), b (slope),
and NRp (plateau). The random effects uI, ub,and uNRp were
progressively added to the subsequent models. Therefore,
the second model considered the random effect uI, the
third model considered the effects uIand ub, and the fourth
model included the effects uI, ub,and uNRp. This model
was applied using the NLMixed procedure of SAS based on Wolfinger (1999). The steps that included the random effects were analysed using the FIRO (First Order) method and considered the individual animal (replicate) as a factor of fit. The proximity of fit of the four models used in the NLMixed procedure was evaluated by comparing the residual mean squares of each individual using the Wilcoxon paired test.
Results
Animals presented good health status, as indicated by a lack of diarrhoea and their observed feed intake being similar to the estimated feed intake, with the exception of one animal that died during the experiment due to causes unrelated to the feeding program or methodology applied. The average body weight at the beginning of the experiment was 22.14±0.90 kg and the final body weight (after 21 days) was 34.59±2.44 kg (Table 3), resulting in an average daily gain of 0.59 kg.
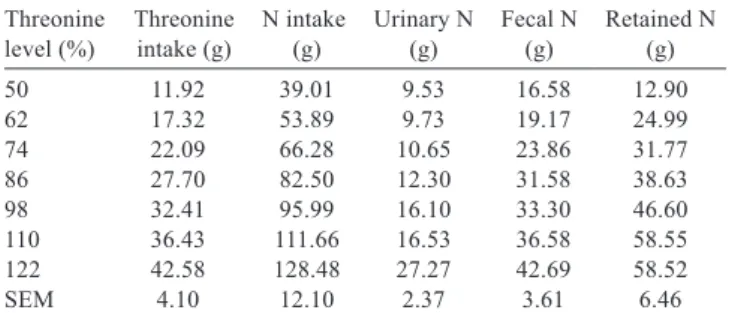
The average Thr intake and N balance for pigs increased when dietary Thr concentration increased (Table 4). The coefficients of determination of the LRP model analysed by the NLIN procedure applied to each individual animal ranged between 0.92 and 0.99, indicating a goodness of fit (Table 5). The coefficient of variation of the parameter related to N retention (NRp) was 5.2%.
Table 3 - Mean values of initial and final body weight (BW) for pigs fed different levels of threonine
Animal Initial BW (kg) Final BW (kg)
1 21.80 39.07
2 23.33 33.61
3 20.83 32.73
4 23.02 34.44
5 22.09 36.75
6 22.59 33.16
7 21.34 32.41
Mean 22.14 34.59
CV 4.06 7.07
In the LRP model generated by the NLIN procedure for all animals (Figure 1), threonine intake was estimated as 41.89 g (break point). The highest break point value was 42.42 g of threonine intake for the individual that was the most demanding, whereas the lowest value was 34.16 g for the individual that was the least demanding, corresponding to a threonine intake difference of 19% for the maximum response. In terms of N retention, the highest plateau value was 66.71 g and the lowest was 49.48 g, representing a difference of approximately 25%. There was no significant correlation between the slope and plateau values (r = −0.34; P = 0.41) (Table 5) or between the slope and break point values (r = 0.02; P = 0.97). However, a positive correlation between the break point and plateau values was detected (r = 0.72; P = 0.04).
No significant difference (P>0.05) was determined when the fit of the four models applied were compared (models 1-2, P = 1.00; models 1-3, P = 0.93; models 1-4, P = 0.93; models 2-3, P = 1.00; models 2-4, P = 1.00;
and models 3-4 P = 1.00; Table 6). The analysis of the data using the NLMixed procedures allowed the variance among individuals to be evaluated for each parameter. The first model considered the entire set of experimental animals and was generated with fixed effects; therefore, there was no parameter variation among individuals. The second model added the break point as a random effect and the threonine intake variance among individuals was determined as 3.11±1.76 g. The parameters for break point and slope were added as random effects in the third model. The break point presented a variance in threonine intake of 1.61±0.61, whereas no variance due to slope was detected. The fourth and last model yielded break point and plateau values of 1.68±0.63 and 0.01±0.03, respectively, but no variation was detected in the slope values.
The group responses obtained by the NLMixed procedures were very similar to those estimated by the NLIN procedure (all individuals). The average daily threonine intake values for maximum response obtained by the NLIN and NLMixed procedures were 13.96 and 14.02 g/day, respectively.
Threonine
level (%) Threonine intake (g) N intake (g) Urinary N (g) Fecal N (g) Retained N (g) 50 11.92 39.01 9.53 16.58 12.90 62 17.32 53.89 9.73 19.17 24.99 74 22.09 66.28 10.65 23.86 31.77 86 27.70 82.50 12.30 31.58 38.63 98 32.41 95.99 16.10 33.30 46.60 110 36.43 111.66 16.53 36.58 58.55 122 42.58 128.48 27.27 42.69 58.52 SEM 4.10 12.10 2.37 3.61 6.46
Table 4 - Mean values of nitrogen balance (N) in pigs fed different levels of threonine1
1 Average values correspond to the period of the three days of each diet.
SEM - standard error of the mean.
Table 5 - Parameters of linear-plateau models relating N retention (NR) to threonine intake (Thrint), calculated values of the slope (b0), break point (I), and plateau (NRp)1,2, and correlations between model parameters
Animal Model parameter R2
b I NRp
1 −1.910 42.424 66.708 0.95 2 −1.776 35.926 59.321 0.99 3 −1.701 39.742 59.622 0.94 4 −1.704 35.732 49.482 0.97 5 −1.560 39.991 59.274 0.97 6 −1.579 38.600 57.536 0.92 7 −1.729 34.155 57.959 0.94 All −1.606 41.889 62.971 0.91
Correlation between model parameters
b I NRp
b 1.00 0.34 −0.34
I - 1.00 0.72*
NRp - - 1.00
1NR = NRp + b (I – Thr
int) when I < Thrint and NR = NRp when Thrint ≥ I. 2 Values correspond to the period of the three days of each diet.
*Significant at 5%.
Values correspond to the period of the three days of each diet.
LP for all individuals [NR = 62.971 − 1.606 (41.889 – Thrint) when 41.889 < X and
NR = 62.971 when Thrint ≥ 41.889 (R2 = 0.91)].
LP animal 1 [NR = 66.708 − 1.910 (42.424 – Thrint) when 42.424 < X and NR =
66.708 when Thrint ≥ 42.424 (R2 = 0.95)].
LP animal 2 [NR = 59.321 − 1.776 (35.926 – Thrint) when 35.926 < X and NR = 59.321
when Thrint ≥ 35.926 (R2 = 0.99)].
LP animal 3 [NR = 59.622 − 1.701 (39.742 – Thrint) when 39.742 < X and NR = 59.622
when Thrint ≥ 39.742 (R2 = 0.94)].
LP animal 4 [NR = 49.482 − 1.704 (35.732 – Thrint) when 35.732 < X and NR =
49.482 when Thrint≥ 35.732 (R2 = 0.97)].
LP animal 5 [NR = 59.274 − 1.560 (39.991 – Thrint) when 39.991 < X and NR =
59.274 when Thrint ≥ 39.991 (R2 = 0.97)].
LP animal 6 [NR = 57.536 − 1.579 (38.600 – Thrint) when 38.600 < X and NR =
57.536 when Thrint ≥ 38.600 (R2 = 0.92)].
LP animal 7 [NR = 57.959 − 1.729 (34.155 – Thrint) when 34.155 < X and NR =
57.959 when Thrint≥ 34.155 (R2 = 0.94)].
Discussion
The slopes of the LRP models were different among individuals, showing that there was variability between them. However, there was no correlation between the slope and the plateau, suggesting that protein deposition was not associated with the efficiency of amino acid utilization in the animals evaluated. However, a correlation was observed between the broken line and plateau parameters, which suggested that protein deposition was associated with the threonine intake. In fact, this correlation was expected. Moehn et al. (2004) used indicator amino acid oxidation methodology to estimate amino acid catabolism and concluded that animals with high protein deposition potential present lower lysine catabolism, with a consequently better efficiency in utilizing this amino acid. This indicates a positive correlation between the efficiency of lysine utilization and the protein deposition potential of the animal. The absence of an observed correlation in our study and in assays using similar methodology may be related to the empirical form of representing efficiency, particularly to the mathematical interpretation that is used to fit individual response (i.e., parameters are independently estimated).
The 5.2% coefficient of variation is consistent with the findings of published studies about the response of growing pigs to amino acid intake (Heger et al., 2007; Heger et al., 2008; Heger et al., 2009). This indicates that the maximum protein deposition rate also varies considerably among individuals, even when animals present homogenous characteristics (genetic strain, age, and sex) and are evaluated under the same environmental and health-challenged conditions. In addition, it emphasizes the importance of pre-selecting animals according to their protein deposition potential (De Lange et al., 2001), particularly when experiments are designed with a limited number of animals per treatment.
The mean daily values of threonine intake for the maximum N retention obtained by NLIN and NLMixed procedures were higher than the daily values recommended by the NRC (2012); the recommendation for threonine
is 9.15 g/day for pigs weighing between 20 and 50 kg. However, for animals with a high potential for lean meat deposition, the threonine requirements increase. Thong and Liebert (2004) observed that the threonine recommendation can vary between 8.96 and 12.22 g/day for pigs that have lean meat deposition between 130 and 160 g/day, respectively.
One of the reasons that can help explain why there were no observed differences between models is that the threonine intake variance among individuals was observed only for the break point parameter. For the slope parameter, no variance was detected. This can also be due to the empirical form of representing efficiency (slope) that we used to fit individual response. This form of efficiency assumes no differences among individuals for feed efficiency. Furthermore, the variance for break point was lower. The low variability among the pigs in this study may have contributed to this result. Despite of that, it is important to observe that, even in homogenous populations, some important variability can be detected (e.g., a 5% coefficient of variation in the threonine intake). Consequently, when a group of pigs is heterogeneous (i.e., when there is higher variability among individuals), the results obtained with this methodology may be more appropriate. The method based on the NLMixed procedure may provide more accurate estimates of the requirements for maximum response (i.e., protein deposition) because it allows the inclusion of other parameters (e.g., break point) to be included as random effects in the analysis.
One of the main problems when performing dose-response studies with growing pigs is the duration of the experimental period. Nitrogen balance techniques typically requires five to seven days of supply of each studied amino acid level. Obviously, the physiological status of the animals was not identical during the experimental period. In the present study, the method of supplying diets with increasing threonine levels every three days may have overcome this issue because the urinary N content reaches a new balance within three days after the dietary addition of the amino acid, which limited protein deposition (Brown and Cline, 1974; Fuller et al., 1979). Therefore, this technique may
Table 6 - Parameters generated by the NLMixed procedure between nitrogen retention (NR) and threonine intake (Thrint), calculated values of slope (b), break point (I), plateau (NRp), and variances (uI, ub, and uNRp) of parameters1
Model b I2 NRp2 u
I2 ub2 uNRp2
1 - Fixed effects −1.606 41.889 62.978 - -
-2 - Random effects (uI) −1.611 41.914 62.971 3.111 -
-3 - Random effects (uI, ub) −1.564 42.072 62.691 1.610 0.000
-4 - Random effects (uI, ubuNRp) −1.568 42.072 62.691 1.681 0.000 0.010 1 Mean values corresponding to the period of the three days of each diet.
2 NR = NR + b(I – Thr
be used to study the response of individual animals to amino acid intake and, consequently, the variability of their nutritional requirements.
The importance of considering the variability among individual animals has been noted for several decades, but few studies have evaluated its effects on amino acid requirement estimates (Pomar et al., 2003). The method used to evaluate individual responses in the present study showed that there is individual variation in N retention as a function of threonine intake. Because the fitting method of the NLMixed procedure included the random effects in a gradual manner, it allowed the variability in threonine intake and N retention within each group to be quantified, which contrasts previous studies (Saldana et al., 1994; Coma et al., 1995) that only applied methods that considered the average response of the population.
The individual nitrogen retention responses to the threonine intake levels obtained in this study provided relevant information on the variability of individuals, which may be used to improve stochastic models and develop more accurate nutritional and genetic strategies.
The sequential short-term N balance method gave values for threonine requirements that were similar to conventional methods. The short experimental period allows the estimation of population variability, which provides a more accurate calculation of the effect of altering threonine intake on herd performance. When estimating the optimal levels for a group, the variations in individual response should be considered, but the method based on the NLMixed procedure provides more accurate estimates because it allows the inclusion of random effects in the analysis.
Conclusions
The current recommended threonine intake to optimize N retention is 14.02 g/day. The group responses obtained by the NLMixed procedures are very similar to those estimated by the NLIN procedure (all individuals).
Acknowledgments
The authors would like to thank (Project: 2012/03781-0) Fundação de Amparo à Pesquisa do Estado de São Paulo (FAPESP), Conselho Nacional de Desenvolvimento Científico e Tecnológico (CNPq), and Coordenação de Aperfeiçoamento de Pessoal de Nível Superior (CAPES), for funding this study, and the company Ajinomoto do Brasil Comércio de Alimentos Ltda, for donating the amino acids.
References
AOAC - Association of Official Analytical Chemists. 2005. Official methods of analysis. 18th ed. AOAC. Gaithersburg, MD, USA. Bertolo, R. F.; Moehn, S.; Pencharz, P. B. and Ball, R. O. 2005.
Estimate of the variability of the lysine requirement of growing pigs using the indicator amino acid oxidation technique. Journal of Animal Science 83:2535-2542.
Brown, J. A. and Cline, T. R. 1974. Urea excretion in the pig: an indicator of protein quality and amino acid requirements. The Journal of Nutrition 104:542-545.
Coma, J.; Carrion, D. and Zimmerman, D. R. 1995. Use of plasma urea nitrogen as a rapid response criterion to determine the lysine requirement of pigs. Journal of Animal Science 73:472-481. De Lange, C. F.; Gillis, A. M. and Simpson, G. J. 2001. Influence of
threonine intake on whole-body protein deposition and threonine utilization in growing pigs fed purified diets. Journal of Animal Science 79:3087-3095.
Ferguson, N. S.; Gous, R. M. and Emmans, G. C. 1997. Predicting the effects of animal variation on growth and food intake in growing pigs using simulation modelling. Animal Science 64:513-522. Fuller, M. F.; Livingstone, R. M. and Baird, B. A. 1979. The optimal
amino acid supplementation of barley for the growing pig. British Journal of Nutrition 41: 321-331.
Hauschild, L.; Pomar, C. and Lovatto, P. A. 2010. Systematic comparison of the empirical and factorial methods used to estimate the nutrient requirements of growing pigs. Animal 4:714-723. Heger, J.; Krizova, L.; Sustala, M.; Nitrayová, S.; Patras, P. and
Hampel, D. 2007. Assessment of statistical models describing individual and group response of pigs to threonine intake. Journal of Animal and Feed Sciences 16(3):420.
Heger, J.; Křížová, L.; Šustala, M.; Nitrayova, S.; Patráš, P. and Hampel, D. 2008. Individual response of growing pigs to sulphur amino acid intake. Journal of Animal Physiology and Animal Nutrition 92:18-28.
Heger, J.; Křížová, L.; Šustala, M.; Nitrayová, S.; Patráš, P. and Hampel, D. 2009. Individual response of growing pigs to lysine intake. Journal of Animal Physiology and Animal Nutrition 93:538-546.
Kampman-van de Hoek, E.; Gerrits, W. J. J.; van der Peet-Schwering, C. M. C.; Jansman, A. J. M. and van den Borne, J. J. G. C. 2013. A simple amino acid dose–response method to quantify amino acid requirements of individual meal-fed pigs. Journal of Animal Science 91:4788-4796.
Moehn, S.; Bertolo, R. F.; Pencharz, P. B. and Ball, R. O. 2004. Indicator amino acid oxidation responds rapidly to changes in lysine or protein intake in growing and adult pigs. The Journal of Nutrition 134:836-841.
Moehn, S.; Shoveller, A. K.; Rademacher, M. and Ball, R. O. 2008. An estimate of the methionine requirement and its variability in growing pigs using the indicator amino acid oxidation technique. Journal of Animal Science 86:364-369.
Nichols, N. L. and Bertolo, R. F. 2008. Luminal threonine concentration acutely affects intestinal mucosal protein and mucin synthesis in piglets. The Journal of Nutrition 138:1298-1303.
Noblet, J. and Shi, X. S. 1993. Comparative digestibility of energy and nutrients in growing pigs fed ad libitum and adults sows fed at maintenance. Livestock Production Science 34:137-152.
NRC - National Research Council. 2012. Nutrient requirements of swine. 11th ed. National Academy of Science, Washington, DC. Pomar, C.; Kyriazakis, I.; Emmans, G. C. and Knap, P. W. 2003.
Rostagno, H. S.; Albino, L. F. T.; Donzele, J. L.; Gomes, P. C.; Oliveira, R. F.; Lopes, D. C.; Ferreira, A. S.; Barreto, S. L. T. and Euclides, R. F. 2011. Tabelas brasileiras para aves e suínos - Composição de alimentos e exigências nutricionais. 3.ed. Viçosa, MG.
Saldana, C. I.; Knabe, D. A.; Owen, K. Q.; Burgoon, K. G. and Gregg, E. J. 1994. Digestible threonine requirements of starter and finisher pigs. Journal of Animal Science 72:144-150.
Thong, H. T. and Liebert, F. 2004. Potential for protein deposition and threonine requirement of modern genotype barrows fed graded levels of protein with threonine as the limiting amino acid. Journal of Animal Physiology and Animal Nutrition 88:196-203.