Engineering
ISSN: 1809-4430 (on-line)
_________________________
1Research developed in the discipline of "Data Mining and Knowledge Discovery" studied in the Graduate Program in Agricultural
Engineering - PGEAGRI, from Western Paraná State University (UNIOESTE) – Cascavel Campus - PR/ BR, in 2015
3UNIOESTE/ Cascavel - PR, Brasil.
COMPARATIVE ASSESSMENT BETWEEN PER-PIXEL AND OBJECT-ORIENTED
FOR MAPPING LAND COVER AND USE1
Doi:http://dx.doi.org/10.1590/1809-4430-Eng.Agric.v37n5p1015-1027/2017
VICTOR H. R. PRUDENTE2*, BRUNO B. DA SILVA3, JERRY A. JOHANN3,
ERIVELTO MERCANTE3, LUCAS V. OLDONI3
2*Corresponding author. UNIOESTE/ Cascavel - PR, Brasil. E-mail: [email protected]
ABSTRACT: The traditional per-pixel classification methods consider only spectral information, and may be limited. Object-based classifiers, however, also consider shape and texture, firstly segmenting the image, and then classifying individual objects. Thus, a Geographic Object-Based Image Analysis (GEOBIA) was compared in conjunction with data mining techniques and a traditional per-pixel method. A cut of Landsat-8, bands 2 to 7, orbit/point 223/77, located between the municipalities of Cascavel, Corbélia, Cafelândia and Tupãssi, in the west part of the state of Paraná, from 12/18/2013 was used. In the GEOBIA approach was realized image segmentation, spatial and spectral attribute extraction, and classification using the decision tree supervised algorithm, J48. For the per-pixel method, we used the supervised Maximum Likelihood Classifier. Both approaches presented equivalent results, with Kappa Index of 0.75 and Global Accuracy (GA) of 78.97% for the approach by GEOBIA and Kappa Index of 0.72 and GA of 77.44% for the per-pixel classification. The classification by GEOBIA showed better accuracy for the soil, forest and soybean classes, and did not show the splash aspect, which visually improves the classification result.
KEYWORDS: GeoDMA, data mining, decision tree.
INTRODUCTION
Information about the land cover and use of a region are fundamental in studies such as mapping of deforestation and forest degradation, evaluation of the erosion risk, identification and estimation of areas with agricultural crops and analysis of urban expansion (Adami et al., 2012; Vieira et al., 2012; Maleky & Razavi, 2013; Souza et al., 2013a; Panagos et al., 2014). Based on this problem, data from orbital remote sensing represent a reliable tool for mapping the dynamics of land cover and use earth’s surface on a large scale in different spectral, spatial and temporal resolutions (Bradley et al., 2007; Bioucas-Dias et al., 2013).
This range of sensors and resolutions from orbital remote sensing produces a huge amount of data. For example, optical satellites from the US, China, Brazil, India and Europe produced, in 2013, a data volume equivalent to that produced in 10 years by the Landsat-7 satellite (Körting et al., 2013). This shows a disparity between the ability to produce and to store this massive amount of data and the efficiency of conventional methods in analyzing them quickly and accurately (Wu et al., 2014).
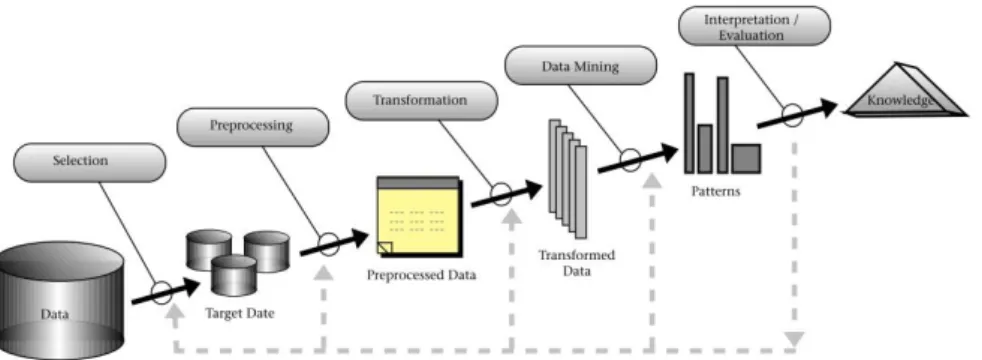
FIGURE 1. Overview of the steps of the KDD process (Fayyad et al., 1996).
The Data Mining (DM), one of the KDD stages, has machine-learning algorithms, such as the decision tree, that facilitate the process of extracting and recognizing patterns. Through these results, new knowledge is provided, which can be applied in the original data set, or in new data sets, aiming at solutions of problems like category classification (Cracknell & Reading, 2014).
Johann et al. (2013) used DM techniques in temporal NDVI profiles to identify spectrally homogeneous soybean areas. Delgado et al. (2012) carried out the spectral classification of sugarcane by decision tree and obtained good results. Nonato & Oliveira (2013) achieved good performances (accuracy rate of approximately 97% of the cases and a lower Kappa Index of 0.86) using DM techniques in Landsat-5 images to identify areas with sugarcane in the State of São Paulo.
Much of the analysis of the 1980s and 1990s of satellite images were based on per-pixel statistical algorithms. One of the algorithms most used for classification based on pixel analysis is the Maxver (Maximum Likelihood) and has been showing reliable results in the mapping of the soil use with satellite images (Santos et al., 2011; Sanhouse-Garcia et al., 2016).
These techniques represent the knowledge about patterns of soil use, considering a limited number of spectral parameters of the pixels, such as average and standard deviation (Blaschke, 2010). One of the major limitations of these algorithms is that the targets may have similar spectral patterns, such as regions with vegetation (agricultural areas and forest), resulting in confusing interpretations (Myint et al., 2011).
The Geographic Object-Based Image Analysis (GEOBIA) has shown a more efficient approach when compared to classifiers based on per-pixel classification (Chen et al., 2012). The GEOBIA can consider the classification of images based on the topological information (neighborhood, context) and geometric (shape, size) of the objects.
The GeoDMA (Geographic Data Mining Analyst) application, proposed by Körting et al. (2013), is used by GEOBIA for image classification, presenting the advantages of integrating image analysis tools and DM techniques into a single free and open source program. However, in most of the studies, the GeoDMA was applied in high spatial resolution images for classification of Urban Areas or extraction of patterns in deforestation structures (Maciel et al., 2012; Thompso et al., 2013; Körting et al., 2014).
The aim of this study was to compare two supervised classification methodologies to characterize the land cover and use in medium resolution images (Landsat-8), one using GEOBIA and DM techniques for obtaining the best parameters of the classification and another using the traditional per-pixel classification, through the Maxver classifier.
MATERIAL AND METHODS
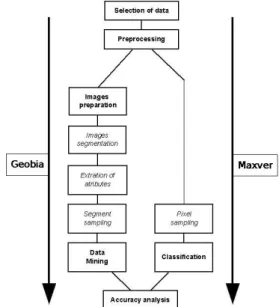
classification accuracy were common to both classification methodologies. These approaches aim to characterize the land cover and use in seven classes. Soybean, Corn and Pasture represent the use related to agriculture; Native Forest represent the land cover, Reforestation represent the vegetation, besides the classes of Urban Area and exposed Soil.
FIGURE 2. Flowchart of operations used to classify images using Geobia and Maxver.
Data Selection
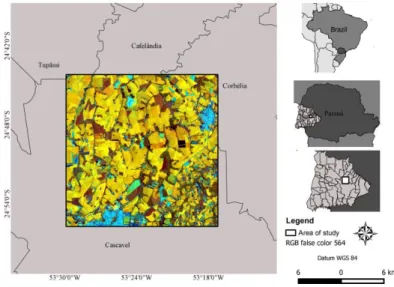
An image of the Landsat-8 satellite, bands 2 to 7 of the Operational Land Imager (OLI) sensor was selected. The low cloud incidence (less than 5%) and the period in which the main annual agricultural crops of the region (soybean and corn) are close to their maximum vegetative development (Souza et al., 2015), were considered as criteria for the choice of the image of 12/18/2013 that belongs to the orbit/point 223/77. The bands used comprise the spectral regions of the visible, blue (band 2), green (band 3) and red (band 4); the NIR - Near Infrared (band 5); and SWIR - Short-wave Infrared 1 and 2 (bands 6 and 7, respectively). These bands have spatial resolution of 30 meters, 16-day temporal radiometric of 16-bit and are comprised between the wavelengths of 0.45 to 2.29 micrometers.
Image Preprocessing
In the preprocessing stage, the analyzes were subdivided into: atmospheric correction and cut of the image bands to the area of interest, making the false-color composition R5G6B4 to better identify the targets for training and making the image cubes with the OLI sensor strip cuts (band 2 to band 7) of the Landsat-8 satellite. The QGIS software was used to prepare the image used in the two comparative classification methodologies.
The correction for reflectance values was carried out using the QGIS “Geosud Reflectance TOA” plug-in, generating bands in 16-bit integer format, reducing the size of the images and improving the processing time in the software.
FIGURE 3. Location of the study area.
GEOBIA
The processes involving the GEOBIA approach were carried out using TerraView software. The image segmentation, attribute extraction and sampling for training were the stages performed specifically through the GeoDMA plug-in (Körting et al., 2013) of the software.
Preparation of images
The previously cut and corrected images were imported into the TerraView 4.2.2 software in a Microsoft Database (MDB), using the ACCESS, Database Management System (DBMS).
Image Segmentation
Through the GeoDMA, the segmentation process was carried out on the cube of the analyzed image. In this process, we used the algorithm that is based on the growing region, developed by Bins et al. (1996). The euclidean distance and the minimum area were used as parameters, with values of 30 and 20 respectively. These values returned the best image segmentation processes after carrying out several tests.
Extraction of attributes
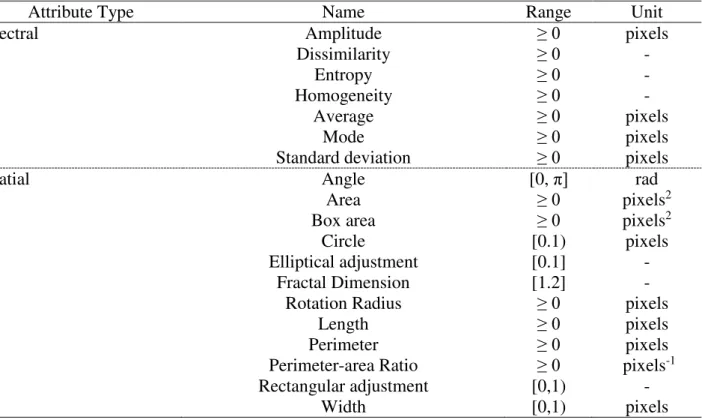
After the segmentation process, the spectral and spatial attributes of the images were extracted (Table 1), using the GeoDMA tool, adapted from the methodology of Körting et al. (2013). According to Körting et al. (2013), the attributes based on segmentation include spatial and spectral metrics for describing each region (objects-based) stored in the database. Spatial attributes are related to all values of a region, including metrics for maximum and minimum values of pixels or texture properties, while spatial attributes measure the shapes of objects-based, such as length and width.
TABLE 1. Attributes extracted from the segments by the GeoDMA tool.
Attribute Type Name Range Unit
Spectral Amplitude ≥ 0 pixels
Dissimilarity ≥ 0 -
Entropy ≥ 0 -
Homogeneity ≥ 0 -
Average ≥ 0 pixels
Mode ≥ 0 pixels
Standard deviation ≥ 0 pixels
Spatial Angle [0, π] rad
Area ≥ 0 pixels2
Box area ≥ 0 pixels2
Circle [0.1) pixels
Elliptical adjustment [0.1] -
Fractal Dimension [1.2] -
Rotation Radius ≥ 0 pixels
Length ≥ 0 pixels
Perimeter ≥ 0 pixels
Perimeter-area Ratio ≥ 0 pixels-1
Rectangular adjustment [0,1) -
Width [0,1) pixels
Sampling for Training
For the classification process, it is necessary to obtain training samples, which consists in the selection of pixels or homogeneous regions that best represent each one of the classes. Based on these regions, the algorithms extrapolate to the rest of the image, thus carrying out the classification process.
The selection of the training samples was carried out on a false-color image R5G6B4 image, which visually accentuated the difference among the soybean, corn, forest and reforestation classes, which in other compositions may be similar. In this composition, the soybean presents yellow/orange tint and the corn presents brown/red tint (Figure 3), as reported by Mercante et al., (2012) when classifying soybeans in the Cascavel-PR region using the Landsat-5/TM composition R4G5B3 (equivalent to the false-color composition of R5G6B4 Landsat-8/OLI) of December 2008 and Souza et al. (2013b) when classifying four classes, including soybean and corn, in a municipality near Cascavel-PR. The forest and reforestation are brown in color, with a difference in texture. The reforestation has a more regular texture than the forest, because it is planted. The exposed soil and the urban area have cyan color and can be differentiated visually by the form, because in the urban Area it is possible to identify constructions. In the classification oriented by object-based, a sampling using the GeoDMA plug-in was carried out, considering the number of 17 samples (segments) for the reforestation class, 21 for forest, 25 for corn, 19 for soil, 17 for urban area and 21 for soybean.
Data Mining
The supervised algorithm J48 was used to classify the objects-based in the WEKA (Waikato Environment for Knowledge Analysis) software (Hall et al., 2009). The parameters used for generation and validation of the decision tree were cross-validation, with folds of 10. The choice of WEKA software to the GeoDMA software was due to the presence of a greater number of evaluation methods of the generated trees.
Per-pixel Approach
Considering the per-pixel classification, the sampling and the classification process were carried out through the SCP plug-in, present in the QGIS software. The Maxver algorithm was used in this stage.
Training Sampling
The training sampling consists of obtaining pixels belonging to each class. A total of 434 samples (pixels) were obtained for the reforestation class, 1321 for forest, 1608 for corn, 870 for soil, 1465 for urban area and 3938 for soybean. All selected pixels did not contain spectral mixing; only the characteristic pixels of each class were selected.
Classification
In the per-pixel classification, the Maxver classifier was used. All stages, from sample selection to algorithm application, were performed in the QGIS software, through the SCP plug-in, and several tests were carried out to find the parameters that would result in better classification.
Accuracy Analysis
To evaluate the accuracy of the classifications, the error matrixes were drawn from the random distribution of points (65 points per class). Through visual inspection of high-resolution images of Google Earth, and in some cases, in the false-color image R5G6B4 , allied to the
interpreter’s experience, it was verified which class each point belongs to. The process of
distribution and visual inspection of the points was carried out through the QGIS software.
The Kappa Index, obtained by the error matrix, was used to evaluate the classification accuracy and the decision trees. The Global Accuracy (GA) was also used to evaluate the performance of the decision trees (Cohen, 1960; Congalton, 1991).
Producer Accuracy (PA) was also determined, which refers to the probability that a given
pixel is correctly classified and the User’s Accuracy (UA) indicating the probability that a pixel
classified in the image represents that category in the field (Congalton, 1991). According to Johann et al. (2012), the producer error occurs with the inclusion of an object in a class to which it does not belong and the user error when an object is excluded from the class to which it belongs.
The Z test was used to test the statistical significance of the difference between Kappa indices. The significance of the difference between different Kappa coefficients can be evaluated by the deviation of the normal curve (Gleriani et al., 2005; Amaral et al., 2009; Cohenca & Carvalho, 2015). The null hypothesis posed by the Z test is that the different classifications have no significant difference (at 5% significance) as to their accuracy, versus the alternative hypothesis that there is a difference.
RESULTS AND DISCUSSION
The results found for the classifications were subdivided into objects-based classification and per-pixel classification.
Objects-based Classification
After the data mining stage, the initial database containing 69 spatial and spectral attributes extracted from the objects-based (segments) and the six bands of the Landsat-8 image was reduced. Of all the attributes considered for classification by GEOBIA, the decision rules considered relevant only three bands (2, 4 and 7) and two attributes of the spectral and spatial combinations (rp) of objects-based (Figure 4). The attributes considered are the mode of the rp values of bands 2 and 7 (rp_mode _B2 and rp_ mode_B7), and rp entropy of band 4 (rp_Entropy_B4).
represent that the image has no uniform texture. The classes in which there was greater difficulty of differentiation were forest and corn, needing more nodes of the tree to differentiate them. Possibly this occurs due to the spectral similarity of the two classes.
FIGURE 4. The decision tree, considering object-based classification.
The decision tree for objects-based showed, through the cross-validation process, a Kappa Index of 0.94 and GA of 94.96%, incorrectly classifying only one instance of the forest class as corn class (Figure 4). In the object-based classification (Figure 5), the predominance of the soybean crop is observed, occupying 65.85% of the region.
FIGURE 5. Classification considering the object-based approach
Per-pixel Classification
Considering the classification of the per-pixel approach (Figure 6), using the Maxver classifier, soybean cultivation predominated in the area (63.92%), similarly to the object-based classification. This high value is justified, because the image is from December, belonging to the period of the main agricultural crop of the state (Souza et al., 2015; Zhong et al., 2016).
The splash aspect characterized by the presence of isolated pixels in the image, making the visual aspect of the per-pixel classification areas less homogeneous when compared to the object-based classification (Figure 5), as observed by Hao et al. (2015). According to Blaschke et al. (2014), the pixel-based classification is justified only when the objects of interest are smaller or similar to the spatial resolution.
FIGURE 6. Classification considering the per-pixel approach
Accuracy
The confusion matrix (Table 2) was generated after crossing the 390 sampling points with the mapping obtained with GEOBIA classification. The Kappa Index found for this classification process was 0.75 and GA of 78.97%. The main source of error occurred in the classification of 25 urban area s as a soil category. The pattern found in this study is similar to that found by Zhang et al. (2014), which reports that the urban area classification presents few pure pixels due to the spectral mixture that occurs in these areas with regions of anthropic activity and vegetation in the same pixel, with spectral characteristics similar to the exposed soil, resulting in high confusion between these classes.
The corn and reforestation classes were erroneously classified as forest at 20 and 11 points respectively. Messias (2012) found similar results, which classified Landsat-5/TM images, obtaining great confusion between agricultural crops and the forest class.
TABLE 2. Error matrix for object-based classification.
Reference
Urban Area Forest Corn Reforestation Soybean Soil TOTAL
C
lassific
ati
on Urban Area Forest 40 1 60 0 0 1 0 2 0 1 25 0 65 65
Corn 0 20 42 2 1 0 65
Reforestation 1 12 0 51 0 1 65
Soybean 0 1 3 0 59 2 65
Soil 3 0 4 0 2 56 65
TOTAL 45 93 50 55 63 84 390
classifications, returned a Z statistic of 0.52 and a p-value of 0.60, at 5% significance. Therefore, there was no significant difference between the GEOBIA and per-pixel approaches.
TABLE 3. Error matrix for the per-pixel classification.
Reference
Urban Area Forest Corn Reforestation Soybean Soil TOTAL
C
lassific
ati
on Urban Area Forest 42 0 54 7 1 3 0 0 0 7 15 1 65 65
Corn 0 6 55 0 0 4 65
Reforestation 6 7 0 52 0 0 65
Soybean 1 4 1 0 58 1 65
Soil 8 6 3 0 7 41 65
TOTAL 57 84 63 52 72 62 390
The soybean class obtained the highest PA (93.65%) in the GEOBIA classification (Table 4), not classifying 6.35% of the real area of the crop. The reforestation obtained the highest UA (92.31%), thus 7.69% of the area classified as reforestation is not reforestation. The urban area class had the lowest UA accuracy (61.54%), indicating a greater inclusion error (38.46%) among the classes of this approach. The largest error of omission (33.33%) occurred in the soil class (PA of 66.67%).
The reforestation class obtained 100% of PA for the per-pixel approach (Table 4), indicating that there was no omission error. The soybean class obtained the highest UA value (89.23%), indicating that there was an inclusion error of 10.77%, classifying other classes in this class. The largest error of omission (35.71%) occurred in the forest class (PA of 64.29%). The soil class obtained UA (63.08%), leading to the largest inclusion error (36.92%).
TABLE 4. PA and UA for GEOBIA and per-pixel classifications.
GEOBIA Per- pixel
PA (%) UA (%) PA (%) UA (%)
Urban Area 88.89 61.54 73.68 64.62
Forest 64.52 92.31 64.29 83.08
Corn 84.00 64.62 87.30 84.62
Reforestation 92.73 78.46 100.00 80.00
Soybean 93.65 90.77 80.56 89.23
Soil 66.67 86.15 66.13 63.08
Souza et al. (2013b) in Landsat-5 classification, using the Maxver classifier, considering the classes of soybean, corn, forest and soil, obtained the highest PA for the soybean and forest classes and the highest UA for the classes of corn and soil.
TABLE 5. Z test and p-value for comparison between GEOBIA and per-pixel classifications.
Estatística Z P-value
Urban Area -0.36 0.716
Forest 1.60 0.109
Corn -2.62 0.009*
Reforestation -0.22 0.829
Soybean 0.29 0.770
Soil 3.02 0.002*
Considering the application of the Z test, at 5% significance, for each class of use (Table 5), the per-pixel approach obtained better classification for the corn class. The soil class, on the other hand, was more accurately differentiated by the GEOBIA approach. The other classes did not differ statistically in both approaches, considering the Z test at 5% significance.
The use of the segmentation process, together with the classification of the land cover and use by the decision tree for the medium resolution satellite images, showed results equivalent to the traditional approaches for the study area. Although the GEOBIA considers more information for classification, for some studies, such as Sarmiento et al. (2014) and Duro et al. (2012), the spectral attributes were determinant in the mapping of land use.
CONCLUSIONS
The results indicate that the process of classification of land cover and use by the GEOBIA method present efficiency equivalent to the per-pixel analysis. The classification by GEOBIA showed better accuracy for the Soil, Forest and Soybean classes, and the per-pixel approach presented better accuracy for the Corn and Reforestation classes. In the GEOBIA classification, the splash aspect was not found, which visually improves the classification result. The classification using Maxver required less processing time.
New approaches in future studies, considering different dates, sensors and algorithms are necessary to consolidate the use of the tool.
ACKNOWLEDGEMENTS
The authors thank the Araucaria Foundation (Paraná/Brazil), CAPES and CNPq for financial support
REFERENCES
Adami M, Rudorff BFT, Freitas RM, Aguiar DA, Sugawara LM, Mello MP (2012) Remote sensing time series to evaluate direct land use change of recent expanded sugarcane crop in Brazil.
Sustainability 4(12):574-585. Available: http://www.mdpi.com/2071-1050/4/4/574/.
Amaral MVF, Souza ALde, Soares VP, Soares CPB, Leite HG, Martins SV, Fernandes Filho EI, Lana JMde (2009) Avaliação e comparação de métodos de classificação de imagens de satélites para o mapeamento de estádios de sucessão florestal. Revista Árvore 33(3):575-582.
Bins LS, Fonseca LMG, Erthal GJ, Ii FM (1996) Satellite imagery segmentation: a region growing approach. Simpósio Brasileiro de Sensoriamenta Remoto. Salvador, INPE, Anais...
Bioucas-Dias JM, Plaza A, Camps-Valls G, Scheunders P, Nasrabadi NM, Chanussot J (2013) Hyperspectral remote sensing data analysis and future challenges. IEEE Geoscience and Remote Sensing Magazine 1(2):6-36.
Blaschke T (2010) Object based image analysis for remote sensing. ISPRS Journal of Photogrammetry and Remote Sensing 65(1):2-16.
Blaschke T, Hay GJ, Kelly M, Lang S, Hofmann P, Addink E, Feitosa RQ, Meer FVanDer, Werff HVanDer, Coillie FVan, Tiede D (2014) Geographic object-based image analysis – Towards a new paradigm. ISPRS Journal of Photogrammetry and Remote Sensing 87:180-191.
DOI:http://dx.doi.org/10.1016/j.isprsjprs.2013.09.014.
Bradley BA, Jacob RW, Hermance JF, Mustard JF (2007) A curve fitting procedure to derive inter-annual phenologies from time series of noisy satellite NDVI data. Remote Sensing of Environment 106(2):137-145.
Castejon EF, Fonseca LMG, Forster CHQ (2015) Improvements over the geometric correction of CBERS-CCD images by using classified georeferenced samples. Boletim de Ciências Geodésicas 21(4):658-673.
Chen G, Hay GJ, St-Onge B (2012) A GEOBIA framework to estimate forest parameters from lidar transects, Quickbird imagery and machine learning: A case study in Quebec, Canada. International Journal of Applied Earth Observation and Geoinformation 15(1):28-37.
DOI:http://dx.doi.org/10.1016/j.jag.2011.05.010.
Cohen J (1960) A coefficient of agreement for nominal scales. Educational and Psychological Measurement 20(1):37-46.
Cohenca D, Carvalho R (2015) Comparação de métodos de classificação OBIA, Máxima
Verossimilhança e Distância Mínima em imagem OLI/Landsat-8 em área de alta diversidade de uso do solo. In: Simpósio Brasileiro de Sensoriamento Remoto. João Pessoa, Instituto Nacional de Pesquisas Espaciais, Anais...
Congalton RG (1991) A review of assessing the accuracy of classifications of remotely sensed data. Remote Sensing of Environment 37(1):35-46.
Cracknell MJ, Reading AM (2014) Geological mapping using remote sensing data: A comparison of five machine learning algorithms, their response to variations in the spatial distribution of training data and the use of explicit spatial information. Computers and Geosciences 63:22-33. DOI: http://dx.doi.org/10.1016/j.cageo.2013.10.008
Delgado RC, Sediyama GC, Costa MH, Soares VP, Andrade RG (2012) Classificação espectral de área plantada com a cultura da cana-de-açúcar por meio da árvore de decisão. Engenharia Agrícola 32(2):369-380.
Duro DC, Franklin SE, Dubé MG (2012) A comparison of pixel-based and object-based image analysis with selected machine learning algorithms for the classification of agricultural landscapes using SPOT-5 HRG imagery. Remote Sensing of Environment 118:259-272.
Fayyad U, Piatetsky-Shapito G, Smyth P (1996) From data mining to knowledge discovery in databases. American Association for Artificial Intelligence Menlo Park 17(3):37-54.
Gleriani JM, Epiphanio JCN, Silva JDSda (2005) Classificação espectro-temporal de culturas agrícolas tropicais: tolerância de dois modelos de redes neurais a dados falhos. In: Simpósio Brasileiro de Sensoriamento Remoto. Goiânia, Instituto Nacional de Pesquisas Espaciais, Anais... Hall M, Frank E, Holmes G, Pfahringer B, Reutemann P, Witten IH (2009) The WEKA data mining software: An Update. SIGKDD Explorations 11(1):10-18. Available:
http://portal.acm.org/citation.cfm?doid=1656274.1656278%5Cnpapers2://publication/doi/10.1145/1 656274.1656278.
Hao P, Wang L, Niu Z (2015) Comparison of hybrid classifiers for crop classification using Normalized Difference Vegetation Index time series: a case study for major crops in North Xinjiang, China. PLoS ONE 10(9):e0137748.
Johann JÁ, Rocha JV, Oliveira SRdeM, Rodrigues LHA, Lamparelli RAC (2013) Data mining techniques for identification of spectrally homogeneous areas using NDVI temporal profiles of soybean crop. Engenharia Agrícola 33(3):511-524.
Körting T, Fonseca L, Castejon E, Namikawa L (2014) Improvements in sample selection methods for image classification. Remote Sensing 6(8):7580-7591. Available: http://www.mdpi.com/2072-4292/6/8/7580.
Körting TS, Garcia Fonseca LM, Câmara G (2013) GeoDMA—Geographic Data Mining Analyst. Computers & Geosciences 57:133-145. Available:
http://linkinghub.elsevier.com/retrieve/pii/S0098300413000538.
Liao SH, Chu PH, Hsiao PY (2012) Data mining techniques and applications - A decade review from 2000 to 2011. Expert Systems with Applications 39(12):11303-11311. Available:
http://dx.doi.org/10.1016/j.eswa.2012.02.063.
Maciel AM, Silva MPS, Escada MIS (2012) Mining frequent substructures from deforestation objects. In: IEEE International Geoscience and Remote Sensing Symposium. Anais... Available: http://ieeexplore.ieee.org/document/6352557/.
Maleky M, Razavi BS (2013) Evaluation of development and changes in land use using different satellite image processing and remote sensing techniques (case study: Kermanshah, Iran ). Research Journal of Environmental and Earth Sciences 5(10):567-576.
Mercante E, Lima LEPde, Justina DDD, Uribe-Opazo MA, Lamparelli RAC (2012) Detection of soybean planted areas through orbital images based on culture spectral dynamics. Engenharia Agrícola 32(5):920-931.
Messias CG (2012) Análise de uso do solo utilizando diferentes técnicas. Revista de Geografia 1:1-9.
Myint SW, Gober P, Brazel A, Grossman-Clarke S, Weng Q (2011) Per-pixel vs. object-based classification of urban land cover extraction using high spatial resolution imagery. Remote Sensing of Environment 115(5):1145–1161. DOI: http://dx.doi.org/10.1016/j.rse.2010.12.017
Nonato RT, Oliveira SRdeM (2013) Técnicas de mineração de dados para identificação de áreas com cana-de-açúcar em imagens Landsat 5. Engenharia Agrícola 33(6):1268-1280.
Panagos P, Meusburger K, Liedekerke MVan, Alewell C, Hiederer R, Montanarella L, Panagos P, Meusburger K, Liedekerke MVAN (2014) Assessing soil erosion in Europe based on data collected through a European network. Soil Science and Plant Nutrition 60(15-29).
Sanhouse-Garcia AJ, Rangel-Peraza JG, Bustos-Terrones Y, García-Ferrer A, Mesas-Carrascosa FJ (2016) Land use mapping from CBERS-2 images with open source tools by applying different classification algorithms. Physics and Chemistry of the Earth, Parts A/B/C 91:27-37.
Santos JA, Ferreira CD, Torres RDS, Gonalves MA, Lamparelli RAC (2011) A relevance feedback method based on genetic programming for classification of remote sensing images. Information Sciences 181(13):2671-2684. DOI: http://dx.doi.org/10.1016/j.ins.2010.02.003
Sarmiento CM, Ramirez GM, Coltri PP, Silva LFL, Nassur OAC, Soares JF (2014) Comparação de classificadores supervisionados na discriminação de áreas cafeeiras em Campos Gerais - Minas Gerais. Coffee Science 9(4):546-557.
Souza CHW, Mercante E, Johann JÁ, Lamparelli RAC, Uribe-Opazo MA (2015) Mapping and discrimination of soya bean and corn crops using spectro-temporal profiles of vegetation indices. International Journal of Remote Sensing 36(7):1809-1824.
Souza CM, Siqueira JV, Sales MH, Fonseca AV, Ribeiro JG, Numata I, Cochrane MA, Barber CP, Roberts DA, Barlow J (2013a) Ten-year Landsat classification of deforestation and forest
Souza CHWde, Mercante E, Prudente VHR, Justina DDD (2013b) Methods of performance evaluation for the supervised classification of satellite imagery in determining land cover classes. Ciencia e Investigación Agraria 40(2):419-428.
Thompso AF, Adetunmbi AO, Alese BK (2013) Land monitoring in Nigeria using geo-spatial data mining approach. Computing & Information Systems 17(1):23-28.
Vieira AM, Formaggio RA, Rennó DC, Atzberger C, Aguiar AD, Mello PM (2012) Object based image analysis and data mining applied to a remotely sensed Landsat time-series to map sugarcane over large areas. Remote Sensing of Environment 123:553-562.
DOI:http://dx.doi.org/10.1016/j.rse.2012.04.011
Wu X, Zhu X, Wu GQ, Ding W (2014) Data mining with big data. IEEE Transactions on Knowledge and Data Engineering 26(1):97-107. Available:
http://ieeexplore.ieee.org/lpdocs/epic03/wrapper.htm?arnumber=6547630.
Zhang J, Li P, Wang J (2014) Urban built-up area extraction from landsat TM/ETM+ images using spectral information and multivariate texture. Remote Sensing 6(8):7339-7359.