Short Communication
Risk analysis and probability of return on invested capital in an intensive
beef cattle production system in Minas Gerais, Brazil
Ronan Aparecido Valadares Santana1, Fabiano Alvim Barbosa2, Venício José de Andrade2, Patrícia Caires Molina3, Geraldo Helber Batista Maia Filho3, Juliana Mergh Leão3 1 Instituto Federal de Educação, Ciência e Tecnologia do Norte de Minas Gerais, Campus Arinos, Arinos, MG, Brazil.
2 Universidade Federal de Minas Gerais, Escola de Veterinária, Departamento de Zootecnia, Belo Horizonte, MG, Brazil.
3 Universidade Federal de Minas Gerais, Escola de Veterinária, Programa de Pós-graduação em Zootecnia, Belo Horizonte, MG, Brazil.
ABSTRACT - The study evaluated the average return on invested capital (ROIC) in function of the variations in the historical prices of beef cattle and the odds of return on that capital gain within the system of beef cattle fattening on a farm in the state of Minas Gerais, Brazil, from 2004 to 2007. To calculate the risk of ROIC, monthly data of beef cattle prices (BM&F) were used from July 1997 to December 2013, revised by the General Price Index of the Fundação Getúlio Vargas in December 2013. The corrected data were divided into five classes that correspond to the risk scenarios. In light of these classes, the observed frequencies and their respective probabilities were calculated. The cumulative and updated ROIC were –3.02 and 0.24%, respectively. The odds for obtaining returns above 8.4% (Brazilian Selic Rate) per year were median, corresponding to 32.0 and 34.94% for the calculation of operating profit (ROIC OP) and total profit (ROIC TP), respectively. The expected average annual return was 6.26 and 7.66% for ROIC OP and ROIC TP, respectively. The standard deviation and coefficient of variation showed a high risk of ROIC because the scale and extent of dispersion per unit of expected return were elevated in the accumulation period and the risk for 2013 was reduced according to the price of beef cattle. The expected risk of ROIC was considered high between 2004 and 2007 and average for 2013. The probability of return on capital invested in the intensification of fattening beef cattle is a function of the selling price of cattle and purchase of inputs, in which the high scenario ranching provides greater probability of getting a return above the bank interest rates.
Key Words: economic, profitability, rate of return
ISSN 1806-9290
www.sbz.org.br R. Bras. Zootec., 45(12):788-793, 2016
Received October 12, 2015 and accepted September 4, 2016. Corresponding author: [email protected] http://dx.doi.org/10.1590/S1806-92902016001200009
Copyright © 2016 Sociedade Brasileira de Zootecnia. This is an Open Access article distributed under the terms of the Creative Commons Attribution License (http://creativecommons.org/licenses/by/4.0/), which permits unrestricted use, distribution, and reproduction in any medium, provided the original work is properly cited.
Introduction
The variables risk and uncertainty have been widely used in economic theory, in that they are distinguished on the basis of knowledge about the likelihood of income or resource use occurring. Risk is characterized by situations that occur with known probability and uncertainty is characterized by situations in which the probability of occurrence of the phenomenon can not be anticipated. The risk is tridimensional: event (gain or loss), probability (usually undesirable event), and time (Ehrlich and Moraes, 2005).
White and Capper (2013) demonstrated that the improvement of production efficiency has also improved the environmental impact, but the impact on the economic
viability and social acceptance are highly dependent on behavioral responses of consumers and producers to improve this efficiency, these being characterized as sources of risk. Dubeux Junior et al. (2011) reported that integrated nutrient management strategies (pasture management and nutritional supplementation), environmental services, and marketing products and services are necessary to increase productivity per unit of area in Brazilian biomes.
Some sources of risk, such as climate instability and emergence of pests, for example, are those of agribusiness. Other types of risk, such as market or institutional risk, despite being also present in the business environment, display distinct amounts and important characteristics within the context of agribusiness. Due to the variety of types and sources of risk in agribusiness and the inherent particularities in each type of farmer, no management strategy is common to all producers. Producers face different types of risk and require different tools for their management (USDA, 2007).
increasingly called upon to quantify the risks inherent in their negotiations, and this requires better indicator analysis (Correia Neto, 2007).
Risk can be calculated by the probability of events based on objective or subjective data. The objective probability exists from past experience about the studied event and when there is a possibility of extrapolation of this behavior. In future behavior situations, there will be an expected situation for the variable and a probability of non-occurrence of that expectation. In situations of subjective probability, without a historical series that can be extrapolated to the future periods, the calculation of probabilities of occurrence of the results should be measured (Correia Neto, 2007).
The objective of this study was to calculate the average return on invested capital (ROIC) due to the variation in historical long-term prices of cattle as well as the probabilities of return of this capital on the profit in the activity of intensive cattle fattening system.
Material and Methods
The data were collected from a beef farm located in Sete Lagoas, Minas Gerais, Brazil. The farm system adopted include the backgrounding and finishing/feedlotting phases. The Bos indicus Nelore breed cattle were kept on pasture in the rainy season and in the feedlot in the dry season. This system was used as a strategy to reduce the time to reach slaughter and to improve productivity. The total farm area was 165 ha. The size of fertilized pastures was 108 ha. The species used were Brachiaria sp. and
Panicum sp. The pasture system was paddocks with rotational grazing divided by electric fence. The sugarcane area was 19 ha. The total forage used in feedlot was
sugarcane. The facility livestock area was 2 ha. The total environmental protection area was 36 ha. The livestock was slaughtered in a commercial company and sold to the national consumer market.
The concept of animal unit (AU) was utilized as one mature animal (1,000 lb (450 kg) or equivalent) to compare the animal production. The case study methodology used was described by Yin (1984). The data of productivity and cost were monthly collected from January 2004 to October 2007. The data were collected, released, and analyzed in Microsoft Excel spreadsheet fomat. The values were updated to 2013 by an update factor: (item market price in 2013 - average of item price between 2004 and 2007)/ (average of item price between 2004 and 2007 × 100). The most important items in production cost and income were updated as feed, fertilizer, labor, fuel, and wholesale beef price.
The total operating cost (TOC), the total cost (TC), and the economic analysis were calculated using the methodology of Barbosa et al. (2010). The operating profit (OP = total revenue – TOC) and the total profit (TP = total revenue – TC) were calculated to compare the performance of the production system. The ROIC was obtained by the formula: ROIC = profit / invested capital in the activity and was evaluated by the OP and TP (with opportunity cost).
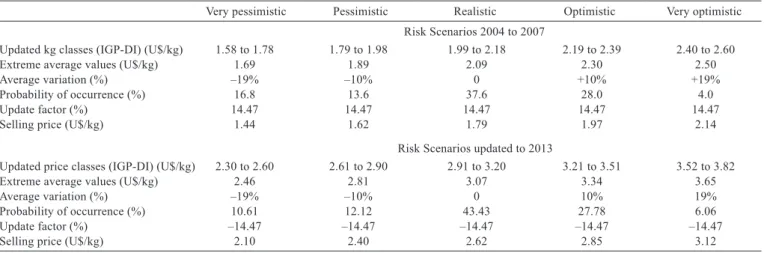
To calculate the risk of ROIC, we used data representing the monthly average price of live cattle in the long term BM&F, from July 1997 to December 2013 (ESALQ/ CEPEA, 2014). The sold price was converted from price per arroba (@) to price per kg (1 @ = 15 kg). The values were also updated by the General Price Index (IGP-DI) of the Fundação Getúlio Vargas to December 2013 (FGV, 2014). The updated data were divided into five price classes. The variations correspond to the risk of scenarios.
Very pessimistic Pessimistic Realistic Optimistic Very optimistic Risk Scenarios 2004 to 2007
Updated kg classes (IGP-DI) (U$/kg) 1.58 to 1.78 1.79 to 1.98 1.99 to 2.18 2.19 to 2.39 2.40 to 2.60 Extreme average values (U$/kg) 1.69 1.89 2.09 2.30 2.50
Average variation (%) –19% –10% 0 +10% +19%
Probability of occurrence (%) 16.8 13.6 37.6 28.0 4.0
Update factor (%) 14.47 14.47 14.47 14.47 14.47
Selling price (U$/kg) 1.44 1.62 1.79 1.97 2.14
Risk Scenarios updated to 2013
Updated price classes (IGP-DI) (U$/kg) 2.30 to 2.60 2.61 to 2.90 2.91 to 3.20 3.21 to 3.51 3.52 to 3.82 Extreme average values (U$/kg) 2.46 2.81 3.07 3.34 3.65
Average variation (%) –19% –10% 0 10% 19%
Probability of occurrence (%) 10.61 12.12 43.43 27.78 6.06
Update factor (%) –14.47 –14.47 –14.47 –14.47 –14.47
Selling price (U$/kg) 2.10 2.40 2.62 2.85 3.12
These classes were created using the observed frequencies and their respective probabilities (Table 1). The average was calculated between maximum and minimum prices of each class, considering the pessimistic scenario as the base.
The average farm price (kg) from 2004 to 2007 was 14.47% cheaper than the BM&F, U$23.81 and U$27.87, respectively. Therefore, the estimated values of sales were updated with a discount of 14.47% to be closer to the local farm prices. The risk analysis of ROIC was obtained by the methodology of Correia Neto (2007), calculated from the updated values.
All values were converted from Brazilian reais (R$) to American dollars (U$). The value used to convert was U$1.00 = R$2.28.
Results and Discussion
Brazil has a large availability of grain to improve intensive production in feedlot or supplemental use. These techniques may be used to reduce the total land necessary to produce, decrease deforestation, and lower greenhouse gas emission. The opposite point was described by Aby et al. (2012a): in the future, production conditions for beef cattle may become increasingly extensive due to human population growth, climate change, and competition for resources, which may limit the amount of concentrates available for beef production. However, according to Aby et al. (2012b), the production system and choice of breed are often linked; continental breeds are more usually found in intensive production systems compared with British breeds.
The productivity data (kg/ha/year) in fertilized pasture varied according to the year and stocking rate, with values between 258 and 693.8 kg/ha/year and payloads between 2.4 and 3.8 AU/ha in the wet season and dry-water transition. The values found were higher than the results in degraded pastures, formed without correction or fertilization, or corrected and fertilized only in the year of training, which shows the need for annual maintenance
fertilization of pastures with stocking rate above 2.0 AU per hectare to maintain adequate levels of productivity, as mentioned by Barbosa and Souza (2007).
The increased production in kg of live weight varied between 588 and 1,061 kg/ha/year, because this productivity was achieved by the use of pasture fertilized in waters and the strategy of containment, allowing high stocking rates per unit area (Table 2). The selling rate showed higher values (77.53%) than the national average of 22.2% (Informa Economics FNP, 2012), indicating the intensification of this production system.
The farm total cost between 2004 and 2007 was U$1,382,689.46. The representation was higher for animals (64.61%), dietary supplements (12.33%), and depreciation (5.22%). The intensive nature of the production system shows that the depreciation of machinery, improvements, pastures, and crops accounted for 5.22% of the total cost, i.e., a small percentage when compared with the cow-calf farms and whole production farms, being 28.1%, 27.1%, and 18.8%, 20.1% for the following systems: cow-calf farms with animals from crossbreeding (Zebu vs Angus) and Zebu breed, whole production farm of animals from crossbreeding (Zebu vs Angus), and Zebu breed, respectively (Santana et al. 2013).
According to Lopes and Magalhães (2005), the animal cost of purchase represents 66.57% of the total cost in feedlot. The feeding cost (grain, meal, forage, and minerals) represents 30.25% of the total cost. The conclusion was that the farmer should pay special attention to the animal cost of purchase. The small savings can improve the total profit. For this, the farmer needs special attention to quality. The farmer needs to buy high-quality animals, however with a bit smaller price. This represents an important reduction in the total cost and improvements on the profit.
The average total cost between 2004 and 2007 was U$2.72/kg. This value is higher when compared with the average price (U$1.59/kg). The higher values were found by Retallick et al. (2013), who worked with crossbreeding Angus in feedlots in the United States. The total cost per arroba was U$2.22/kg. Lopes et al. (2007) related a total
2004 2005 2006 20071 Annual average
Amount of animals 1,104 1,327 1,354 1,068 1,213
AU/hectare/year - average 4.31 3.62 3.48 3.20 3.65
Sold animals 777 900 975 1,067 930
Animals slaughtered 734 596 829 907 767
Animal production (kg per hectare) 1,061 964 629 588 703
Sale (%) 70.4 67.8 72.0 99.9 77.53
Table 2 - Production indicators on a bovine intensive fattening farm in the central region of Minas Gerais State, Brazil
1 January to October.
cost/kg of U$1.640 and the average selling price was U$1.644/kg.
The total improvement was sufficient to cover the payments and depreciations, obtaining a total operating profit of U$44,038.26, showing that the activity was able to pay all operating costs; however, it could not fully compensate the opportunity cost of staying with a loss of –U$58,347.32 for the total profit. The overall ROIC was a negative 3.02%; however, when considering the asset valuation as a result, the total economic ROIC became equal to 6.09% (Table 3).
These results indicate that the model of the intensification of the fattening system adopted from 2004 to 2007 was not able to totally remunerate the invested capital, getting a negative total ROIC, proving to be an activity that requires high investments with high risks. The asset valuation activity shall be a positive ROIC, however, with lower incomes compared with saving rates. By analyzing the activity without the opportunity cost, the intensive production system achieved a total operating profit average (net margin) of U$44,038.26/year, with a ROIC (including asset variation) of 2.41% per year (Table 3), which means that the income paid all operating costs, including depreciation.
Bowman et al. (2012) evaluated the activity of beef cattle in the Amazon biome with a capacity of 1 AU/ha and selling rate of 14.4% and obtained low economic returns. One of the strategies to reverse this situation is to enhance the system to increase the productivity and prevent deforestation.
Analysis of the data set for 2013 reveals that the total projected revenue is greater than the total cost, i.e., it pays
all costs, including the opportunity ones (Table 3). This can be justified by the higher value of the cattle in the livestock cycle that occurred after 2009, while the period 2004-2007 was characterized by a low livestock cycle with devaluation and high disposal matrices.
The calculated annual returns between 2004 and 2007, due to the variation in historical sale prices of cattle, showed that the odds of ROIC on operating profit (ROIC OP) staying positive were 83.2% and ROIC over total profit (ROIC TP) staying positive were 69.6% (Figure 1).
The calculated annual return, adjusted for 2013, due to the variation in historical sale prices of cattle, showed that the odds of ROIC OP and ROIC TPstaying positive were 88.71%. The odds of obtaining returns above the official Brazilian Selic rate (8.4% per year in 2013) are median, corresponding to 32 and 34.94% for 2004-2007 and 2013, respectively (Figure 1). This increased probability of a positive return is due to the high arroba cycle for cattle.
The difference between the scenarios presented in the period 2004-2007 compared with those adjusted for 2013 shows the importance of the sale prices for beef cattle (Figure 1). Another factor influencing this result is that the earlier period, 2004-2007, was in the down cycle of beef cattle, while in 2013, the trend was high.
The expected average returns due to the variation in historical selling prices of the arroba of cattle were 6.26 and 3.33% per year for ROIC OP and ROIC TP, respectively, for the period 2004-2007. This return increased when the values were adjusted for 2013, and values of 7.66 and 5.66% per year were found for ROIC OP and ROIC TP, respectively (Table 4).
2004 2005 2006 2007 Accumulated Updated to 2013
U$ U$ U$ U$ U$ U$
Operating cost
Variable 350,880.72 386,051.13 404,616.90 340,089.01 1,186,693.43 2,104,325.65 Fixed 23,567.69 23,405.83 23,529.02 23,107.90 93,610.45 108,282.25 Total 374,448.41 409,456.96 428,145.92 363,196.91 1,280,303.88 2,212,607.90 Total income 411,110.70 392,350.60 439,877.18 375,947.99 1,324,342.14 2,343,820.71 Gross margin 60,229.98 6,299.46 35,260.28 35,858.98 137,648.71 239,495.05 Total OP 36,662.29 –17,106.37 11,731.26 12,751.07 44,038.26 131,212.80 Asset 437,222.76 482,957.08 446,726.49 434,430.40 612,976.42 1,010,465.27
ROIC OP (%) 4.61 –2.18 1.56 1.87 2.41 4.16
Opportunity cost 27,255.82 26,625.45 25,503.06 23,001.25 56,693.47 123,504.76 Total cost 401,704.24 436,082.41 453,648.98 386,198.16 1,336,842.52 2,336,112.67 Asset variation (AV) 45,734.76 –36,230.59 –12,296.09 178,546.02 175,753.66 315,126.31 Total profit 9,406.46 –43,731.82 –13,771.80 –10,250.18 –58,347.32 7,708.04
ROIC without AV (%) 1.18 –5.57 –1.83 –1.50 –3.02 0.24
ROIC with AV (%) 6.71 –9.84 –3.35 23.89 6.09 9.84
Table 3 - Economic analysis of intensive bovine fattening on a farm in the central region of Minas Gerais State, Brazil
Analyzing the standard deviation and coefficient of variation, we found a high risk of ROIC, because the scale and the degree of dispersion per unit of expected return were higher in the period 2004-2007; however, to adjust prices to 2013, there was a reduction in the risk evidenced by the reduction of standard deviation and coefficient of variation (Table 4).
Conclusions
The probability of return on capital invested in the intensification of fattening beef cattle is a function of the selling price of cattle and purchase of inputs, in which the high scenario ranching provides greater probability of getting a return above the bank interest rates.
References
Aby, B. A.; Aass, L.; Sehested, E. and Vangen, O. 2012a. A bio-economic model for calculating bio-economic values of traits for
intensive and extensive beef cattle breeds. Livestock Science 143:259-269.
Aby, B. A.; Aass, L.; Sehested, E. and Vangen, O. 2012b. Effects of changes in external production conditions on economic values of traits in Continental and British beef cattle breeds. Livestock Science 150:80-93.
Barbosa, F. A.; Graça, D. S.; Andrade, V. J.; Cezar, I. M.; Santos, G. G. and Souza, R. C. 2010. Produtividade e eficiência econômica de sistemas de produção de cria, recria e engorda de bovinos de corte na região sul do estado da Bahia. Arquivo Brasileiro de Medicina Veterinária e Zootecnia 62:677-685.
Barbosa, F. A. and Souza, R. C. 2007. Administração de fazendas de bovinos – leite e corte. Aprenda Fácil, Viçosa, MG.
Bowman, M. S.; Soares-Filho, B. S.; Merry, F. D.; Nepstad, D. C.; Rodrigues, H. and Almeida, O. T. 2012. Persistence of cattle ranching in the Brazilian Amazon: A spatial analysis of the rationale for beef production. Land Use Policy 29:558-568. Correia Neto, J. F. 2007. Excel para profissionais de finanças: manual
prático. Elsevier, Rio de Janeiro.
Dubeux Júnior, J. C. B.; Muir, J. P.; Santos, M. V. F.; Vendramini, J. M. B.; Mello, A. C. L. and Lira, M. A. 2011. Improving grassland productivity in the face of economic, social, and environmental challenges. Revista Brasileira de Zootecnia 40:280-290.
ROIC OP
2004-2007 2004-2007ROIC TP ROIC OP2013 ROIC TP2013
Average expected return (per year) 6.26% 3.33% 7.66% 5.66%
Standard deviation 7.07% 6.41% 4.29% 4.29%
Coefficient of variation 1.13 1.92 0.56 0.76
Table 4 - Average expected return, standard deviation, and coefficient of variation of ROIC on the operating profit (ROIC OP) and total profit (ROIC TP) on a bovine intensive fattening farm in the central region of Minas Gerais State, Brazil
ROIC - return on invested capital.
Ehrlich, P. J. and Moraes, E. A. 2005. Engenharia econômica: avaliação e seleção de projetos de investimento. 6.ed. Atlas, São Paulo.
ESALQ/CEPEA. 2014. Indicador de preços do boi gordo ESALQ/ BM&F – Séries de Preços. Available at: <http://www.cepea.esalq. usp.br/xls/SBOI.XLS>. Accessed on: Mar. 3, 2014.
FGV - Fundação Getúlio Vargas. 2014. Séries Históricas IGP-DI. Available at: <http://www.fgvdados.fgv.br/>. Accessed on: Mar. 5, 2014.
Informa Economics FNP. 2012. Anuário da pecuária brasileira, ANUALPEC 2012. São Paulo.
Lopes, M. A. and Magalhães, G. P. 2005. Rentabilidade na terminação de bovinos de corte em confinamento: um estudo de caso em 2003, na região oeste de Minas Gerais. Ciência e Agrotecnologia 29:1039-1044.
Lopes M. A.; Santos. G.; Magalhães, G. P. and Carvalho, F. M. 2007. Efeito da escala de produção na rentabilidade da terminação de bovinos de corte em confinamento. Ciência e Agrotecnologia 31:212-217.
Retallick, K. M.; Faulkner, D. B.; Rodriguez-Zas, S. L.; Nkrumah J. D. and Shike, D. W.2013. Relationship among performance, carcass, and feed efficiency characteristics, and their ability to predict economic value in the feedlot. Journal of Animal Science 91:5954-5961.
Santana, R. A. V.; Barbosa, F. A.; Mandarino, R. A. and Lobo, C. F. 2013. Desempenho bioeconômico de sistemas intensivos de cria e de ciclo completo por meio de simulação. Arquivo Brasileiro de Medicina Veterinária e Zootecnia65:1773-1782.
USDA. Risk management. United States Department of Agriculture. 2007. Farm Bill Theme Papers, 2007. Available at: <http://www. usda.gov/documents/Farmbill07riskmgmtrev.pdf>. Accessed on: Feb. 27, 2014.
White, R. R. and Capper, J. L. 2013. An environmental, economic, and social assessment of improving cattle finishing weight or average daily gain within U.S. beef production. Journal of Animal Science 91:5801-5812.