Performance
Mail Address
Keywords Author(s)
Arrived: March/2009 Approved: December/2009
ABSTRACT
An experiment was carried out at the Department of Animal Science of the Federal University of Viçosa, Brazil, to evaluate the effects of different nutritional plans on the performance of male and female Ross broilers. A completely randomized experimental design with a 6x2 factorial arrangement (six nutritional plans x two sexes) with six replicates of 20 birds per experimental unit was applied. The nutritional plans adopted for males and females included 3, 5, or 28 feeds, and the other 3 plans included 28 feeds containing 92.5, 100, and 107.5% of digestible lysine requirements established according to a mathematical model developed exclusively for Ross broilers. The results showed that the tested 28-feed feeding programs are equivalent, and allow similar performance as compared to 3- and 5-feed feeding programs. Based on the lysine levels included in the different nutritional plans, it was possible to fit the equations: Y = -0.0079x + 1.2435 (R2
= 0.981) for males and Y = -0.0084x + 1.1925 (R2
= 0.978) for females, where "Y" is digestible lysine level (%) and "x" is average age in days. These equations are specific for multiple-phase feeding programs. The performance of male and female broilers fed the lysine levels established by the mathematical models was similar as to that of birds fed the other nutritional plans. This demonstrates that it is possible to determine broiler lysine
INTRODUCTION
Broiler nutritional requirements are traditionally established using experiments, where a limiting nutrient is added to the feed, whereas all other nutrients are maintained in adequate levels. The level of the studied nutrient that maximizes growth rate or feed conversion ratio is then considered its requirement for a determined rearing phase. However, this level represents the average requirement for that phase, which means that broilers are fed suboptimal levels of that nutrient in the beginning of the rearing phase, whereas they are overfed at the end. Specifically in terms of amino acids, the initial deficiency prevents maximum protein accretion, and the excess at the end of the rearing phase results in nutrient waste and generates additional calorie expenditure in order to excrete amino acids in the urine. One solution for this problem is the adoption of a higher number of diets during the bird's lifetime, decreasing the differences between nutrient requirement and supply, resulting in higher protein deposition, lower use of amino acids during the different feeding phases, as well as lower nitrogen excretion, which is considered an important environmental pollution problem today.
Typical feeding programs for broilers include 3 to 5 diets, but these are not able to allow the maximum expression of the bird's genetic
Buteri CB1 Tavernari F de C2 Lelis GR2 Rostagno HS3 Albino LFT3
1
Escola Agrotécnica Federal de Salinas. 2
Pós-graduação em Zootecnia - UFV. 3
Departamento de Zootecnia - UFV.
F de C Tavernari
potential brought by genetic improvement. In order to ensure proper bird development, daily feeding programs would be recommended; however, this is still unfeasible under commercial conditions. Perhaps in the future, new technologies allowing multiple feeding programs will be created.
There are several research studies on broiler multiple-phase feeding programs, where feeds were changed every two to seven days. The authors of those studies concluded that these programs do not impair bird performance or carcass traits, and allow significant reduction of feed cost (Warren & Emmert, 2000; Pope & Emmert, 2001, and Pope et al., 2001).
When formulating diets for multiple-phase feeding programs, researchers have developed mathematical models based on nutritional requirements determined in experiments (Emmert & Baker, 1997 and Rostagno
et al., 2000) or in growth or protein-deposition curves
(Ivey, 1999).
The aim of the present experiment was to evaluate the effects of different nutritional plans on the performance of male and female broilers during the starter, grower, and finisher phase; to validate digestible lysine requirements established by mathematical models for male and female Ross broilers; and to evaluate the possibility of formulating 28 diets by diluting 2 different diets.
MATERIAL AND METHODS
The experiment was carried out in the experimental poultry house of the Department of Animal Science of the Federal University of Viçosa, Brazil. A number of 1440 one-day-old Ross chicks, half males and half females, with average initial weight of 43.1 g and 43.8 g, respectively, was used.
A completely randomized experimental design was applied. Treatments consisted of the nested effects of six nutritional plans within sex, with six replicates of 20 birds per experimental unit.
Birds were housed in an open-sided masonry poultry house divided into 72 pens (1.0 x 2.0 m). The poultry house was 3-m high, covered with asbestos tiles, and had concrete floor, sides with a 0.40-m wall and wire mesh, and an exhaustion chimney and plastic curtains to control temperature and drafts. Wood shavings were used as litter material.
Drinkers, feeders, curtains, and birds were managed according to the recommendations of Ross broilers management manual (Agroceres, 2000). Feed and water were offered ad libitum during the entire experimental period.
Table 1 shows the weekly average temperature and humidity in the poultry house during the experimental period.
Male and female broiler digestible lysine requirements were estimated by a mathematical model developed according to the following steps: (1) a body growth curve and a daily weight gain curve (Gompertz equation) were built based on the data presented in the genetic line manual (Agroceres, 2000). The equation parameters were determined using the Gauss-Newton procedure of the SAEG software (UFV, 1999) and are presented in Table 2.
Table 2 - Gompertz equation parameters fit for male and females Ross broiler body weight.
Parameters1
Males Females
A 6893.2 4694.0
B 0.0370 0.0409
C 42.1 36.4
R2
1.000 1.000
1
A = mature body weight (g); B = maximum growth rate (g/day per g); C = age at maximum growth rate (days).
Table 1 - Maximum, minimum, and average temperature and humidity inside the poultry house during the experimental period.
Period (days) Temperature (°C) Humidity (%)
Max. Min. Average Max. Min. Average
01 - 07 32.6 26.0 29.3 76.38 62.82 69.60
08 - 14 30.0 24.9 27.5 79.86 59.71 69.79
15 - 21 28.6 24.5 26.5 82.00 64.14 73.07
22 - 28 28.4 20.8 24.6 88.57 61.14 74.86
29 - 35 28.7 22.4 25.5 91.00 67.29 79.14
36 - 42 29.9 20.0 24.9 91.86 54.29 73.07
43 - 49 30.9 20.2 25.6 94.43 48.71 71.57
50 - 56 31.4 19.9 25.7 95.14 51.86 73.50
Table 3 - Gompertz equation parameters fit for male and fe-males Ross broiler protein deposition.
Parameters1
Males Females
A 1536.4 1165.4
B 0.0413 0.0403
C 40.8 38.8
R2
1.000 1.000
1
A = mature protein content (g); B = maximum rate of protein deposition (g/day per g); C = age at maximum protein gain (days).
(3) In order to determine daily digestible lysine requirement, the adapted equation of Dritz et al. (1997)
was used, and maintenance lysine requirements, efficiency of lysine deposition, and lysine percentage in bird body protein used the values established by Edwards et al. (1999) associated to the data of the curves determined in steps 1 and 2.
DLR = Rm + (PrG x LTP / EDL)
where: DLR = digestible lysine requirement (g/bird/ day); Rm = maintenance lysine requirement (g) (6.9 mg/ day/kg3/4
); PrG = daily protein gain (g) (Gompertz equation, step 2); LTP: % of lysine in body protein (6.70 %); EDL: efficiency of digestible lysine deposition (79.3 %)
(4) Determination of daily feed intake based on data of the genetic line manual (Agroceres, 2000) corrected by a factor based on the studies of Barboza (1998) and Costa (2000).
CF = - 0.001t + 1.0742
where, CF = correction factor (value to which the feed intake presented in the manual is multiplied); t = bird age in days.
(5) By relating the daily requirements established in step 3 to the daily feed intake calculated in step 4, equations that allowed estimating digestible lysine requirements, expressed in %, for male and female Ross broilers were established. The equations are presented below:
Males: Y = - 0.0115X + 1.4454; Females: Y = - 0.0124X + 1.4047;
where, Y = digestible lysine requirements (%); X = age in days.
(6) Considering that the remaining amino acids are
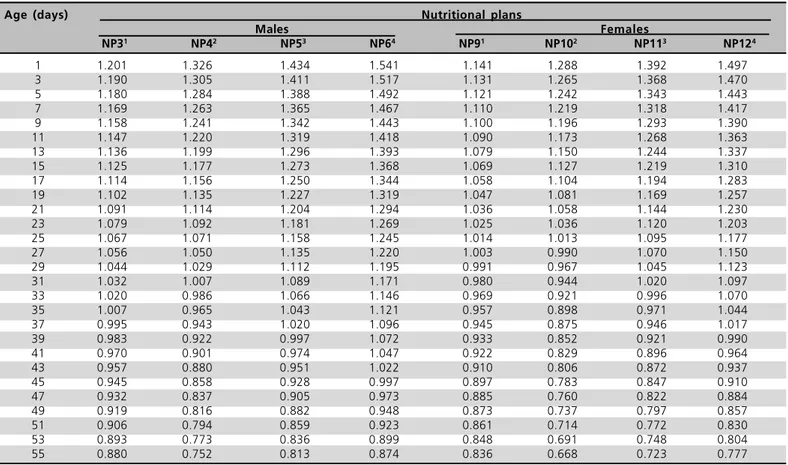
The experimental feeds of nutritional plans 1, 2, and 3 for males and 7, 8, and 9 for females were formulated to supply the digestible lysine requirements determined by Rostagno et al. (2000). The feeds of nutritional plans
4, 5, and 6 for males and 10, 11, and 12 for females contained, respectively, 92.5, 100, and 107.5% of the digestible lysine requirements established by mathematical models fit exclusively for Ross broilers. Digestible lysine requirements for the nutritional plans 3, 4, 5, and 6 for males and 9, 10, 11, and 12 for females are presented in Table 5.
The remaining nutrients were added to diets according to the recommendations of Rostagno et al.
(2000), and the following amino acid:digestible lysine ratios adopted in all nutritional programs were: digestible methionine + cystine 71%; digestible threonine 67%; digestible arginine 110%; digestible tryptophan 17%; and total glycine + serine 183.8%.
The 28-feed nutritional plan used the technique of dilution, i.e., diets were formulated according to the requirements of one-day-old and 55-day-old birds, and the other feeds were obtained by mixing different proportions of the formulated diets.
The nutritional values of the experimental diets, based on corn and soybean meal, are presented in Tables 6, 7, and 8.
added to the feed on lysine basis, their requirements were also estimated for the different bird ages.
The nutritional plans used during the entire experimental period are described in Table 4.
Table 4 - Nutritional plans (NP) used during the experimental period as a function of sex.
Nutritional Plan Males
NP1 3 feeds (1-21 d; 22-42 d; e 43-56 d)1
NP2 5 feeds (1-8 d; 9-21 d; 22-33 d; 34-42 d; e 43-56 d)1
NP3 28 feeds (one every 2 days)2
NP4 28 feeds (one every 2 days)3
NP5 28 feeds (one every 2 days)4
NP6 28 feeds (one every 2 days)5
Females
NP7 3 feeds (1-21 d; 22-42 d; e 43-56 d)1
NP8 5 feeds (1-8 d; 9-21 d; 22-33 d; 34-42 d; e 43-56 d)1
NP9 28 feeds (one every 2 days)2
NP10 28 feeds (one every 2 days)3
NP11 28 feeds (one every 2 days)4
NP12 28 feeds (one every 2 days)5
1
Nutritional levels according to Rostagno et al. (2000). 2
Estimated nutritional levels based on the equations established by Rostagno et al. (2000). 392.5% digestible lysine level established by mathematical
models. 4100% digestible lysine level established by mathematical models. 5
For the analyses of variance of the periods 22 to 42 and 22 to 56 days, weight at 21 days was used as covariate, whereas weight at 42 days was used for the period of 43 to 56 days of age.
The parameters were statistically analyzed using the SAEG software package (UFV, 1999). Means were compared by the Student-Newman-Keuls test at 5% significance level.
RESULTS AND DISCUSSION
Tables 9 and 10 show the results of the performance 1- to 21-day-old male and female broilers, respectively, as a function of nutritional plan.
The tested nutritional plans significantly influenced male and female feed intake and feed conversion ratio, but did not affect their weight gain or livability.
In males, the feed intake promoted by nutritional plan NP2 was higher as compared to NP4 and NP5, and was similar to NP1, NP3, and NP6. NP3 and NP6 nutritional plans resulted in better feed conversion ratio than NP1 and NP2, but these four plans were not different from NP4 or NP5.
Table 6 - Nutritional values of male (NP1) and female (NP7)
feeds for 3 nutritional plans.
SF* GF* FF*
NP1
Protein, % 21.999 20.000 18.000
ME (kcal/kg) 3000 3100 3200
Digestible lysine, % 1.148 1.024 0.917
NP7
Protein, % 22.000 19.000 17.000
ME (kcal/kg) 3000 3100 3200
Digestible lysine, % 1.091 0.972 0.871
*SF: starter feed (1-21 days); GF: grower feed (22-42 days); and FF: finisher feed (43-56 days).
The following parameters were evaluated: weight gain, feed intake, feed conversion ratio, and mortality. At 42 and 56 days of age, production factor was also evaluated.
The equation used to determine the production factor (PF) was:
PF = (((WG/A)*L)/FCR)*100
where, WG = weight gain (Kg); A = age (days); L = livability (%); FCR = feed conversion ratio.
Table 5 - Digestible lysine requirements (%) as a function of bird age and nutritional plan.
Age (days) Nutritional plans
Males Females
NP31
NP42
NP53
NP64
NP91
NP102
NP113
NP124
1 1.201 1.326 1.434 1.541 1.141 1.288 1.392 1.497
3 1.190 1.305 1.411 1.517 1.131 1.265 1.368 1.470
5 1.180 1.284 1.388 1.492 1.121 1.242 1.343 1.443
7 1.169 1.263 1.365 1.467 1.110 1.219 1.318 1.417
9 1.158 1.241 1.342 1.443 1.100 1.196 1.293 1.390
11 1.147 1.220 1.319 1.418 1.090 1.173 1.268 1.363
13 1.136 1.199 1.296 1.393 1.079 1.150 1.244 1.337
15 1.125 1.177 1.273 1.368 1.069 1.127 1.219 1.310
17 1.114 1.156 1.250 1.344 1.058 1.104 1.194 1.283
19 1.102 1.135 1.227 1.319 1.047 1.081 1.169 1.257
21 1.091 1.114 1.204 1.294 1.036 1.058 1.144 1.230
23 1.079 1.092 1.181 1.269 1.025 1.036 1.120 1.203
25 1.067 1.071 1.158 1.245 1.014 1.013 1.095 1.177
27 1.056 1.050 1.135 1.220 1.003 0.990 1.070 1.150
29 1.044 1.029 1.112 1.195 0.991 0.967 1.045 1.123
31 1.032 1.007 1.089 1.171 0.980 0.944 1.020 1.097
33 1.020 0.986 1.066 1.146 0.969 0.921 0.996 1.070
35 1.007 0.965 1.043 1.121 0.957 0.898 0.971 1.044
37 0.995 0.943 1.020 1.096 0.945 0.875 0.946 1.017
39 0.983 0.922 0.997 1.072 0.933 0.852 0.921 0.990
41 0.970 0.901 0.974 1.047 0.922 0.829 0.896 0.964
43 0.957 0.880 0.951 1.022 0.910 0.806 0.872 0.937
45 0.945 0.858 0.928 0.997 0.897 0.783 0.847 0.910
47 0.932 0.837 0.905 0.973 0.885 0.760 0.822 0.884
49 0.919 0.816 0.882 0.948 0.873 0.737 0.797 0.857
51 0.906 0.794 0.859 0.923 0.861 0.714 0.772 0.830
53 0.893 0.773 0.836 0.899 0.848 0.691 0.748 0.804
55 0.880 0.752 0.813 0.874 0.836 0.668 0.723 0.777
1
Estimated nutritional levels based on the equations established by Rostagno et al. (2000). 2
Table 7 - Nutritional values of male (NP2) and female (NP8) feeds for 5 nutritional plans.
PSF* SF* GF1* GF2* FF*
NP2
Protein, % 22.800 21.700 20.346 19.258 18.067
ME (kcal/kg) 2950 3010 3075 3100 3175
Digestible lysine, % 1.181 1.126 1.050 0.977 0.909
NP8
Protein, % 22.800 21.700 19.768 18.400 16.901
ME (kcal/kg) 2950 3010 3075 3100 3175
Digestible lysine, % 1.122 1.069 0.997 0.928 0.864
*PSF: pre-starter feed (1-8 days); SF: starter feed (9-21 days); GF1: grower feed 1 (22-33 days); GF2: grower feed 2 (34-42 days); and FF: finisher feed (43-56 days).
Table 8 - Nutritional values of males (NP3, NP4, NP5, and NP6)
female (NP9, NP10, NP11, and NP12) feeds for 28 nutritional plans.
F 1D* F 55D* F 1D* F 55D*
NP3 NP4
Protein, % 23.091 17.497 23.325 17.497
ME (kcal/kg) 2946 3226 2946 3226
Digestible lysine, % 1.205 0.884 1.326 0.788
NP5 NP6
Protein, % 23.527 17.497 23.729 17.497
ME (kcal/kg) 2946 3226 2946 3226
Digestible lysine, % 1.434 0.813 1.541 0.874
NP9 NP10
Protein, % 23.090 16.200 23.091 16.200
ME (kcal/kg) 2946 3226 2946 3226
Digestible lysine, % 1.145 0.839 1.288 0.704
NP11 NP12
Protein, % 23.544 16.200 23.741 16.200
ME (kcal/kg) 2946 3226 2946 3226
Digestible lysine, % 1.392 0.723 1.497 0.777
*F 1D: feed formulated to supply the requirements of 1-day-old birds; F 55D: feed formulated to supply the requirements of 55-day-old birds.
In females, feed intake and feed conversion ratio of birds fed NP7 and NP8 were not different, but presented higher values as compared to the other treatments (NP9, NP10, NP11, NP12), which presented similar values.
The results clearly show that the nutritional plans that included a lower number of diets, such as NP1 and NP2 for males, and NP7 and NP8 for females, presented the worst match between requirement and supply. This is demonstrated by the higher feed intake to ensure adequate nutrient ingestion because theses birds receive suboptimal nutrient levels during the second half of the evaluated phase. This is also evident when the results of NP1 and NP2 are compared to those obtained with NP3 and NP9, where, despite containing similar digestible lysine level, resulted in different feed intake.
As there was no difference in weight gain among the different plans, the higher feed intake led to worse feed conversion ratio in the plans that included a lower number of diets. The multiple-phase feeding programs proved to be more efficient in ensuring a better nutrient utilization. These results are consistent with those observed by Warren & Emmert (2000) for weight gain; however, they disagree in terms of feed intake and feed conversion ratio.
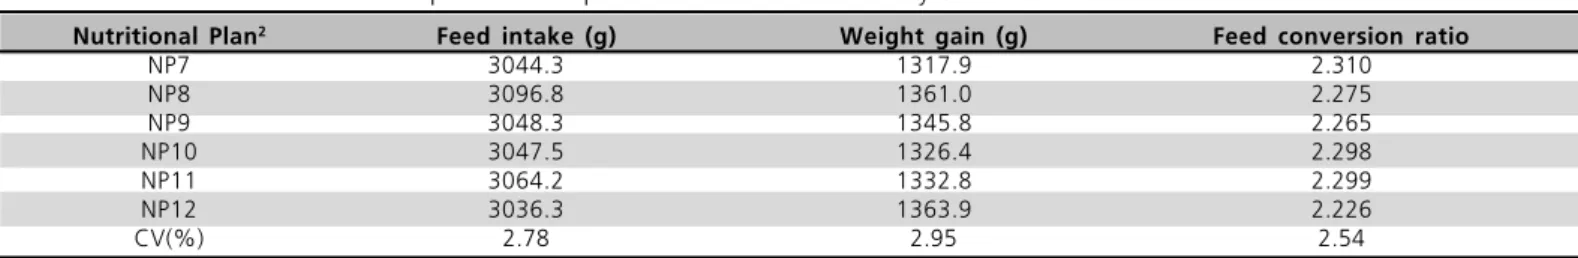
Tables 11 and 12 show the results of the performance 22- to 42-day-old male and female broilers, respectively, as a function of nutritional plan. There was no significant effect of the tested nutritional plans on male and female weight gain, feed
Table 9 - Effect of the nutritional plans on the performance of 1- to 21-day-old male Ross broilers1.
Nutritional Plan2 Feed intake (g) Weight gain (g) Feed conversion ratio Livability(%)
NP1 1222.7 ab 789.9 1.548 b 97.50
NP2 1266.7 a 820.9 1.543 b 98.33
NP3 1221.4 ab 835.1 1.463 a 99.17
NP4 1182.9 b 792.5 1.493 ab 98.33
NP5 1198.2 b 799.8 1.498 ab 100.00
NP6 1218.3 ab 828.0 1.471 a 99.17
CV(%) 3.33 4.30 2.82 2.37
1
Means followed by different letters in the same column are different by the Student-Newman-Keuls test (P<0.05).2
NP1 = 3 feeds (Rostagno et al., 2000); NP2 = 5 feeds (Rostagno et al., 2000); NP3 = 28 feeds (Rostagnoet al., 2000); NP4 = 28 feeds (92.5% of the mathematical model); NP5
= 28 feeds (100% of the mathematical model); NP6 = 28 feeds (107.5% of the mathematical model). CV (coefficient of variation).
Table 10 - Effect of the nutritional plans on the performance of 1- to 21-day-old female Ross broilers1.
Nutritional Plan2
Feed intake (g) Weight gain (g) Feed conversion ratio Livability(%)
NP7 1250.3 a 748.8 1.670 b 99.07
NP8 1231.8 a 746.3 1.651 b 98.15
NP9 1142.3 b 745.1 1.533 a 100.00
NP10 1148.7 b 764.6 1.502 a 100.00
NP11 1167.3 b 783.9 1.489 a 98.15
NP12 1141.8 b 753.0 1.516 a 99.07
CV(%) 3.33 4.30 2.82 2.37
1
Means followed by different letters in the same column are different by the Student-Newman-Keuls test (P<0.05). 2
intake, or feed conversion ratio during the evaluated period.
The absence of bird response to the different nutritional plans shows that during this phase, multiple-phase feeding programs, represented by plans NP3 to NP6 for males and NP9 to NP12 to females, do not impair bird performance. Similar results were obtained by Pope & Emmert (2002) for weight gain and feed intake, but feed conversion results were different.
Considering that the nutritional plans NP5 and NP6 for males and NP11 and NP12 for females presented higher average digestible lysine levels as compared to the other plans, this lack of response to increasing lysine levels was also observed by Mendes et al. (1997), Buteri
(2001), and Ojano-Dirain & Waldroup (2002), whereas Holsheimer & Ruensink (1993), Renden et al. (1994),
and Ajinomoto (2003) obtained different results.
Tables 13 and 14 show the results of the performance 43- to 56-day-old male and female broilers, respectively, as a function of nutritional plan. The nutritional plans significantly influence male weight gain and females feed conversion ratio. On the other hand, male and female feed intake, male feed conversion ratio, and female weight gain were not influenced by the experimental treatments.
In males, NP1 resulted in higher weight gain, as compared to NP3 and NP5; however, these were not different from NP2, NP4, or NP6. In females, NP8 promoted better feed conversion ratio than NP10, but these were not different from the remaining plans (NP7, NP9, NP11, or NP12).
The worst feed conversion ratio presented by females in NP10 could have been caused by the average dietary lysine level, which was the lowest of
Table 11 - Effect of the nutritional plans on the performance of 22- to 42-day-old male Ross broilers1.
Nutritional Plan2
Feed intake (g) Weight gain (g) Feed conversion ratio
NP1 3485.6 1641.6 2.123
NP2 3567.8 1639.2 2.177
NP3 3536.9 1630.3 2.169
NP4 3507.5 1644.9 2.132
NP5 3484.8 1648.1 2.114
NP6 3495.0 1637.1 2.135
CV(%) 2.78 2.95 2.54
1
(P>0.05). 2
NP1 = 3 feeds (Rostagno et al., 2000); NP2 = 5 feeds (Rostagno et al., 2000); NP3 = 28 feeds (Rostagno et al., 2000); NP4 = 28 feeds
(92.5% of the mathematical model); NP5 = 28 feeds (100% of the mathematical model); NP6 = 28 feeds (107.5% of the mathematical model).CV (coefficient of variation).
Table 12 - Effect of the nutritional plans on the performance of 22- to 42-day-old female Ross broilers1.
Nutritional Plan2
Feed intake (g) Weight gain (g) Feed conversion ratio
NP7 3044.3 1317.9 2.310
NP8 3096.8 1361.0 2.275
NP9 3048.3 1345.8 2.265
NP10 3047.5 1326.4 2.298
NP11 3064.2 1332.8 2.299
NP12 3036.3 1363.9 2.226
CV(%) 2.78 2.95 2.54
1
(P>0.05). 2
NP7 = 3 feeds (Rostagno et al., 2000); NP8 = 5 feeds (Rostagno et al., 2000); NP9 = 28 feeds (Rostagno et al., 2000); NP10 = 28 feeds
(92.5% of the mathematical model); NP11 = 28 feeds (100% of the mathematical model); NP12 = 28 feeds (107.5% of the mathematical model).CV (coefficient of variation).
Table 13 - Effect of the nutritional plans on the performance of 43- to 56-day-old male Ross broilers1.
Nutritional Plan2
Feed intake (g) Weight gain (g) Feed conversion ratio
NP1 2788.1 970.9 a 2.872
NP2 2782.2 933.5 ab 2.980
NP3 2681.4 850.3 b 3.153
NP4 2793.5 914.5 ab 3.055
NP5 2695.4 841.0 b 3.205
NP6 2749.1 884.8 ab 3.107
CV(%) 3.97 7.34 5.92
1
Means followed by different letters in the same column are different by the Student-Newman-Keuls test (P<0.05).2NP1 = 3 feeds (Rostagno et al., 2000); NP2 = 5 feeds (Rostagno et al., 2000); NP3 = 28 feeds (Rostagno et al., 2000); NP4 = 28 feeds (92.5% of the mathematical model); NP5
all the experimental diets and did not reach the requirements for maximum weight gain, as there were no statistical differences in feed intake.
The observed similarities in male feed intake and feed conversion ratio among treatments are consistent with the findings of Pope et al. (2001), Pope & Emmert
(2002), and Warren & Emmert (2000), but disagree as to weight gain.
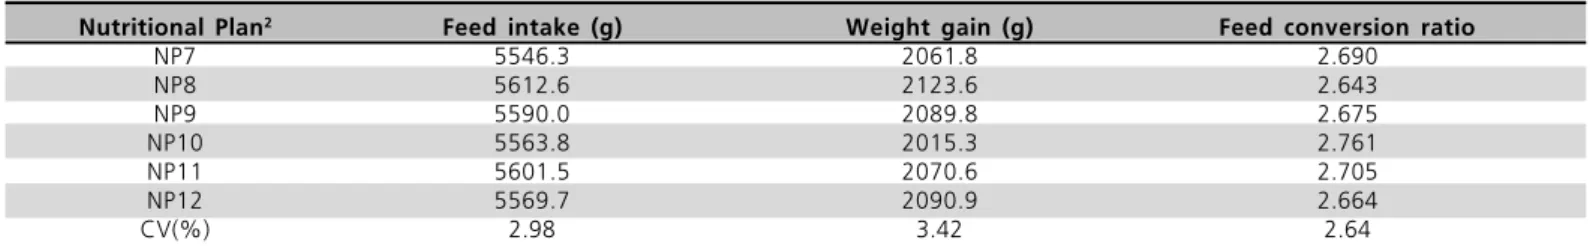
Tables 15 and 16 show the results of the performance 22- to 56-day-old male and female broilers, respectively, as a function of nutritional plan
There was no significant effect of the nutritional plans on feed intake, weight gain, or feed conversion ratio of male and female broilers during the studied period.
The absence of response to the different nutritional plans shows that, during this phase, the multiple-phase
feeding programs, represented by plans NP3 to NP6 for males and NP9 to NP12 to females, do not impair bird performance.
Tables 17 and 18 show the results of the performance 1- to 42-day-old male and female broilers, respectively, as a function of nutritional plan.
The tested nutritional plans significantly influenced male livability and production factor and female feed conversion ratio. Male and female feed intake and weight gain, male feed conversion ratio, and female livability and production factor were not affected by the nutritional plans.
NP1 resulted in the lowest livability and production factor as compared to the other nutritional plans, which were not different from each other. The lowest production factor is exclusively due to the low livability, as the other parameters were not statistically different in males.
Table 14 - Effect of the nutritional plans on the performance of 43- to 56-day-old female Ross broilers1.
Nutritional Plan2
Feed intake (g) Weight gain (g) Feed conversion ratio
NP7 2502.0 743.8 3.364 ab
NP8 2515.8 762.7 3.299 a
NP9 2541.6 744.0 3.416 ab
NP10 2516.3 688.9 3.653 b
NP11 2537.3 737.8 3.439 ab
NP12 2533.4 727.0 3.485 ab
CV(%) 3.97 7.34 5.92
1
Means followed by different letters in the same column are different by the Student-Newman-Keuls test (P<0.05).2NP7 = 3 feeds (Rostagno et al., 2000); NP8 = 5 feeds (Rostagno et al., 2000); NP9 = 28 feeds (Rostagnoet al., 2000); NP10 = 28 feeds (92.5% of the mathematical model);
NP11 = 28 feeds (100% of the mathematical model); NP12 = 28 feeds (107.5% of the mathematical model).CV (coefficient of variation).
Table 15 - Effect of the nutritional plans on the performance of 22- to 56-day-old male Ross broilers1.
Nutritional Plan2
Feed intake (g) Weight gain (g) Feed conversion ratio
NP1 6273.7 2612.5 2.401
NP2 6350.0 2572.7 2.468
NP3 6218.3 2480.7 2.507
NP4 6301.1 2559.4 2.462
NP5 6180.2 2489.0 2.483
NP6 6244.1 2522.0 2.476
CV(%) 2.98 3.42 2.64
1(P>0.05).2NP1 = 3 feeds (Rostagno et al., 2000); NP2 = 5 feeds (Rostagno et al., 2000); NP3 = 28 feeds (Rostagno et al., 2000); NP4 = 28 feeds (92.5% of the mathematical model); NP5 = 28 feeds (100% of the mathematical model); NP6 = 28 feeds (107.5% of the mathematical model).CV (coefficient of variation).
Table 16 - Effect of the nutritional plans on the performance of 22- to 56-day-old male Ross broilers1.
Nutritional Plan2
Feed intake (g) Weight gain (g) Feed conversion ratio
NP7 5546.3 2061.8 2.690
NP8 5612.6 2123.6 2.643
NP9 5590.0 2089.8 2.675
NP10 5563.8 2015.3 2.761
NP11 5601.5 2070.6 2.705
NP12 5569.7 2090.9 2.664
CV(%) 2.98 3.42 2.64
1
(P>0.05).2
NP7 = 3 feeds (Rostagno et al., 2000); NP8 = 5 feeds (Rostagno et al., 2000); NP9 = 28 feeds (Rostagno et al., 2000); NP10 = 28 feeds
In females, the feed conversion ratios resulting from NP9, NP10, NP11, and NP12 were not different from each other, but were better than those obtained in NP7 and NP8 birds. This effect on feed conversion ratio was numerically observed in males, indicating that multiple-phase feeding programs (1 diet every 2 days) are similar to each other and promote better feed conversion ratios as compared to feeding programs with 3 and 5 feeds.
Despite reporting higher efficiency of multiple-phase feeding programs (MDFP) as compared to a 3-feed program during a similar experimental period, Loupe & Emmert (2000) found that MDFPs increased bird feed intake and weight gain, but had no influence on feed conversion ratio, which disagrees with the findings of the present study.
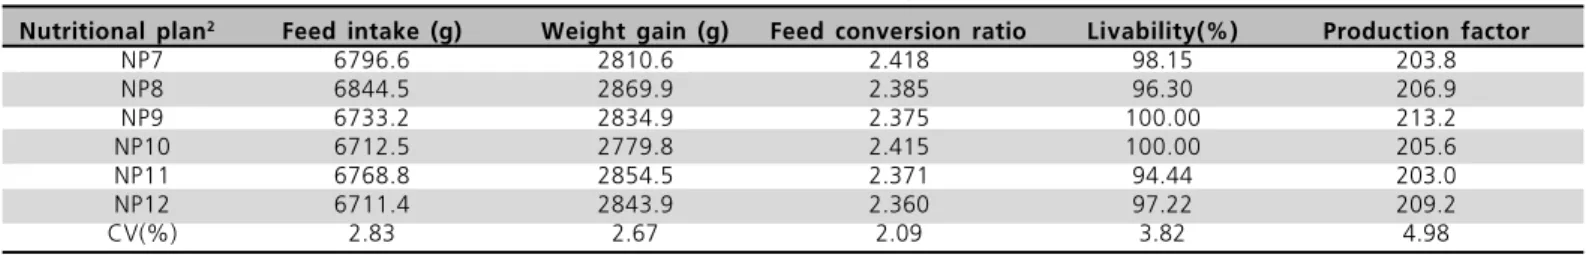
Tables 19 and 20 show the results of the performance 1- to 56-day-old male and female broilers, respectively, as a function of nutritional plan.
The tested nutritional plans significantly influenced only male production factor. Male and female feed intake, weight gain, feed conversion ratio, or livability and female production factor were not affected by the experimental treatments.
In males, the production factors of NP2 and NP4 birds were not different, but were higher as compared to NP5 birds. However, these three treatments were not different from the remaining nutritional plans.
Again, the production factor results suffered a strong influence of livability in each treatment.
The absence of effect of the different nutritional plans on male and female performance shows that
28-Table 19 - Effect of the nutritional plans on the performance of 1- to 56-day-old male Ross broilers1.
Nutritional plan2
Feed intake (g) Weight gain (g) Feed conversion ratio Livability(%) Production factor
NP1 7496.5 3402.5 2.203 89.17 245.9 ab
NP2 7616.7 3393.7 2.244 95.00 256.8 a
NP3 7439.7 3315.8 2.244 95.00 250.8 ab
NP4 7484.0 3351.9 2.233 95.00 254.7 a
NP5 7378.4 3288.8 2.243 90.00 235.4 b
NP6 7462.4 3350.0 2.228 90.83 244.0 ab
CV(%) 2.83 2.67 2.09 3.82 4.98
1
Means followed by different letters in the same column are different by the Student-Newman-Keuls test (P<0.05). 2
NP1 = 3 feeds (Rostagno et al., 2000); NP2 = 5 feeds (Rostagno et al., 2000); NP3 = 28 feeds (Rostagno et al., 2000); NP4 = 28 feeds (92.5% of the mathematical model);
NP5 = 28 feeds (100% of the mathematical model); NP6 = 28 feeds (107.5% of the mathematical model). CV (coefficient of variation).
Table 17 - Effect of the nutritional plans on the performance of 1- to 42-day-old male Ross broilers1.
Nutritional plan2 Feed intake (g) Weight gain (g) Feed conversion ratio Livability(%) Production factor
NP1 4708.4 2413.5 1.951 91.67 b 274.2 b
NP2 4834.5 2460.1 1.965 98.33 a 293.1 a
NP3 4758.3 2465.4 1.930 99.17 a 301.7 a
NP4 4690.5 2437.3 1.924 98.33 a 296.7 a
NP5 4683.0 2447.8 1.913 98.33 a 299.9 a
NP6 4713.3 2465.1 1.912 96.67 a 296.5 a
CV(%) 2.84 2.73 1.79 3.15 4.77
1
Means followed by different letters in the same column are different by the Student-Newman-Keuls test (P<0.05). 2
NP1 = 3 feeds (Rostagno et al., 2000); NP2 = 5 feeds (Rostagno et al., 2000); NP3 = 28 feeds (Rostagno et al., 2000); NP4 = 28 feeds (92.5% of the mathematical model); NP5
= 28 feeds (100% of the mathematical model); NP6 = 28 feeds (107.5% of the mathematical model). CV (coefficient of variation).
Table 18 - Effect of the nutritional plans on the performance of 1- to 42-day-old female Ross broilers1.
Nutritional plan2
Feed intake (g) Weight gain (g) Feed conversion ratio Livability(%) Production factor
NP7 4294.6 2066.8 2.078 b 98.15 232.5
NP8 4328.6 2107.3 2.054 b 97.22 237.3
NP9 4191.6 2090.9 2.005 a 100.00 248.4
NP10 4196.2 2090.9 2.007 a 100.00 248.1
NP11 4231.6 2116.7 1.999 a 98.15 247.4
NP12 4178.1 2116.9 1.974 a 98.15 250.7
CV(%) 2.84 2.73 1.79 3.15 4.77
1
Means followed by different letters in the same column are different by the Student-Newman-Keuls test (P<0.05). 2
diet feeding programs are similar to each other and promote similar performance as compared to 3- and 5-diet programs.
Considering that there were no significant differences in the performance of broilers submitted to the different nutritional plans and the average digestible lysine levels in the starter phase in plans NP3 and NP9, and in the grower and finisher phases of plans NP4 and NP10, it is possible to infer that in multiple-phase feeding programs, where diets are changed every two days, birds have lower lysine requirements, or promote better lysine utilization efficiency, and therefore, maximum performance. Based on the lysine levels of those plans, the equations were fit to: Y = -0.0079x + 1.2435 (R2
= 0.981) for males and Y = -0.0084x + 1.1925 (R2
= 0.978) for females, where "Y" is digestible lysine level (%) and "x" is average age in days. These equations are specific for multiple-phase feeding programs.
CONCLUSIONS
The technique of dilution can be used to produce a high number of diets; however, the tested 28-diet feeding programs were similar to each other, promoting the same performance as that produced by feeding programs that include three and five feeds.
REFERENCES
Agroceres. Manual de manejo do frango de corte AGROSS. Rio Claro: Agroceres; 2000.
Ajinomoto Animal Nutrition. Feeding broilers different lysine to apparent metabolizable energy ratios during the 40 to 2000 gram live weight period. Poultry Research Report, n.12. [acesso em: 2009 Jan 01]. Disponivel em: <http://www.lysine.com/new/ Technical%20Reports/Poultry/PRR12.pdf>
Barboza WA. Exigências nutricionais de lisina para duas marcas comerciais de frangos de corte [tese]. Viçosa (MG): Universidade Federal de Viçosa; 1998.
Buteri CB. Níveis nutricionais de lisina digestível no desempenho produtivo e econômico de frangos de corte [dissertação]. Viçosa (MG): Universidade Federal de Viçosa; 2001.
Costa FGP. Níveis dietéticos de lisina e proteína bruta para frangos de corte [tese]. Viçosa (MG): Universidade Federal de Viçosa; 2000.
Dritz SS, Tokach MD, Goodband RD, Nelssen JL. Growing-finishing pig recommendations. Manhattan: Kansas State University; 1997.
Edwards HM, Fernandez SR, Baker DH. Maintenance lysine requirement and efficiency of using lysine for accretion of whole-body lysine and protein in young chicks. Poultry Science 1999; 78:1412-1417.
Emmert JL, Baker DH. Use of the ideal protein concept for precision formulation of amino acid levels in broiler diets. Journal of Applied Poultry Research 1997; 6:462-470.
Holsheimer JP, Ruensik EW. Effect on performance, carcass composition, yield, and financial return of dietary energy and lysine levels in starter and finisher diets fed to broilers. Poultry Science 1993; 72:806-815.
Ivey FJ. Desenvolvimento e aplicação de modelos de crescimento para frangos de corte. Simpósio Internacional ACAV-Embrapa Sobre Nutrição de Aves; 1999; Concórdia, Santa Catarina. Brasil. p. 22-35.
Loupe LN, Emmert JL. Growth performance of broiler chicks during the starter and grower phases in phase-feeding. Discovery 2000; 1(1): 20-24.
Mendes AA, Watkins E, England JA, Saleh EA, Waldroup PW. Influence of dietary lysine levels and arginine:lysine ratios on performance of broilers exposed to heat or cold stress during the period of three to six weeks of age. Poultry Science 1997; 76:472-481.
Ojano-Dirain CP, Waldroup PW. Evaluation of lysine, methionine and threonine needs of broilers three to six week of age under moderate temperature stress. International Journal of Poultry Science 2002; 1(1):16-21.
Pope HR, Townsend JA, Emmert JL. Impact of phase-feeding on growth performance of broilers fed diets adjusted every other day for decreased amino acid content. Poultry Science 2001; 80 suppl 1:45
Table 20 - Effect of the nutritional plans on the performance of 1- to 56-day-old female Ross broilers1.
Nutritional plan2
Feed intake (g) Weight gain (g) Feed conversion ratio Livability(%) Production factor
NP7 6796.6 2810.6 2.418 98.15 203.8
NP8 6844.5 2869.9 2.385 96.30 206.9
NP9 6733.2 2834.9 2.375 100.00 213.2
NP10 6712.5 2779.8 2.415 100.00 205.6
NP11 6768.8 2854.5 2.371 94.44 203.0
NP12 6711.4 2843.9 2.360 97.22 209.2
CV(%) 2.83 2.67 2.09 3.82 4.98
1
(P>0.05). 2
NP7 = 3 feeds (Rostagno et al., 2000); NP8 = 5 feeds (Rostagno et al., 2000); NP9 = 28 feeds (Rostagno et al., 2000); NP10 = 28 feeds
Pope T, Emmert JL. Impact of phase-feeding on the growth performance of broilers subjected to high environmental temperatures. Poultry Science 2002; 81:504-511.
Pope T, Emmert JL. Phase-feeding supports maximum growth performance of broiler chicks from forty-three to seventy-one days of age. Poultry Science 2001; 80:345-352.
Renden JA, Moran Jr ET, Kincaid SA. Lack of interactions between dietary lysine or strain cross and photoschedule for male broiler performance and carcass yield. Poultry Science 1994; 73:1651-1652.
Rostagno HS, Albino LFT, Donzele JL, Gomes PC, Oliveira RF, Lopes DC, Ferreira AS, Barreto SLT. Tabelas brasileiras para aves e suínos: composição de alimentos e exigências nutricionais. Viçosa (MG): UFV; 2000. p. 141.
Universidade Federal de Viçosa. Sistema de análises estatísticas e genéticas. Viçosa (MG); 1999. 59p.