Received 26/3/2012 Accepted 4/9/2012 (005648)
1 Laboratório de Bioquímica e Biotecnologia – LABBIOTEC, Coordenação do Curso de Licenciatura em Química, Centro de Ciências e Tecnologia – CCT, Universidade Estadual do Ceará – UECE, Av. Paranjana, 1700, CEP 60740-000, Fortaleza, CE, Brasil, e-mail: liberato@secrel.com.br
2 Laboratório de Produtos Naturais – LPN, Coordenação do Curso de Licenciatura em Química, Universidade Estadual do Ceará – UECE, Av. Paranjana, 1700, CEP 60740-000, Fortaleza, CE, Brasil
*Corresponding author
Physicochemical properties and mineral and protein content of honey samples from
Ceará State, Northeastern Brazil
Propriedades físico-químicas, minerais e teor de proteínas em amostras de méis do Estado do Ceará,
nordeste do Brasil
Maria da Conceição Tavares Cavalcanti LIBERATO1*, Selene Maia de MORAIS2,
Carlos Emanuel de Carvalho MAGALHÃES1, Islay Lima MAGALHÃES1, Daniel Bomfim CAVALCANTI1,
Marina Maciel de Oliveira SILVA1
Resumo
Este trabalho avaliou propriedades físico-químicas, teores de proteína e minerais em méis do Ceará, um dos principais exportadores do País. Também foi analisada a importância nutricional com relação aos minerais detectados. As propriedades físico-químicas foram determinadas pelos métodos da AOAC e CAC, o conteúdo de proteína pelo método de Bradford e os minerais por espectrometria de absorção atômica. Todas as análises foram feitas em triplicata. Os níveis dos macrominerais sódio (Na), potássio (K), cálcio (Ca), e magnésio (Mg) variaram de 1,80-47,20, 21,30-1513,30, 14,58-304,82 e 2,48-28,33 mg/kg, respectivamente, e os elementos traços ferro (Fe), cobre (Cu), manganês (Mn), zinco (Zn), selênio (Se), e cromo (Cr) variaram de 0,12-8,76, 0,07-1,29, 0,06-1,96, 0,07-1,85 mg/kg, 0,36 × 10⁻³-62,00 × 10⁻³ e
22,50 × 10⁻³-170,33 × 10⁻³ µg/kg, respectivamente. A amostra de Myracrodruon urundeuva apresentou altos teores dos principais minerais
(Na, K, Ca, e Mg). O teor de proteínas para o mel de Anacardium occidentale foi o maior (1121,00 µg/g) entre as amostras de méis analisadas. Entre os minerais, detectados, K apresentou a maior concentração seguido por Ca, Na, e Mg. A pesquisa de elementos traços pode indicar contaminação ambiental. As amostras de méis estudadas apresentaram-se livres de contaminação por elementos traço, excetuando-se quanto ao Mn, em que apenas a amostra proveniente de Piptadenia moniliformis apresentou-se dentro da legislação. As variações dos constituintes químicos devem-se provavelmente às variadas origens florais e os teores de proteínas e minerais ratificam a importância nutricional dos méis do Ceará.
Palavras-chave:mel de Apis mellifera; origem floral; importância nutricional.
Abstract
This study evaluated the physicochemical properties and protein and mineral content of honey samples from Ceará State, Northeastern Brazil, one of the major honey exporters in the country. Nutritional importance of the minerals detected was also analyzed. Physicochemical properties were examined according to the AOAC and CAC official methods; the protein content was determined using the Bradford method, and the minerals were analyzed by atomic absorption spectrometry. All analyses were performed in triplicate. The levels of macrominerals sodium (Na), potassium (K), calcium (Ca), and magnesium (Mg) varied from 1.80-47.20, 21.30-1513.30, 14.58-304.82, and 2.48-28.33 mg/kg, respectively, and the trace elements iron (Fe), copper (Cu), manganese (Mn), zinc (Zn), selenium (Se), and chromium (Cr) varied from 0.12-8.76, 0.07-1.29, 0.06-1.96, 0.07-1.85 mg/kg, 0.36 × 10⁻³-62.00 × 10⁻³ and 22.50 × 10⁻³-170.33 × 10⁻³ µg/kg, respectively. Myracrodruon urundeuva
honey sample had high contents of macrominerals (Na, K, Ca, and Mg). Protein content of the Anacardium occidentale honey sample was the highest (1121.00 µg/g) among the samples analyzed. Among the minerals detected in the honey samples, K showed the highest concentration, followed by Ca, Na, and Mg. The presence of trace elements can show environmental contamination. The honey samples studied were free of trace elements contamination, except for Mn; the Piptadenia moniliformis was the only honey sample that was in compliance with the law requirements. The variations of the chemical constituents in the honey samples are probably related to differences in the floral origin and mineral and protein contents and confirm the nutritional importance of Ceará State honey.
Keywords: Apis mellifera honey; floral origin; nutritional importance.
OI:http://dx.doi.org/10.1590/S0101-20612013005000028
1 Introduction
Honey is rich in properties that result from its chemical composition. It is not considered a complete food according to human nutritional standards, but it does offer potential supplement for infants, senior citizens, and convalescents as an easily digestible foodstuff that may be ingested directly or used as a sweetener in a variety of products.
consumption of foods with therapeutic benefits is an effective way to achieve a healthy lifestyle. Since a balanced diet is related to minerals and protein content in food, it is further studies are important to elucidate the potential of Ceará honey.
2 Materials and methods
2.1 Honey samples
Twenty-two samples of Apis mellifera honey from different floral origins were obtained from apiarists and beekeepers’ associations in different places in Ceará State. Each honey sample was identified in terms of its floral origin and site of collection based on information obtained from the suppliers. The honey samples were derived from different botanical sources including: Hyptis suaveolens Poit. (S02), Anacardium occidentale L. (S04), Spermacoce verticillata L. (S05), Mimosa verrucosa Benth. (S08), Piptadenia moniliformis Benth. (S09),
Myracrodruon urundeuva Fr. All. (S15 e S19), Licania rigida
Benth. (S17), Lippia sidoides Cham. (S18), Serjania sp. (S20), and Ziziphus joazeiro Mart.(S22). The honey samples S01, S03, S06, S07, S10, S11, S12, S13, S14, S16, and S21, were heterofloral (Table 1). The samples were collected between July 2007 and March 2009, during the dry and rainy seasons. All samples were transferred to the laboratory, stored in amber flasks, and kept at 4-5 °C until analysis.
2.2 Moisture, ash, free acidity, pH, and insoluble solids
All analyses were carried out in triplicate. Moisture was determined according to the AOAC official method (ASSOCIATION…, 1998) using a standard Abbe-type refractometer at 20 °C. Water content (%) was obtained from the Chataway table.
Ash content was determined according to the CAC method (CODEX…, 1990). Honey samples of 5 g were incinerated in a muffle furnace (Quimis, São Paulo, Brasil) at 550 °C. A pH meter was used to determine the pH, and the acidity was determined according to the AOAC method.
The gravimetric method was used for the determination of the insoluble solids according to the CAC method. Honey samples (20 g) were diluted with the minimum amount of water at 80 °C and transferred to porous previously weighed crucibles. After this procedure, the samples were flushed with distilled water at 80 °C to remove all sugars. The porous crucibles were placed in an oven at 135 °C for 1 hour and then cooled and weighed.
2.3 Analysis of honey color intensity
Honey color intensity was determined using a Spectrophotometer (model Thermo Biomate 5, New York, USA). The honey samples were diluted to 50% (w/v) with warm water (45-50 °C), sonicated for 5 minutes, and filtered to eliminate large particles. The net absorbance was defined as the difference between the spectrophotometric absorbance at 450 and 720 nm (BERETTA et al., 2005).
botanical origin, processing and storage, and climatic factors that occur during the flow of nectar, and to the temperature at which the honey matures in the hive (SEEMANN; NEIRA, 1988). Brazil is an important producer and exporter of
Apis mellifera honey due to botanical diversity and differentiated vegetation that provides blossoming plants all year long.
The method described by Bradford was chosen for the quantitative determination of proteins. According to Azeredo et al. (2003), this method eliminates most of the problems involved in the other procedures.
The main minerals present in honey originate from soil and are transported to trees by the roots. The minerals make their way into the nectar and are subsequently incorporated into the honey produced by bees (STANKOVSKA; STAFILOV; SANJ, 2008). Accordingly, the composition and the content of metals in honey, particularly major and minor metals, is affected by the composition determined by geochemical and geological features (FERNÁNDEZ-TORRES et al., 2005). Since soil and plants are natural sources that have a great influence on the mineral composition of honey, information on the metal profile is suitable for categorizing honeys according to their floral and geographical provenance (POHL, 2009). There is little information about the inorganic content of Brazilian honey because usually the organic components or some physicochemical properties are investigated to characterize the honey. A lot of studies on the level of mineral in bee products are focused on investigating environmental pollution effects on these products quality since they have an important role as indicatives of pollution in the areas where they are produced (CONTI; BOTRE, 2001). Honey samples originating from polluted sites, from flowers that provide nectar and pollen pellets, are subject to contamination by heavy metals from emissions of gases and particles (MAGALHÃES, 2010). These minerals present in bee products in levels above those permitted by legislation represent a threat to humans due to their negative and cumulative effects of contaminants on human health. Arsenic exposure, for example, increases the risk of cancer, diabetes, and hypertension among others diseases (DESCHAMPS; MATSCHLLAT, 2007). Heavy metals that can contaminate bee products are: lead (Pb), copper (Cu), chromium (Cr), manganese (Mn), nickel (Ni), zinc (Zn), silver (Ag), iron (Fe), cadmium (Cd), aluminum (Al), cobalt (Co), and strontium (Sr). Their levels in honey samples can indicate the degree of environmental pollution and the geographic origin of the honey samples (FRANCHINI et al., 2007).
This study investigated several honey samples of different floral origins from Ceará State, including honey samples from important Brazilian medicinal plants such as Lippia sidoides
Cham. and Myracrodruon urundeuva Fr. All. (Table 1).
Table 1. Honey samples, place of collection, period of collection, and local vegetation.
Samples Place of collection* Period Common vegetation
Heterofloral (S01)
Parambu July
2008
Bumelia sartorum Mart., Croton sonderianus Muell. Arg., Hyptis suaveolens Poit, Mimosa caesalpiniaefolia Benth., Mimosa scabrella Benth., Mimosa tenuiflora (Willd.) Poir. Heterofloral
(S02)
Meruoca May
2008
Mimosa verrucosa Benth., Borreria verticillata Mayer, Malpighia glabra L.
Heterofloral (S03)
Itapiuna October 2008
Croton sonderianus Muell. Arg., Hyptis suaveolens Poit, Bumelia sartorum var. latifolia, Mimosa caesalpiniaefolia Benth., Mimosa tenuiflora (Willd.) Poir.
M. verrucosa
(S04)
Ibiapina August 2008
Mimosa verrucosa Benth,
Heterofloral (S05) Morada Nova September 2008
Merremia aegyptia L. Urban, Mimosa hostilis (Willd.) Poir., Hyptis suaveolens
Poit.,Croton sonderianus Muell. Arg. P. moniliformis
(S06)
Pindoretama April 2008
Piptadenia moniliformis Benth.
Serjania sp.
(S07)
Crato June
2008
Serjania sp.
M. urundeuva
(S08)
Tauá November
2007
Myracrodruon urundeuva Fr. All.
A. occidentale
(S09)
Pacajus January 2008
Anacardium occidentale L.
H. suaveolens (S10) Morada Nova June 2008
Hyptis suaveolens Poit.
S. verticillata
(S11)
Horizonte April 2009
Spermacoce verticillata L.
Heterofloral (S12)
Canindé February 2008
Alternanthera brasiliana (L.) Kuntze, Bumelia sartorum var. latifolia, Croton campestris
St. Hill., Croton sonderianus Muell. Arg., Mimosa tenuiflora (Willd.) Poir., Mimosa caesalpiniaefolia Benth.
Heterofloral (S13)
Barbalha July
2008
Mimosa caesalpiniaefolia Benth., Mimosa verrucosa Benth., Serjania sp., Borreria verticillata Mayer, Combretum leprosum Mart., Mimosa tenuiflora (Willd.) Poir.,
Mimosa scabrella Benth. Heterofloral
(S14)
Ibaretama April 2009
Licania rigida Benth., Mimosa caesalpiniaefolia Benth., Mimosa tenuiflora (Willd.) Poir., Bumelia sartorum var. latifolia Miq.
Heterofloral (S15)
Irauçuba April 2009
Bumelia sartorum var. latifolia Miq., Croton sonderianus Muell., Hyptis suaveolens
Poit., Mimosa scabrella Benth, Mimosa caesalpiniaefolia Benth., Mimosa tenuiflora
(Willd.) Poir.
H. suaveolens
(S16)
Milagres June
2008
Hyptis suaveolens Poit.
L. rigida
(S17)
Choró July
2007
Licania rigida Benth.
Z. joazeiro
(S18)
Várzea Alegre July 2007
Ziziphus joazeiro Mart.
Heterofloral (S19)
Cascavel January 2009
Anadenanthera macrocarpa Benth., Anacardium occidentale L.,Cocos nucifera L., Byrsonima intermedia A. Juss.
Heterofloral (S20)
Aracati October 2008
Cocos nucifera L., Moringa oleifera Lam., Byrsonima crassifolia L.Kunth.
L. sidoides
(S21)
Monsenhor Tabosa November 2008
Lippia sidoides Cham.
M. urundeuva (S22) Monsenhor Tabosa June 2008
Myracrodruon urundeuva Fr. All.
Heterofloral (S23)
Itapipoca August 2008
Anacardium occidentale L., Cocos nucifera L., Byrsonima crassifolia L. Kunth., Borreria verticillata Mayer
*All municipalities were located in Ceará State.
2.4 Protein content
The Bradford method (1976) was used for protein determination. To a 0.1 mL solution of protein extract (honey sample 50% w/v) were added 5 mL of Coomassie Brilliant Blue (200 mg of Coomassie Brilliant Blue G-250 dissolved in 100 mL 95% ethanol, and then 200 mL 85% H3PO4 were added. The resulting solution was diluted to a final volume of 2 L). The Coomassie Brilliant Blue forms a protein-dye complex. After 2 minutes of incubation, absorbance was measured at
595 nm against an albumin standard solution of bovine serum (10-100 µg/0.1 mL) in 0.15 M NaCl.
2.5 Mineral analysis
regulations for honey (BRASIL, 2000). L. sidoides (S18) (20.80%), a heterofloral sample (S10) (20.40%), and L. rigida
(S17) (19.78%) had the highest moisture values, while Serjania sp
(S20) had the lowest value(13.63%). Moisture content in honey is associated to its botanical source (ABU-TARBOUSH.; AL-KAHTANI; EL-SARRAGE, 1993) and to several other factors such as the degree of honey ripeness, processing techniques, stockpiling conditions, relative air moisture, blossom, and amount of available nectar. There is a great variation in climate and soil all over Ceará State. Therefore, there are some places with high and others with low relative air moisture. Moisture is the key criterion that determines the ability of honey to remain fresh and free of fermentation (BOGDANOV et al., 1999). Bendini and Souza (2008) found values of moisture varying from 16.50 to 19.20% in honey samples originating from cashew flowers from the city of Cascavel, Ceará State. These results are close to those obtained in the present study. Arruda et al. (2005) found moisture contents ranging from 14.97 to 17.23% in honey samples from the region of Chapada do Araripe/Santana do Cariri, Ceará State. Some of these results are lower than the results obtained in the present study, which includes honey correction system, Varian, Mulgrave, Australia), and the other
mineral constituents (Na, K, Ca, Mg, Fe, Cu, Zn, and Mn) were determined by Flame Atomic Absorption Spectrometry (SpectrAA55 model, Varian, Mulgrave, Australia). In both cases, the analyses were carried out following the manufacturer’s recommendations. The standard solutions of minerals were prepared from several dilutions of stock standard solutions (1000 mg/L) supplied by J. T. Baker (England).
3 Results and discussion
3.1 Floral origins of honey samples from Ceará State
The description of the honey samples, their places of collection, period of collection, and vegetation characteristics where the samples were collected are shown in Table 1.
3.2 Physicochemical properties
The physicochemical parameters of the honey samples (moisture, pH, ash, free acidity, color, and insoluble solids) are shown in Table 2. Most of the moisture values were below 20%, which is the maximum value allowed by CAC and Brazilian
Table 2. Physicochemical parameters of honey bee of different plant origins from Ceará State - Brazil.
Sample Moisture Ash Free acidity pH Color Ins. solids Protein
(%, w/w) (%, w/w) (meq/kg) (mUA) (%) (µg g–1)
S01 14.39 ± 0.89 0.28 ± 0.02 34.00 ± 2.45 3.66 ± 0.01 573 ± 19 0.07 ± 0.01 708 ± 61.20 S02 18.39 ± 1.41 0.33 ± 0.06 44.40 ± 1.60 3.73 ± 0.17 1185 ± 265 0.06 ± 0.03 476 ± 26.13 S03 16.55 ± 0.39 0.17 ± 0.04 35.00 ± 1.45 3.43 ± 0.05 1257 ± 121 0.03 ± 0.01 255 ± 32.40 S04 15.62 ± 0.31 0.01 ± 0.02 18.20 ± 0.53 3.15 ± 0.02 2600 ± 135 0.08 ± 0.02 1121 ± 14.50 S05 15.89 ± 0.45 0.67 ± 0.02 40.70 ± 2.23 3.83 ± 0.33 2033 ± 175 0.10 ± 0.01 288 ± 40.62 S06 14.97 ± 1.01 0.15 ± 0.15 28.80 ± 2.01 3.45 ± 0.16 801 ± 42 0.03 ± 0.02 121 ± 15.09 S07 19.00 ± 0.87 0.01 ± 0.21 17.00 ± 1.19 3.50 ± 0.28 1432 ± 11 0.14 ± 0.01 330 ± 21.30 S08 18.50 ± 0.81 0.12 ± 0.01 25.00 ± 0.14 3.18 ± 0.07 153 ± 19 0.09 ± 0.01 248 ± 48.31 S09 16.95 ± 0.22 0.07 ± 0.03 19.10 ± 1.02 3.68 ± 0.26 306 ± 58 0.04 ± 0.03 301 ± 31.05 S10 20.40 ± 0.56 0.71 ± 0.01 54.50 ± 1.65 3.38 ± 0.42 327 ± 29 0.17 ± 0.01 198 ± 15.01 S11 18.00 ± 1.12 0.01 ± 0.04 16.67 ± 2.15 3.40 ± 0.31 355 ± 53 0.14 ± 0.00 289 ± 31.11 S12 17.40 ± 0.84 0.07 ± 1.11 37.51 ± 0.98 3.61 ± 0.25 228 ± 41 0.09 ± 0.01 382 ± 51.07 S13 18.20 ± 0.78 0.06 ± 0.02 38.96 ± 1.76 3.65 ± 0.20 212 ± 19 0.13 ± 0.01 356 ± 27.02 S14 16.83 ± 1.08 0.01 ± 0.01 25.14 ± 3.43 3.21 ± 0.05 178 ± 45 0.10 ± 0.02 295 ± 37.21 S15 15.65 ± 0.15 0.52 ± 0.21 49.25 ± 0.75 4.21 ± 0.41 2945 ± 141 0.03 ± 0.05 451 ± 21.54 S16 14.79 ± 0.25 0.05 ± 0.14 33.54 ± 2.72 3.01 ± 0.69 610 ± 55 0.07 ± 0.02 312 ± 44.08 S17 19.78 ± 0.92 0.24 ± 0.03 52.00 ± 2.51 4.17 ± 0.15 638 ± 102 0.18 ± 0.01 397 ± 35.14 S18 20.80 ± 0.65 0.13 ± 0.05 51.03 ± 1.00 3.70 ± 0.10 902 ± 33 0.13 ± 0.00 471± 44.56 S19 18.23 ± 2.58 0.30 ± 0.21 50.25 ± 0.75 3.80 ± 0.13 2062 ± 441 0.05 ± 0.04 845 ± 38.21 S20 13.63 ± 0.34 0.01 ± 0.01 31.50 ± 0.50 3.67 ± 0.25 412 ± 44 0.06 ± 0.01 178 ± 24.08 S21 17.85 ± 0.43 0.32 ± 0.17 20.42 ± 0.77 3.43 ± 0.40 876 ± 53 0.17 ± 0.00 355 ± 30.17 S22 17.23 ± 0.12 0.12 ± 0.08 40.10 ± 0.02 3.78 ± 0.17 2830 ± 258 0.10 ± 0.02 724 ± 48.16
The results of color intensity showed that the absorbance of a 50% (w/v) honey solution varied from 153 (Mimosa verrucosa,
S08) to 2945 mUA (Myracrodruon urundeuva, S15). The
predominance of honeys colors varying from amber to dark amber was observed. Color is the physical property immediately perceived by the consumer. Indeed, the pricing of honey depends to a great extent on honey color (BOGDANOV; RUOFF; PERSANO ODDO, 2004). Beretta et al. (2005) investigated 14 commercial honey samples of different floral and geographic origins and found values of absorbance varying from 25 mAU, for the pale-white honey sample (acacia), to 3413 mAU, for the dark-brown strawberry tree honey sample. This marked difference might be a reliable evidence of the presence of pigments such as carotenoids and Maillard reaction products (GHELDOF; WANG; ENGESETH; 2002). According to Beretta et al. (2005), this could be due to specific contaminating pigments arising from handling, processing, and storage, and/or from biochemical reactions during honey maturation.
The ash values of the honey samples in this study varied from 0.01 to 0.71%, with a average value of 0.19%. The highest content of ashes was found in the heterofloral honey sample
(S10) (0.71%), followed for Spermacoce verticillata (S05)
(0.67%), and M. urundeuva (S15) (0.52%) honey samples.
These samples had dark colors which, according White Junior (1978), reflect their higher mineral content; however, other honey samples, such as Anacardium occidentale (S04) (0.01%) and Ziziphus joazeiro (S22) (0.12%), with low ash contents had the two highest color values (2600 and 2830 mUA, respectively). The maximum ash content allowed by the European Honey
Commission (BOGDANOV; MARTIN; LÜLLMANN, 1997)for
floral honey is 0.60%. Two samples, among the honey samples analyzed in the present study, exceeded the maximum value permitted by law. Analyzing honey samples from Piauí State, Northeastern Brazil, Silva, Queiroz and Figueirêdo (2004) found average ash values ranging from 0.06 to 0.14%.
3.3 Protein contents
The quantitative determination of protein contents are shown in Table 2. The protein content found in A. occidentale
(S04) honey sample was the highest (1121.00 µg/g), followed
by the honey samples of M. urundeuva (S19) (845.80 µg/g)
and Z. joazeiro (S22) (724.50 µg/g). In general, the results are within the range established by the official methods used in Brazil (BRASIL, 2000). Azeredo et al. (2003) studied the presence of proteins in honey samples of different floral origins, commercialized in several states in Brazil, using the Bradford method, and they found that the colorimetric determination of the protein content of honey samples using this method was efficient. To Azeredo et al. (2003) considered high protein contents to be those higher than 1000.00 µg/g and found
high values of protein content in honey samples of Borreria
verticillata (2236.00 µg/g), from Piauí.
3.4 Mineral analysis
The macromineral content of the honey samples analyzed are shown in Table 3. The most abundant mineral in the floral honey samples was K, with levels ranging from 21.30 mg/kg, samples from different regions of Ceará State and not only from
the Cariri region, which has a typical vegetation.
The honey from a heterofloral sample (S10) had greatest free acidity value (54.50 mEq/kg). L. rigida (S17) (52.00 mEq/kg) and L. sidoides (S18) (51.03 mEq/kg) also had acidity levels above the maximum value. AOAC and Brazilian regulations for honey (BRASIL, 2000) allow 50.00 mEq/kg as the maximum free acidity value. A high level of acidity in honey may indicate that fermentation has occurred. The honey samples with free acidity values above 50.00 mEq/kg, except for the honey sample from L. rigida, had moisture contents a little higher that 50.00 mEq/kg. Sodré, Marchini and Carvalho (2002) found free acidity values between 13.00 and 43.00 mEq/kg in honey samples from Northeastern Brazil. Abadio Finco, Moura and Silva (2010), studying honey samples from Southern Tocantins State, found free acidity values between 35.00 and 59.00 mEq/kg. Acidity is influenced by chemical properties of the organic and inorganic acids, e.g. the tridimensional molecular structure and the ionization rate in the honey samples and also by the amino acids content provided by the nectar and salivary enzymes of A.
mellifera (CRANE, 1983). According to Pamplona (1989), the content of gluconic acid, produced from glucose by the action of the glucose-oxidase enzyme, tends to increase during the storage of honey because this enzyme remains in activity after processing. Thus, honey acidity increases during the storage and as a result the pH decreases.
The pH analysis of the honey samples from Ceará were performed although the Brazilian legislation (BRASIL, 2000) does not require evaluation of quality of honey samples. The honey samples showed pH values between 3.01 and 4.21. Values of pH represent a measure of the acidity of dissolved hydrogen
ions in water.Sodré, Marchini and Carvalho (2002) found
similar pH values ranging from 3.37 to 4.46 in honey samples from the North Coast of Bahia State. Borsato et al. (2010), studying honey samples from Paraná State, found values of pH varying from 3.60 to 5.35. Increasing trends in pH have been detected in samples with higher values of ashes, which are in accordance with the results found in the present study (Table 2) (BORSATO et al., 2010).
The honey samples analyzed had insoluble solid contents ranging from 0.03 to 0.18%. Honey sample from flowers of
Minerals are a big class of micronutrients, which are largely considered essential nutrients. They are traditionally divided into macrominerals (volume elements) and microminerals (trace elements) (MAHAN; ESCOTT-STUMP, 2005). Minerals represent near 4.00 to 5.00 % of body weight or 2.80 to 3.50 kg in adults, men and women respectively. Approximately 50% of this weight is calcium. The best way to obtain a variety of minerals is through various foods instead of the intake of dietary supplements (MAHAN; ESCOTT-STUMP, 2005).
Adequate Intake (AI) for Ca, for men and women is 1000.00 mg for adults of 19 to 50 years old and 1200.00 mg for adults above 51 years old; for Mn is 2.30 mg for men and 1.80 mg for women; for Cr 35.00 µg for men and 25.00 µg for women. Recommended Dietary Allowance (RDA) for minerals is: from 1600.00 to 2000.00 mg (K); 500.00 mg (Na); from 400.00 to 420.00 mg (Mg) for men and from 310.00 to 320.00 mg for women (14 to 70 years old); 10.00 mg (Fe) for men and 15.00 mg for women; 11 mg (Zn) for men and 8.00 mg for women; 900.00 µg (Cu) for men and women; and 55.00 µg (Se) for men and women (FRANCO, 2008; MAHAN; ESCOTT-STUMP, 2005). If an adult individual ingests a tablespoon of honey every day, according to the findings obtained in this study, this person could have an intake of 0.65 mg of Na, 13.33 mg of K, 2.67 mg of Ca, 0.58 mg of Mg, 0.68 mg of Fe, 0.02 mg of Cu, 0.03 mg of Mn, 0.02 mg of Zn, 3.32 µg of Cr, and 0.19 µg of Se. A tablespoon of honey from Ceará State is sufficient to meet the daily potassium and calcium requirements, as recommended by of RDA.
The most abundant metal in honey is K (FERNÁNDEZ-TORRES et al., 2005). Other major metals present in honey are Na (second most common), Ca, and Mg. Cu, Fe, Zn, and Mn are present in intermediate quantities (POHL, 2009). Almeida-Anacleto and Marchini (2004) studied honey samples from the city of Pirassununga, State of São Paulo, and found K to be the most abundant element. These results are consistent with those found by Abu-Tarboush, Al-Kahtani and El-Sarrage (1993). In the present study, K was the most abundant metal found in the honey samples from Ceará.
Almeida-Anacleto and Marchini (2004) found Ca to be the second most abundant element in honey samples from São Paulo, southeastern Brazil. Conti (2000) investigated honey samples of different botanical origins in the Lazio region (Central Italy) and found the following average values (µg/g weight): K (472.00), Na (96.00), Ca (47.70), Mg (37.00), Cu (0.31), Fe (4.51), Mn (3.00), and Zn (3.14). The level of K was lower than those reported for the honey samples from Galicia by Rodriguez-Otero et al. (1994), who found 1572.00 µg/g.
Almeida-Anacleto and Marchini (2004) found Mg as the third most abundant mineral in their honey samples. Fernández-Torres et al. (2005)determined the levels of eleven elements (Zn, P, B, Mn, Mg, Cu, Ca, Ba, Sr, and K) in 40 honey samples from four different plant sources from different locations in Spain. These authors found that K, Ca, and P showed the highest concentrations: 434.10-1935.00 mg/kg for K, 42.59-341.00 mg/kg for Ca, and 51.17-154.30 mg/kg for P. The levels of Cu (0.53-2.12 mg/kg), Ba (0.11-1.26 mg/kg), and Sr (0.26-1.46 mg/ kg) were the lowest in all honey samples. Concentrations of Zn (1.33-7.29 mg/kg), Mn (1.33-9.47 mg/kg), Mg (13.26-74.38 mg/ for P. moniliformis (S09), to 1513.30 mg/kg, for the heterofloral
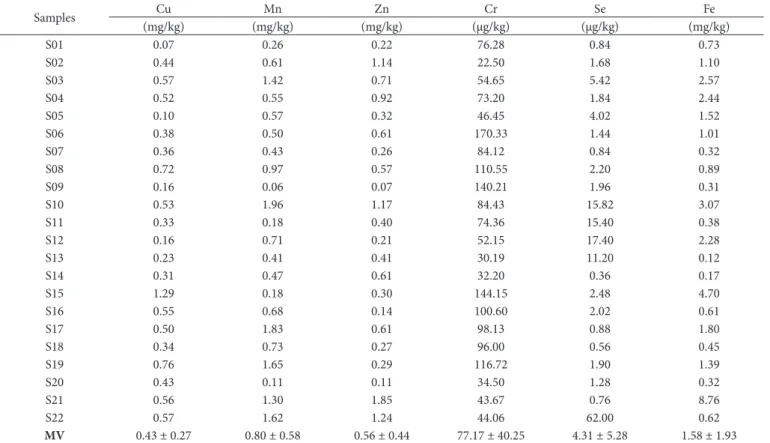
sample (S10). The mineral with the second highest content in the honey samples studied was Ca, with values ranging from 14.58 mg/kg, for a sample of honeyof H. suaveolens (S02),to 304.82 mg/kg, for the honey sample of Z. joazeiro Mart (S22); and the third most abundant mineral was Na, with levels varying from 1.80 mg/kg, for Z. joazeiro (S22) honey sample, to 47.20 mg/kg, for M. urundeuva (S15) honey sample, followed by M.urundeuva (S19) (38.40 mg/kg) from a different place of collection. The levels of Zn in the honey samples analyzed varied from 0.07 mg/kg, for P. moniliformis honey sample (S09), to 1.85 mg/kg, for the heterofloral honey sample (S21). They are shown in Table 4. Several authors found that the levels of minerals in honey vary according to the botanical origin and soil composition (POHL, 2009). Calcium is a macronutrient essential for plants as well as for animals. It occupies much of the exchange sites in neutral and calcareous soils. Zinc is an important micronutrient essential for plant growth and development. Iron is an essential micronutrient for both plants and animals. In neutral-to-alkaline soils, it is present as insoluble Fe3+ compounds. Manganese is a heavy metal and an essential
micronutrient (SARWAR et al., 2010). However, there is little information about the mineral content of honey from Ceará State.
Table 3. Macrominerals in honey samples of different origin from Ceará State.
Samples Na K Ca Mg
(mg/kg) (mg/kg) (mg/kg) (mg/kg)
S01 12.40 44.50 21.24 2.48
S02 6.60 302.90 14.58 7.71
S03 12.70 328.40 64.01 4.19
S04 14.00 53.20 44.78 22.73
S05 5.00 1057.40 59.93 13.32
S06 23.10 43.00 37.55 10.83
S07 2.10 103.40 30.59 11.74
S08 15.00 198.00 56.63 15.58
S09 11.20 21.30 37.98 5.45
S10 13.10 1513.30 60.29 25.16
S11 14.70 45.30 16.67 7.85
S12 4.30 126.70 57.51 2.79
S13 15.40 169.80 38.96 10.24
S14 4.20 62.50 58.14 14.76
S15 47.20 1234.60 69.29 28.33
S16 18.00 236.00 87.54 13.16
S17 35.20 559.10 103.45 12.95
S18 22.60 269.90 15.99 9.91
S19 38.40 137.80 141.30 24.76
S20 4.90 48.10 15.55 9.74
S21 10.70 315.50 79.99 22.02
S22 1.80 251.70 304.82 25.47
MV 15.06 ± 11.72 310.30 ± 407.36 62.00 ± 61.82 13.53 ± 7.70
Honey floral origin: Hyptis suaveolens (S02), Anacardium occidentale (S04), Spermacoce verticillata (S05), Mimosa verrucosa (S08), Piptadenia moniliformis (S09), Myracrodruon urundeuva (S15 and S19), Licania rigida (S17), Lippia sidoides (S18), Serjania sp (S20),
4 Conclusions
The average values of the physicochemical parameters and minerals found in the honey samples studied, with a few exceptions, were similar to those reported in the literature for good quality honeys. Among the minerals detected in the honey samples in the present study, K showed the highest concentration, followed by Ca, Na, and Mg, which is in agreement with the main minerals found in plants in general.
Comparing mineral contents, M. urundeuva honey sample had
the highest content among the four macrominerals studied (Na, K, Ca, and Mg). The protein content of A. occidentale honey was the highest, followed by the honey samples from M. urundeuva
and Z. joazeiro. One tablespoon spoon of honey from Ceará state a day is enough to obtain the amounts of macrominerals needed each day, mainly calcium and potassium. In a great number of studies, the assessment of the levels of different metals, especially heavy metals, has been a general objective aimed at characterizing different types of honey in view of safety implications. The analyses of the trace elements of honey samples from Ceará State showed that their production areas are free of the environmental pollution.
Acknowledgements
The authors acknowledge the financial support of FUNCAP (Ceará State Research Funding) and CNPq (National Council for Technological and Scientific Development, Brazil).
kg), and Na (11.69-218.50 mg/kg) showed a strong dependence on botanical origin. Franchini et al. (2007), analyzing 14 Brazilian commercial honey samples, determined trace metals by capillary zone eletrophoresis. The average contents of 656.00, 69.10, 71.80, 36.00, 21.40, and 1.70 mg/kg were found, respectively for K+, Ca2+, Na+, Mg2+, Mn2+, and Li+ in the honey
samples analyzed.
The honey samples from Ceará had lower values than those reported by Fernández-Torres et al. (2005). Przybylowski and Wilczyńska (2001), studying the mineral levels in honey samples from the Pomerania region, found an average value for Zn of 7.76 mg/kg, which exceeded the limits accepted by legislation in that region. Nanda et al. (2003) studied the presence of mineral content in six floral honey samples from different botanical sources in Northern India and found considerable variations in the concentrations of Na, K, Ca, Fe, Cu, and Zn.
The levels of K, Ca, Cu, Fe, Mg, Mn, and Zn have been evaluated in several Brazilian plant leaves(LOPES et al.,2002; SILVEIRA et al., 2009). Among these minerals, K had the highest content, followed by Mg and Ca. Lopes et al. (2002) analyzed
the mineral compositionof several medicinal plants grown in
Ceará State. The main minerals found in these plants in order of abundance were Ca > K > Mg > Na; although the order differs from that found in the present study for the honey samples from Ceará (K > Ca > Na > Mg), the main minerals are the same.
Table 4. Concentration of trace elements in honey samples of different floral origins from Ceará State.
Samples Cu Mn Zn Cr Se Fe
(mg/kg) (mg/kg) (mg/kg) (µg/kg) (µg/kg) (mg/kg)
S01 0.07 0.26 0.22 76.28 0.84 0.73
S02 0.44 0.61 1.14 22.50 1.68 1.10
S03 0.57 1.42 0.71 54.65 5.42 2.57
S04 0.52 0.55 0.92 73.20 1.84 2.44
S05 0.10 0.57 0.32 46.45 4.02 1.52
S06 0.38 0.50 0.61 170.33 1.44 1.01
S07 0.36 0.43 0.26 84.12 0.84 0.32
S08 0.72 0.97 0.57 110.55 2.20 0.89
S09 0.16 0.06 0.07 140.21 1.96 0.31
S10 0.53 1.96 1.17 84.43 15.82 3.07
S11 0.33 0.18 0.40 74.36 15.40 0.38
S12 0.16 0.71 0.21 52.15 17.40 2.28
S13 0.23 0.41 0.41 30.19 11.20 0.12
S14 0.31 0.47 0.61 32.20 0.36 0.17
S15 1.29 0.18 0.30 144.15 2.48 4.70
S16 0.55 0.68 0.14 100.60 2.02 0.61
S17 0.50 1.83 0.61 98.13 0.88 1.80
S18 0.34 0.73 0.27 96.00 0.56 0.45
S19 0.76 1.65 0.29 116.72 1.90 1.39
S20 0.43 0.11 0.11 34.50 1.28 0.32
S21 0.56 1.30 1.85 43.67 0.76 8.76
S22 0.57 1.62 1.24 44.06 62.00 0.62
MV 0.43 ± 0.27 0.80 ± 0.58 0.56 ± 0.44 77.17 ± 40.25 4.31 ± 5.28 1.58 ± 1.93
Monitoring and Assessment, v. 69, p. 267-282, 2001. PMid:11497382. http://dx.doi.org/10.1023/A:1010719107006
CRANE, E. O livro do mel. São Paulo: Nobel, 1983.
DESCHAMPS, E.; MATSCHLLAT, J. Arsênio antropogênico e
natural: um estudo em regiões do Quadrilátero Ferrífero. Belo Horizonte: Fundação Estadual do Meio Ambiente, 2007. 270 p. FERNÁNDEZ-TORRES, R. et al. Mineral content and botanical origin
of Spanish honeys. Talanta, v. 65, p. 686-691, 2005. PMid:18969853. http://dx.doi.org/10.1016/j.talanta.2004.07.030
FRANCHINI, R. A. A. et al. Rapid Determination of Hydrogen Peroxide Using Peroxidase Immobilized on Amberlite IRA-743 and Minerals in Honey. Journal of Agricultural and Food Chemistry, v. 55, n. 17, p. 6885-6890, 2007.
FRANCO, G. Tabela de Composição Química dos Alimentos. 9. ed. São Paulo: Atheneu, 2008. 307 p.
GHELDOF, N.; WANG, X. H.; ENGESETH, N. J. Identification and quantification of antioxidant components of honeys from various floral sources. Journal of Agricultural and Food Chemistry, v. 50, p. 5870-5877, 2002. PMid:12358452. http://dx.doi.org/10.1021/ jf0256135
LIBERATO, M. C. T. C. et al. Phenolic Content ann Antioxidant and Antiacetylcholinesterase Properties of Honeys from Different Floral Origins. Journal of Medicinal Food, v. 14, n. 6, p. 658-663, 2011. PMid:21554131. http://dx.doi.org/10.1089/jmf.2010.0097 LOPES, M. F. G. et al. Estudo mineral de plantas medicinais. Revista
Brasileira de Farmacognosia, v. 12, p. 115-116, 2002. http://dx.doi. org/10.1590/S0102-695X2002000300054
MAGALHÃES, M. S. Mel e pólen de abelhas Apis mellifera
como bioindicadores de poluição ambiental por metais pesados. 2010. 68 f. Dissertação (Mestrado em Ecologia de Biomas Tropicais)-Universidade Federal de Ouro Preto, Ouro Preto, 2010.
MAHAN, L. K.; ESCOTT-STUMP, L. Alimentos, Nutrição &
Dietoterapia. 11. ed. São Paulo: Roca, 2005. 1242 p.
NANDA, V. et al. Physico-chemical properties and estimation of mineral content in honey produced from different plants in Northern India. Journal of Food Composition and Analysis, v. 16, p. 613-619, 2003. http://dx.doi.org/10.1016/S0889-1575(03)00062-0 PAMPLONA, B. C. Exame dos elementos inorgânicos encontrados
em méis brasileiros de Apis mellifera e suas relações físico-biológicas. 1989. 131 f. Dissertação (Mestre em Biociências)-Universidade de São Paulo, São Paulo, 1989.
POHL, P. Determination of metal content in honey by atomic absorption and emission spectrometries. Trends in Analytical Chemistry, v. 28, n. 1, p. 117-128, 2009. http://dx.doi.org/10.1016/j. trac.2008.09.015
PRZYBYLOWSKI, P.; WILCZYŃSKA, A. Honey as an environmental marker. Food Chemistry, v. 74, p. 289-291, 2001. http://dx.doi. org/10.1016/S0308-8146(01)00153-4
RODRIGUEZ-OTERO, J. L. et al. Mineral content of the honeys produced in Galicia (North-west Spain). Food Chemistry, v. 49, p. 169-171, 1994. http://dx.doi.org/10.1016/0308-8146(94)90154-6 SARWAR, N. et al. Role of mineral nutrition in minimizing cadmium
accumulation by plants. Journal of the Science of Food and Agriculture, v. 90, n. 6, p. 925-937, 2010.
SEEMANN, P.; NEIRA, M. Tecnología de la producción apícola. Valdivia: Facultad de Ciencias Agrarias Empaste, Universidad Austral de Chile, 1988. 202 p.
SILVA, C. L.; QUEIROZ, A. J. M.; FIGUEIRÊDO, R. M. F. Caracterização físico-química de méis produzidos no Estado do
References
ABADIO FINCO, F. D. B.; MOURA, L. L.; SILVA, I. G. Propriedades físicas e químicas do mel de Apis mellifera L. Ciência e Tecnologia de Alimentos, v. 30, n. 3, p. 706-712, 2010. http://dx.doi. org/10.1590/S0101-20612010000300022
ABU-TARBOUSH, H. M.; AL-KAHTANI, H. A.; EL-SARRAGE, M. S. Floral-type identification and quality evaluation of some honey types. Food Chemistry, v. 46, p. 13-17, 1993. http://dx.doi. org/10.1016/0308-8146(93)90068-Q
ALMEIDA-ANACLETO, D.; MARCHINI, L. C. Comparação físico-química de amostras de méis de Apis mellifera L. provenientes do cerrado paulista. Boletim de Indústria Animal, v. 61, n. 2, p. 161-172. 2004.
ARRUDA, C. M. F. et al. Características Físico-Químicas de Méis da Chapada do Araripe/Santana do Cariri, Ceará. Acta Scientiarum Animal Sciences, v. 27, n. 1, p. 171-176. 2005.
ASSOCIATION OF OFFICIAL ANALYTICAL CHEMISTS - AOAC.
Official Methods of Analysis. 16th ed. rev. 4th. AOAC, 1998. AZEREDO, L. C. et al. Protein contents and Physicochemical properties
in honey samples of Apis mellifera of different floral origins. Food Chemistry, v. 80, p. 249-254, 2003. http://dx.doi.org/10.1016/ S0308-8146(02)00261-3
BENDINI, J. N.; SOUZA, D. C. Physicochemical characterization of the bee honey originating in cashew flowering. Ciência Rural, v. 38, n. 2, p. 565-567, 2008. http://dx.doi.org/10.1590/S0103-84782008000200047
BERETTA, G. et al. Standardization of antioxidant properties of honey by a combination of spectrophotometric/fluorimetric assays and chemometrics. Analytica Chimica Acta, v. 533, p. 185-191, 2005. http://dx.doi.org/10.1016/j.aca.2004.11.010
BOGDANOV, S.; RUOFF, K.; PERSANO ODDO, L. Physico-chemical methods for the characterization of unifloral honeys: a review.
Apidologie, v. 35, p. S4-S17, 2004. http://dx.doi.org/10.1051/ apido:2004047
BOGDANOV, S. et al. Honey quality and international regulatory Standards: review by the international honey commission. Bee World, v. 80, p. 61-69, 1999.
BOGDANOV, S.; MARTIN, P.; LÜLLMANN, C. Harmonised methods of the European Honey Comission. Apidologie, p. 1-59, 1997. Extra Issue.
BORSATO, D. M. et al. Physicochemical Quality Control of Bee Honeys from Campos Gerais Region of Paraná – Brazil. Boletim do CEPPA, v. 28, n. 2, p. 205-212, 2010.
BRADFORD, M. M. Rapid and sensitive method for quantification of microgram quantities of protein utilizing the principle dye binding.
Analytical Biochemistry, v. 72, p. 248-254, 1976. http://dx.doi. org/10.1016/0003-2697(76)90527-3
BRASIL. Ministério da Agricultura Pecuária e Abastecimento. Instrução Normativa nº 11, de 20 de outubro de 2000, Regulamento técnico de identidade e qualidade do mel. Diário Oficial da República Federativa do Brasil, Brasília, DF, 20 out 2000. Seção 1, p. 19696-19697.
CODEX ALIMENTARIUS COMMISSION - CAC. Official Methods
of Analysis, v. 3, p. S2, 1990.
CONTI, M. E. Lazio region (central Italy) honeys: a survey of mineral content and typical quality parameters. Food Control, v. 11, p. 459-463, 2000. http://dx.doi.org/10.1016/S0956-7135(00)00011-6 CONTI, M. E.; BOTRE, F. Honey bees and their products as potential
região litoral norte do estado da Bahia. Revista Agrícola, v. 77, p. 243-254, 2002.
STANKOVSKA, E.; STAFILOV, T.; SAJN, R. Monitoring of trace elements in honey from the Republic of Macedonia by atomic absorption spectrometry. Environmental Monitoring Assessment, v. 142, p. 117-126, 2008. PMid:17899416. http://dx.doi.org/10.1007/ s10661-007-9913-x
WHITE JUNIOR, J. W. H. Honey. Advances in Food Research, v. 24, p. 278-374, 1978. http://dx.doi.org/10.1016/S0065-2628(08)60160-3 Piauí para diferentes floradas. Revista Brasileira de Engenharia
Agrícola e Ambiental, v. 8, n. 2-3, p. 260-265, 2004. http://dx.doi. org/10.1590/S1415-43662004000200015
SILVEIRA, L. M. S. et al. Extração de minerais em planta de uso medicinal através da infusão e digestão por microondas. Revista Brasileira de Farmacognosia, v. 90, p. 144-147, 2009.