Correlation Between K, Mn, Fe, Cu and Zn in Natural
Honeys from
Eucalyptus
Sources
Silvânia V. M. Mattos
*1, Esther M. Bastos
1, Ilda O . Dayrell
1and David L. Nelson
2 1Divisão de Bromatologia e Toxicologia, Fundação Ezequiel Dias - Rua Conde Pereira Carneiro, 80 2Departamento de Alimentos, Faculdade de Farmácia – UFMG 30.510-010 Belo Horizonte, MG, BrazilABSTRACT
Thirty-five natural honey samples from three apicultural regions of the state of Minas Gerais, Brazil, were collected from honeybee hives under various climatic conditions over a two-year period. The beehives were located in the districts of Bom Jesus do Amparo, Barão de Cocais and São Gonçalo do Rio Abaixo, all within a 100 km radius of Belo Horizonte, Minas Gerais, Brazil. The pollinic spectrum, color and ash, moisture, K, Fe, Mn, Cu and Zn contents were determined. Elemental analysis were done by flame atomic absorption spectrometry. Accuracy and precision were verified by recovery tests and relative standard deviation, respectively. The mean mineral contents encountered were K = 1130; Mn = 3.88; Fe = 2.79; Zn = 2.34 and Cu = 0.54 µg/g. During the dry season, several species of Eucalyptus pollen grains predominated, with Vernonia pollen grains present in lower abundance. In the rainy season, there was an inversion of dominance. Statistical treatment of results, separated according to comb and season, showed statistically equivalent means, although some good correlation indices (p = 0.05) were obtained, e.g. between percent Eucalyptus pollen grains and Mn content (0.450), between Fe and Zn (0.698) and between K and Mn (0.738).
Key words: Honey; honey mineral content; pollinic analysis; Eucalyptus
*
Author for correspondence
INTRODUCTION
The main mineral elements present in honey are K, P, Mg, Al, Ca, Na, Fe, Mn, Cu, Zn, Cl, S and Si. However, some elements such as Pb, Cr, I, Mo, Co, Hg, Sb, Ni, Cd etc. may also occur naturally or because of contamination by environmental sources. Minerals act as components of skeletal structures, as cellular constituents or as regulators of body acidity, alone or in association with enzyme systems (PETROV, 1972). The mineral content of honey depends on the source of the flower nectar, climate, soil and season (PETROV, 1972; MOHAMED et al. 1982).
The present work deals with the K, Fe, Mn, Cu and Zn contents, pollinic spectrum, color, ash and moisture percentages of honey obtained from three apicultural regions of the state of
Minas Gerais, Brazil, in an attempt to establish a correlation between floral sources and the elements analysed.
MATERIALS AND METHODS
Site of honey collection
The samples were collected from Quadrilátero Ferrífero, an area of the state of Minas Gerais known for its iron mining (Figure 1). Three apiaries in the districts of Bom Jesus do Amparo, Barão de Cocais and São Gonçalo do Rio Abaixo,
Figure 1. Maps of Brazil and the state of Minas Gerais showing the districts where honey samples were collected: (Bom Jesus do Amparo, São Gonçalo do Rio Abaixo and Barão de Cocais)
Honey samples
Thirty-five natural honey samples were collected from three hives over a period of two years, from March, 1991 to March, 1993, under different climatic conditions. The whole comb was removed and the honey was extracted in the laboratory, samples being transferred in two plastic containers. Care was taken during the process to avoid contamination by mineral sources.
Pollen analysis
The plant having dominant pollen was identified in the samples. Honey sediments were prepared according to the method of LOUVEAU et al. (1970). A 10 g homogenised sample was dissolved in 20 mL of water and centrifuged for 3 to 5 minutes at 2500 rpm. The sediment was washed with 5 to 10 mL of distilled water. After 30 minutes, the material was centrifuged and the sediment was embedded in glycerine jelly without staining or previous application of acetolysis. More then 300 (usually more than 500) pollen grains in each honey sample were considered for final evaluation. Frequently, pollen from only one species was observed. Pollens from nectarless or wind-pollinated plants were noted separately. Identification of the pollen source was primarily based on the
pollen reference collection of the Mellissopalynology Laboratory of the Fundação Ezequiel Dias, supplemented with numerous specimens collected in the districts studied, as well as other plant collections.
Physico-chemical analysis
The color, moisture and ash contents were determined according to the AOAC methods (1984).
Determination of mineral content
Reagents and apparatus: All reagents were of analytical grade. Hydrochloric and nitric acids for trace metal analyses were obtained from Baker and Titrisol standard solutions were purchased from Merck. Distilled water was further purified via a Milli-Q reagent grade water system. All glass apparatus were cleaned by treatment with 10% HNO3 for 24 hr prior to analysis.
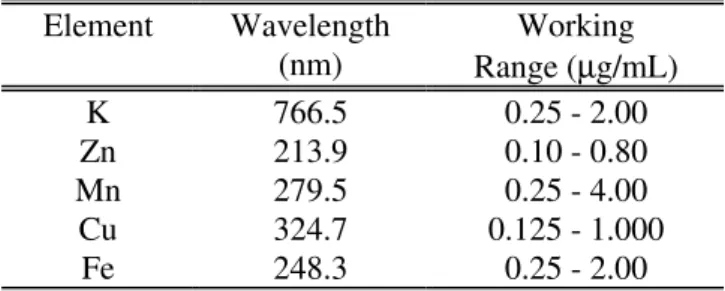
Table 1. Operational parameters for atomic absorption analyses
Element Wavelength
(nm)
Working Range (µg/mL)
K 766.5 0.25 - 2.00
Zn 213.9 0.10 - 0.80
Mn 279.5 0.25 - 4.00
Cu 324.7 0.125 - 1.000
Fe 248.3 0.25 - 2.00
Sample preparation
Fe, Mn, Cu, and Zn: A 5 g sample was heated at 450 °C in a muffle furnace. The ash was covered with a watch glass and digested in 5 mL 40% HNO3 for one hour. Samples were evaporated to dryness and were heated in the muffle furnace at 375 °C for another hour. The white ashes were dissolved in 3 mL 9.25% HCl and transferred to 25 mL volumetric flasks.
K: A 0.5 g sample was heated in a quartz crucible at 450 °C for approximately 10 hr. The ashes were moistened with 1mL 9.25% HCl and diluted to 100 mL. One mL 1% CsCl was added to 2 mL of this solution and the volume was made to 10 mL.
The results were calculated as an average of three determinations. Standards curves were fitted by the minimum square method. The accuracy was checked by the addition of known concentrations of standards. All concentrations of metals in analysed samples are expressed as µg/g dry weight after correction for the water content.
Statistical analysis
Annual observations could suggest reasons for differences in the honey quality which depended on the seasons (dry or rainy) and on environmental conditions of the three districts of an iron mining region. Data for the variables were submitted to analysis of variance using a completely randomised design to compare the different collection sites and seasons. The Student t test was used (STEEL, et al.1960). Five distinct treatments were considered by combining three districts and two seasons (dry and rainy) with unequal number of repetitions, since one dry season data from one district could not be obtained. Some of the variables had to undergo the logarithmic transformation6 when standard deviations were proportional to the means (for each treatment) obtained for color, K, Mn, Fe, Zn and Cu. To determine the correlation between all variables, a complete data set was formed, regardless of district or season. A higher efficiency was expected for this study when wider ranges for each variable were allowed, and this improvement was observed with this general data set.
RESULTS
Quantitative pollinic analysis detected an important influence of typical anthropical field species in samples during the period studied. In this context, honeys were classified according to the number of different pollens present in the samples. Honey samples produced during the dry season (April to October) were classified as wild with Eucalyptus dominance (Figure 2).
During the rainy periods, more varieties of plants were present in the fields and there was a dominance of Vernonia sp. pollen (Figure 3), with Eucalyptus pollen as accessory pollen
grains. The majority of the samples indicated the presence of honey-dew. Classification of samples according to botanical origin is presented in Table 2.
Figure 3. Micrographs of pollen grains in honey produced in rainy seasons. E - Eucalyptussp. (x 400), V - Vernoniasp. (x 400)
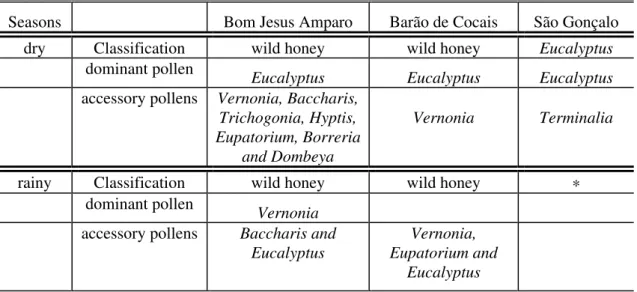
Table 2. Botanical origin of honeys, from April/1991 to March/1993
Seasons Bom Jesus Amparo Barão de Cocais São Gonçalo
dry Classification wild honey wild honey Eucalyptus
dominant pollen
Eucalyptus Eucalyptus Eucalyptus
accessory pollens Vernonia, Baccharis, Trichogonia, Hyptis, Eupatorium, Borreria
and Dombeya
Vernonia Terminalia
rainy Classification wild honey wild honey ∗
dominant pollen
Vernonia
accessory pollens Baccharis and Eucalyptus
Vernonia, Eupatorium and
Eucalyptus
∗ This comb was stolen in December, 1991, and collection terminated on that date.
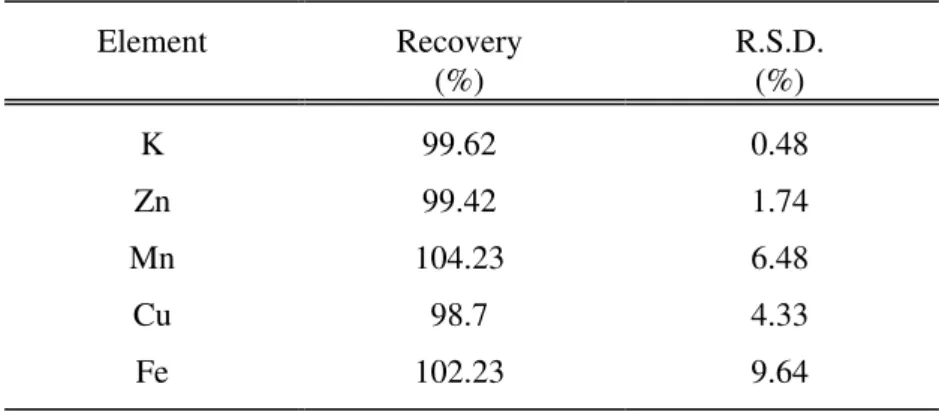
The results of recovery determinations for K, Zn, Mn, Cu and Fe are presented in Table 3. High recoveries and small relative standard deviations (RSD) were observed. The overall statistical treatments for mineral content, color,
Table 3. Results of addition standards method
Element Recovery
(%)
R.S.D. (%)
K 99.62 0.48
Zn 99.42 1.74
Mn 104.23 6.48
Cu 98.7 4.33
Fe 102.23 9.64
Table 4. Statistical means by districts and seasons∗ District
(season)
Colour mm
Moisture %
Ashes %
K (µg/g)
Mn (µg/g)
Fe (µg/g)
Zn (µg/g)
Cu (µg/g) Bom Jesus do
Amparo (dry)
0.8a 18b 0.2a 1079.4 a 3.39 a 2.05 a 1.99 a 0.63 a
Bom Jesus do Amparo
(rainy)
0.4a 19ab 0.1a 876.3 a 1.20 a 3.30 a 3.97 a 0.33 a
São Gonçalo
(dry) 1.4a 18ab 0.2a 1407.5 a 4.05 a 1.86 a 1.07 a 0.57 a
Barão de Cocais
(dry) 0.3a 18ab 0.2a 1135.0 a 5.99 a 2.16 a 1.26 a 0.69 a
Barão de Cocais
(rainy) 0.6
a
20a 0.2a 1154.2 a 4.79 a 4.56 a 3.39 a 0.46 a
∗
Means with common letters in the same column are statistically equivalent.Table 5. Correlations between all variables
colour % Euc % Ver K Mn Fe Zn
% Euc.a - 0.029
% Ver.b 0.086 - 0.799
K 0.275 0.254 - 0.079
Mn 0.155 0.450 - 0.291 0.738
Fe 0.103 - 0.058 0.163 0.199 0.229
Zn - 0.106 - 0.439 0.380 - 0.093 - 0.102 0.698
Cu - 0.002 0.438 - 0.305 0.390 0.531 0.014 - 0.008
ashes 0.218 0.039 - 0.029 - - -
-a
DISCUSSION
The pollen spectrum of honey produced in the Zona da Mata region of the state of Minas Gerais, with definite climate conditions, is geographically characterised by the dominance of several species of Eucalyptus and by having
Vernonia scorpioides as an accessory pollen during the dry seasons. During the rainy seasons, there is an inversion of dominance for
Vernonia scorpioides, with contributions by several species of Eucalyptus.
Since samples were produced in neighbouring areas, being subject to the same climatic and botanical influences, monthly sample collection led to similar results which were, as a whole, statistically equivalent. The color of the samples had statistically equivalent means and did not present significant correlation indices, contrary to results observed by other workers (PETROV, 1970; SCHUETTE, et al., 1932; WHITE, 1974.
The mineral levels encountered in the samples indicated that the floral contribution and season may affect the elemental content. Although an apparent difference in mineral contents was
observed in samples obtained from the same regions and during the same season, these differences were not statistically significant (Table 4). The floral sources of the honey affected the Mn, Cu, and Zn contents, but not that of Fe. The correlation coefficients (Table 5) showed that there was a positive correlation between the percentage of Eucalyptus pollen grains and the Mn and Cu contents, but a negative correlation with the Zn content. The opposite was observed with the percentage of
Vernonia pollen grains, a positive correlation being observed with Zn in this case.
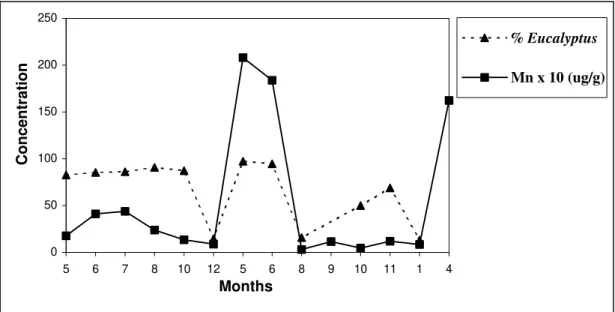
Figure 4 shows the monthly variation in Mn content and the percentage of Eucalyptus pollen grains in samples obtained in the Barão de Cocais district. As could be seen, during the period of May to July, when the Eucalyptus
species was in high fluorescence, there was a corresponding increase in the Mn content. On the other hand, the correlation for the Bom Jesus do Amparo district (Figure 5) was less evident since this region was richer in different floral species which no doubt contributed to the mineral composition.
0 50 100 150 200 250
5 6 7 8 10 12 5 6 8 9 10 11 1 4
Months
Concentration
% Eucalyptus
Mn x 10 (ug/g)
0 10 20 30 40 50 60 70 80 90
5 6 7 8 10 12 3 5 6 8 9 11 1 2 3
Months
Concentration
% Eucalyptus
Mn x10 (ug/g)
Figure 5. Eucalyptus pollen grains percentages and Mn contents (µg/g x10) in honeys from Bom Jesus do Amparo district, from 1991 to 1993.
Among the minerals, excellent positive correlations of K with Mn, Fe with Zn, Cu with Mn and K with Cu (Table 5) were observed. The highest positive correlation between metals was obtained for K with Mn (0.738). Since Mn is a relatively immobile element in plants and is not transported in the phloem as much as K, no clear relationship between them is to be expected. There was apparently no correlation between Mn and Zn, Fe and Cu, K and Zn or Zn and Cu.
Fe and Zn contents increased during the rainy season. This increase coincided with the dominance of Vernonia florescence during that period. Cu and Mn ions showed positive correlation coefficients with the percentage of
Eucalyptus pollen grains (0.438 for Cu and 0.450 for Mn). This correlation was inverted for those samples in which Vernonia was predominant (-0.305 and -0.291).
When the results obtained in this study were compared with those obtained in other countries (Table 6), some differences due to floral origin were observed, even in those samples for which
Table 6. Several results of metals in honeys
Country Floral Number
of Minerals (mg/kg) Ref.
origin samples K Mn Fe Zn Cu
Spain Eucalyptusa 36 Commercial
579.6 - 8.27 - 0.16 Bonvehí, 1989
Australia Eucalyptus 1 each of 4 species
548 -1785
- - - - Maurizio, 1975
Australia Eucalyptus 1 1030 7.74 25.88 1.61 0.48 Petrov, 1970;
Maurizio, 1975 Libya
(Tripoli)
Eucalyptus 1 148.2 - - - - Mohamed, 1982
Brazil/MG Eucalyptusb 35 1130.5 (486 -3201) 3.88 (0.17 -20.80) 2.79 (0.33 – 6.77) 2.34 (0.31 -8.45) 0.54 (0.10 -1.92) This work
Australia String bark (Dark)
- 1241 10 37 2.0 0.6 Petrov, 1972
Australia Clover 1 367 0.6 6.3 2.5 0.6
Maurizio, 1975
Australia Clover (light) - 441 0.8 9 3.0 0.8 Petrov, 1972
Italy several 7 - 0.33
-4.4
1.3 – 13.75
0.9 - 3.1 - D’Ambrosio, 1982
Yugoslavia - 43 - 3.0
-9.2
3.5 - 20.5 - 4.5
-18.0 Maurizio, 1975
Hungary Accacia 12 - 0.30 2.8 5.1 0.29
Maurizio, 1975
Iran - 17c 707 - 51 2.8 0.2 Ebrahimzadeh et al.
1979
South Africa Floral 17 141
-2945
0.06 -6.15
2.65 – 8.42
- 0.25
-0.83 Maurizio, 1975
USA
-(Dark)
- 1676 4.09 9.4 - 0.56 Schuette, 1932;
White, 1974
USA (NY) - 19 450
-20000
0.18 -12
0.41 - 40 0.18 - 5.6 0.13 -3.3
Tong, et al. 1975
a
Without honey-dew; b With honey-dew; cResults converted to ppm
ACKNOWLEDGEMENTS
The authors thank FAPEMIG for its financial support. Dr. D. L. Nelson was a recipient of a research fellowship from the Conselho Nacional de Desenvolvimento Científico e Tecnológico -CNPq.
RESUMO
Foram coletadas 35 amostras de mel natural
em diferentes condições climáticas, por um
período de dois anos. Os apiários se
localizavam nos distritos de Bom Jesus do
Amparo, Barão de Cocais e São Gonçalo do
Rio Abaixo, a cerca de 100 km de Belo
Horizonte, a capital do Estado de Minas
Gerais, Brasil. As amostras foram analisadas
quanto aos teores de K, Fe, Mn, Cu, Zn,
espectro polínico, cor, cinzas e umidade. As
médias encontradas foram: K = 1130; Mn =
3,88; Fe = 2,79; Zn = 2,34 e Cu = 0,54
µ
g/g.
No período de seca houve predomínio de
grãos de pólen de origem de espécies de
Eucalyptus
e, em menor extensão de
embora tenham sido obtidos índices
expressivos de correlação (p = 0,05), como
%
Eucalyptus
x Mn (0,450), ou entre Fe x
Zn (0,698) ou ainda entre K x Mn, de 0,738.
REFERENCES
AOAC Official Methods of Analysis of the Association of Official Analytical Chemists. (1984), 14th. ed., Arlington, AOAC, 500 pp. Bonvehí, J. S. (1989), Caracteristicas
Fisico-quimicas. Composicion de la miel de eucalipto (Eucaliptus sp.) producida en España. Anales de Bomatologia. v. XLI-1, 41-56.
D’ambrosio, M. and Marchesini, A. (1982), Recerche sull’ inquinamento ambientale da metalli pesanti effetuate su campioni di miele.
Atti Soc. Ital. Sci. v. 123, p.342-348.
Ebrahimzadeh, H. and Haghchenasse, F. (1979), Composition chimique de certains miels de l’Iran . I - Elements minéraux. Apidologie. v. 10, p.157-165.
Louveaux, J.; Maurizio, A.; Vorwohl, G. (1970), Methods of melissopalynology. Bee World. v. 5, p. 125-138.
Maurizio, A. (1975), Microscopy of honey. In:
Honey: a comprehensive survey, eds., London, Bee Research Association and Eva Crane, p.171-175.
McLellan, A. R. (1975), Calcium, magnesium, potassium and sodium in honey and in nectar secretion, J. Apic. Res. v. 14, p.57-61.
Mohamed, M. A.; Ahmed, A. A. and Mazid, M. M. (1982), Studies on Libyan honeys. J. Food Quality v. 4, p. 185-201.
Petrov, V. (1972), Minerals and nutritive value of honey. Amer. Bee J., v. 112, p. 54-56.
Petrov, V. (1970), Mineral constituents of some Australian honeys as determined by atomic absorption spectrometry. J. Apic. Res. V. 9, p. 95-101.
Schuette, H. A. and Remy, K. (1932), Degree of pigmentation and its probable relationship to the mineral constituents of honey. J. Amer. Chem. Soc. v. 54, p. 2909-2913.
Snedecor, G. W. and Cochran, W. G. (1967),
Statistical methods. Iowa City, Iowa State University, 3rd. ed., 539 pp.
Steel, R. G. D. and Torrie, J. H. (1960), Principles and procedures of statistics, with special reference to the biological sciences, New York, McGraw-Hill, 2nd ed., 418 pp.
Tong, S. S. C., Morse, R. A., Bache, C. A. and LISK, D. J. (1975), Elemental analysis of honey as an indicator of pollution. Arch. Environ. Health,
v.30, p.329-332.
White, JR., J. W. (1974), Composition y propiedades de la miel. In: La apicultura de los Estados Unidos, Mexico: Linusa, p.57-66.