ISSN 0101-2061 Food Science and Technology
DI:
D http://dx.doi.org/10.1590/1678-457X.07916
1 Introduction
Honey is a kind of directly consumed natural product, produced by honeybees - Apis mellifera L. from the nectar of blossoms or from exudates of trees and plants (Bertoncelj et al., 2007). Honey is described in Codex Alimentarius Standard and in Turkish Food Codex as a naturally sweet product produced by honeybees when they collect the nectars from the flowers of plants, convert their compositions, and place them into the cells of combs to mature (Food and Agriculture Drganization, 2001; Turkey, 2012). Honey contains in addition to sugars, amino acids, vitamins, minerals, lipids, enzymes and other phytochemicals, and also the presence of flavonoids and phenolic acids emphasizes the role of honey, along with fruits and vegetables, as a nutritional source of natural antioxidants responsible for protecting human health (Baltrušaityte et al., 2007; Gheldof et al., 2003; Gheldof & Engeseth, 2002; McKibben & Engeseth, 2002; Schramm et al., 2003; Silva et al., 2013; Tonks et al., 2003). Honey has very old history for human life since ancient times mainly as a sweetening agent, yet it has been also used as an ingredient of traditional medicines on account of its dietary and curative properties
such as antibacterial, anti-inflammatory and anti-tumoural (Drsolic et al., 2005; Pichichero et al., 2009; Swellam et al., 2003; Tonks et al., 2001).
Depending on the botanical origin of honeys, there is a wide variation with different tastes and colors, and the variations in nectar content, together with other factors such as climatic conditions, soil type, and beekeeper activities contribute to the existence of different types of honey (Anklam, 1998; Bogdanov et al., 2008; Pires et al. 2009).
Microscopic analysis is another analytical method for the identification of botanical origin. Namely quantitative and also qualitative content of honeydew particles and pollen grains is studied for the identification of honey group and the blossom origin, respectively. Dn this account, the microscopic analysis is able to detect the botanical origin much more exactly than other analytical methods. However, it is difficult to correctly interpret results of melissopalynology and it needs a lot of experiences (Demianowicz, 1961; Kropáčová, 1969; Přidal & Vorlová, 2002).
Characterization of Turkish honeys regarding of physicochemical properties,
and their adulteration analysis
Şeyda KIVRAK1*, İbrahim KIVRAK2,3, Erşan KARABABA1
Received 19 Mar., 2016 Accepted 15 May, 2016
1 Department of Nutrition and Dietetics, Faculty of Health Sciences, Muğla Sıtkı Koçman University, Muğla, Turkey
2 Department of Chemistry and Chemical Treatment Technologies, Muğla Vocational School, Muğla Sıtkı Koçman University, Muğla, Turkey 3 Research Laboratory Center, Food Analysis Laboratory, Muğla Sıtkı Koçman University, Muğla, Turkey
*Corresponding author: [email protected]
Abstract
This work was conducted to evaluate the quality of 54 honey samples from eighteen different origins from Turkey. Physicochemical properties were examined according to ADAC methods, total phenolic and flavonoid contents by a spectrophotometric method and authenticity of honeys by Combustion Module - Cavity Ring-Down Spectroscopy (CM-CRDS). The microscopic analysis of honey sediment (mellissopalynology) was carried out to identify and count the pollen to provide qualitative indicators to confirm botanical origin. The moisture, electrical conductivity and free acidity of honeys ranged from 15.56 to 18.39%, 0.143 to 2.006 mS.cm-1, 16.05 meq.kg-1 and 34.10 meq.kg-1, respectively. Diastase activity of sideritis honey was found highest. Honeys showed HMF level below 40 mg.kg-1. The highest proline was determined in thyme honey. The results showed that honeys contained eminent amounts of phenolics and flavonoids. δ13C values of honeys were more negative than -23.5‰. The C4% sugar ratios were lower than 7% value. The lowest glucose-fructose content was observed in eucalyptus, cedar and pine honey samples. The results obtained for physicochemical characteristics, total phenolic and flavonoid contents an authenticity analysis of Turkish honeys indicate a good quality level, adequate processing, good maturity and freshness. The discrimination between honey types was achieved by PCA.
Keywords: Combustion Module-Cavity Ring-Down Spectroscopy; C4 sugar; unifloral honeys; diastase; proline
As a result of mentioned natural properties, honey is expensive than that of any other sweetener, and it can, therefore, be a target of adulteration (Sivakesava & Irudayaraj, 2002). Adulteration is the very important authenticity issue, and it is increasingly important for consumers, producers, and regulatory authorities. Knowledge of the chemical characteristics of honey, as one of the respected health-promoting natural products, is of general interest in terms of their protection against adulteration (Arvanitoyannis et al., 2005). A major concern of food control is to ensure that honey is authentic in respect of the legislative requirements of the standards of the Codex Alimentarius (Food and Agriculture Drganization, 2001; Kečkeš et al., 2013).
The objectives of the present study were to investigate total phenolic and flavonoid contents, adulteration analyses and physicochemical properties of Turkish honey samples of eighteen different floral origins. Correlations between the parameters analyzed were also evaluated.
2 Materials and method 2.1 Chemicals and reagents
All chemicals and reagents used were of analytical grade. Sugar standards, 5-Hydroxymethyl-2-furfuraldehyde, gallic acid (GA), quercetin standards, folin–ciocalteu reagent were from Sigma-Aldrich (Sigma–Aldrich Chemie, Steinheim, Germany). Propanol, ninhydrin, tungstic acid, sulfuric acid and methanol were supplied from Merck Millipore (Merck KGaA, Darmstadt, Germany).
2.2 Honey sample collection
All honeys samples were obtained from experienced local beekeepers during the harvesting season 2014 at different locations across Turkey. The attribution of the botanical origin for honeys was confirmed by melissopalinological analysis (Louveaux et al., 1978). All samples were stored at room temperature until the time of their analysis. The honey samples were classified into eighteen groups, namely: cedar from Doğanhisar, Konya, eucalyptus from Gökova, Köyceğiz, Muğla, multifloral from Şemdinli-Yüksekova, Hakkari, rhododendron from İnebolu-Şenpazar, Kastamonu, vitex from Koçarlı-Karpuzlu, Aydın, carob from Datça-Marmaris, Muğla, clover from Karacadağ-Siverek, Diyarbakır, pine and heather from Marmaris-Gökova, Muğla, sunflower from Çumra-Karapınar, Konya, citrus from Finike-Demre, Antalya, sideritis and thyme from Datça, Muğla, chestnut from Akçakoca, Düzce, acacia from Hacılar, Burdur, lavender from Keçiborlu, Isparta, cotton from Çukurova, Adana, linden from Macahel, Borçka, Artvin with three samples of each type.
2.3 Determination of δ13C protein-honey, C
4 sugar% using
CM-CRDS
δ13C values of protein and of raw honey were determined by Combustion Module-Cavity Ring-Down Spectroscopy (CM-CRDS). After complete sample combustion to carbon dioxide, as described by ADAC method for δ13C of protein (Association of Dfficial Analytical Chemists, 2005). The adulteration (C4% sugar) content in honey samples was evaluated using following Equation 1.
Adulteration C4 sugar % = [(δ13C
Protein‰ - δ13CHoney‰)/ (δ13C
Protein‰ – (-9.7))] x100
(1)
The proteins in the honey sample were extracted according to the Association of Dfficial Analytical Chemists (2005). Briefly, the honey sample (12 g) was filtered into a centrifuge tube (50 mL) using a 40-mesh filter. Next, 4 mL ultra-pure water was added into the tube, and the mixture was vortexed for 30 s. The homogenized honey sample was placed into a water bath at 80 °C. A freshly prepared mixture of sodium tungstate (2 mL) and H2SD4 (2 ml, 0.335 mol.L-1) was added into the centrifuge tube and vortexed. The final mixture was incubated in a water bath at 80 °C until precipitates were visualized. When precipitation did not appear after half an hour from the first acid addition, 2 ml of 0.335 mol.L-1) H
2SD4 was added to the solution. This sequence was repeated twice with a break of half an hour in between. Then, 25 mL water was added into the tube. The solution was centrifuged for 5 min at 4000 rpm at room temperature. The supernatant, which was produced by the centrifuging process, was removed by the transfer method and the sediment in the lower part of the tube was dissolved with 50 mL water. The centrifuging process was repeated three times. After the fourth centrifuging process had been completed, the supernatant was discarded. The sediment in the lower part was placed on a watch glass to be dried at 80 oC in an oven for 3 h. The tin capsules for the raw honey and the dried protein were filled with 150 ± 50 µg of material and packed. They were placed on the automatic sampling table located in the combustion module of the device. 13C/12C analysis in the honey was monitored using a CM-CRDS instrument.
2.4 Determination of hydroxymethylfurfural content of honey samples using HPLC-VWD
The chromatographic analyses for determination of hydroxymethylfurfural content (HMF) of honey samples were carried out in an Agilent high performance liquid chromatography (HPLC) equipped with a variable wavelength (VWD) detector, and executed using a ChemStation Software.
For the determination of HMF analysis, a Hypersil DDS reversed phase column, isocratic elution with methanol/water (10:90) was used, at a flow rate of 1.0 mL.min-1 and detection at 285 nm (Mendes et al., 1998).
2.5 Determination of total monosaccharides content of honey samples using HPLC-RID
2.6 Physicochemical characteristics
Honeys were analyzed according to ADAC methods diastase activity, electrical conductivity, proline content, pH, free acidity and moisture content (Association of Dfficial Analytical Chemists, 1990; International Honey Commission, 2002). Three replicate analyses were performed for each honey sample.
Diastase activity was measured using a buffered soluble starch solution and honey, which was incubated in the thermostatic bath at 40 °C. Absorption was followed an UV/VIS spectrophotometer and a chronometer. Results were expressed (as Scade units) as ml of 1% starch hydrolyzed by enzyme in 1 g of honey, in 1 h.
Electrical conductivity of a honey solution at 20% (dry matter basis) was measured at 20 °C in CD2-free deionized distilled water using conductivity meter, and the results were expressed as μS.cm−1.
Proline content in honey samples was measured using a 5 g honey in 100 mL distilled water. 0.5 mL of solution was put into test tube then 1 mL of formic acid, ninhydrin solution proline standard solution were added into tube. And then it was boiled in hot water for 15 min, it was incubated for 15 min at 70 oC in water bath. After the tube was cooled down for 45 min. Absorption was followed an UV/VIS spectrophotometer at 510 nm.
The pH was measured by a pH-meter with a precision of ±0.002 pH units. The pH of the honey was measured in solution of 10 g honey in 75 mL of CD2 free distilled water.
Free acidity was determined by a titrimetric method: 0.1 M NaDH was added to 10 g honey in 75 mL free CD2 distilled water until a pH value 8.30. Results were expressed as meq.kg-1. All measurements were performed in triplicate.
Moisture was determined by refractometer. All measurements were performed at 25 °C.
2.7 Determination of total flavonoid content and total phenolic contents
Concentrations of total flavonoid content (TFC) and total phenolic content (TPC) were measured using the methods previously reported (Arvouet-Grand et al., 1994; Meda et al., 2005).
The Folin–ciocalteu method was used to determine total phenolic content using method previously reported (Meda et al., 2005). Each honey sample (5 g) was diluted to 50 mL with distilled water and filtered through Whatman No. 1 paper. This solution (0.5 mL) was then mixed with 2.5 mL of 0.2 N Folin–ciocalteu reagent for 5 min and 2 mL of 75 g.L-1 sodium carbonate was then added. After incubation at room temperature for 2 h, the absorbance of the reaction mixture was measured at 760 nm against a methanol blank. Gallic acid (GA) was used as a standard. The mean of three readings was used and the total phenolic content was expressed in mg of gallic acid equivalents (GAE) in 100 g of honey.
The total flavonoid content was determined using the Dowd method as adapted by Arvouet-Grand et al. (1994). Briefly, 5 mL of 2% aluminium trichloride in methanol was mixed with
the same volume of a honey solution (0.01 or 0.02 mg.mL-1). Absorption readings at 415 nm were taken after 10 min against a blank sample consisting of a 5 mL honey solution with 5 mL methanol without aluminum trichloride. The total flavonoid content was determined using quercetin as a standard. The mean of three readings was used and expressed as mg of quercetin equivalents (QE) in 100 g of honey.
2.8 Statistical methods
The mean value and standard deviation (SD) was calculated from the experimental data of adulteration analysis. Analyses of variance (ANDVA) were performed to determine significant differences between independent variables (P < 0.05) using the STATISTICA for Windows release software (Statsoft, 1995). Variable means were compared by Least Significant Difference (LSD) range test. Principal component analysis (PCA) and hierarchical cluster analysis (HCA) were performed with STATISTICA for Windows release software (Statsoft, 1995) to classify and discriminate among the honey samples and physicochemical parameters except pH.
3 Results and discussion
Honey may be designated according to floral or plant source if it comes wholly or mainly from that particular source and has the organoleptic, physicochemical and microscopic properties corresponding with that origin (Bogdanov et al., 2005).
3.1 δ13C analysis of honey and its protein (‰) and C
4%
sugar adulteration ratio
The average values and standard deviations of isotope ratio of 18 different types of honey samples were reported using Combustion Module-Cavity Ring-Down Spectroscopy (CM-CRDS), were presented in Table 1. The average carbon isotope ratios determined in protein and honey fractions of honey samples were very close each other. The average values varied between -24.7‰ and -27.0‰ for δ13C
protein, while it ranged between -24.1‰ and -26.7‰ for δ13C
honey.
All eighteen types of δ13C values were more negative than -23.5‰ according to ADAC 998.12 (Association of Dfficial Analytical Chemists, 2005) . This limit intended to detect cane and corn sugar addition to honey. According to data given in Table 1 adulteration was not detected in studied honey samples. 13C/12C isotope ration measurements give basic knowledge about the sources of honey from C4 plants, however, the standard quality properties such as diastase activity, HMF content, electrical conductivity and moisture measurements are needed to understand the quality of a honey sample (Simsek et al., 2012; Szezęsna & Rybak-Chmielewska, 2004; Yanniotis et al., 2006; Zappala et al., 2005). These parameters were analyzed in detail by the present study.
Average δ13C
protein values of lavender, cedar and pine honeys vary between -24.7‰ and -25.2‰, while average δ13C
honey values ranged between -24.1‰ and -24.9‰. Dn the contrary, average δ13C
protein values of sideritis, eucalyptus and thyme honeys varied -26.6‰ and -27.0‰, while average δ13C
-26.1‰ and -26.7‰. The difference between average values of C isotope ratios of protein and honey fractions (δ13C
protein–δ13Choney) of lavender, cedar, sideritis, carob and thyme honeys appeared in a narrow range between -0.5‰ and -0.7‰.
The average difference between δ13C value of honey and its protein (∆δ13 ‰) fractions for the studied honey samples ranged between 0.0‰ and -1.0‰. In this calculation, the difference has been taken as negative for samples of which δ13C
protein value is more negative than δ13C
honey value, whereas it has been taken as positive for samples of which δ13C
protein value is more positive than δ13C
honey value. The differences between the ∆δ13C values of honey and its protein fractions must not exceed 1‰ which provides the international benchmark at 7% sugar added. This differences were used for the calculation the average C4% sugar ratios that ranged between 0.0% and 5.9%. The C4% sugar ratios for all of the studied honey samples were lower than 7% value that is the legally permitted level by the authority (Association of Dfficial Analytical Chemists, 2005).
3.2 Physicochemical and chemical properties
The physicochemical and chemical properties (HMF, total monosaccharides, free acidity, pH, electrical conductivity, moisture content, diastase and proline) of honey samples are shown in Table 2. A significant difference was found among honey types on all parameters.
The average moisture content ranged from 15.56 to 18.39%. The moisture content is also of great importance because it is considered to be a useful parameter for describing moistness and viscosity of honey, and also subjected to several factors, for example climatic factors, the harvesting season, the degree of maturity reached in the hive and environmental factors (Pires et al., 2009). Furthermore, the water amount of honey
associated to its botanical origin (Liberato et al., 2013). All the honey samples contained less than 20% moisture content which is regulated for safety against fermentation. This is the maximum value allowed by European and Turkey legislations for honey (Food and Agriculture Drganization, 2001; Turkey, 2012). Moisture is the key criterion that determines the ability of honey to remain fresh and free of fermentation (Bogdanov et al., 1999; Silva et al., 2009). In this study, the highest moisture content was determined on citrus, sunflower and acacia honeys. Dn the contrary, the lowest mean value was found for the cedar and pine honeys. The moisture content of rest of honeys changed between 16.21 and 18.39%. In the previous study, it reported values of moisture varying between approximately 16 and 20% in honey samples from various locations of Turkey, and these results are close to those obtained in the present study which includes moisture contents for acacia honey as the highest and pine honey as the lowest are in good accordance with the results of Can et al. (2015).
The electrical conductivity of honey varies according to the floral origin and related to the concentration of mineral salts, organic acids and protein content. Value of the electrical conductivity of honey depends on honey raw materials. Presence of a honeydew that is a rich source of mineral compounds increases value of conductivity of honey (Majewska et al., 2010). This parameter produces variation based on the floral origin and it is important for the differentiation of honeys of different floral origins (Terrab et al., 2002). Electrical conductivity (EC) values of the studied honeys ranged from 0.143 to 2.006 mS.cm-1. The highest levels were determined in chestnut, pine and cedar honeys with average values of 2.006, 1.316 and 1.283 mS.cm-1, respectively. Due to the fact that they are appreciated as a honeydew honey, and their EC were higher than 0.8 mS.cm-1 as being honeydew honey. Eucalyptus honey similarly displayed
Table 1. δ13C isotope ratio and %C
4 sugar content of Turkish honeys.
Honey types δ 13C protein(‰) δ 13C honey(‰) protein-honey (‰)δ 13C difference Adulteration (%C
4)
Honey quality
Cedar -25.2 ± 0.2 -24.5 ± 0.3 -0.7 4.5 Pure
Eucalyptus -26.7 ± 0.3 -26.7 ± 0.2 0.0 0.0 Pure
Multiflower -26.5 ± 0.3 -26.3 ± 0.3 -0.2 1.2 Pure
Rhododendron -26.5 ± 0.2 -26.5 ± 0.2 0.0 0.0 Pure
Vitex -26.0 ± 0.1 -26.0 ± 0.2 0.0 0.0 Pure
Carob -25.6 ± 0.2 -25.0 ± 0.2 -0.6 3.8 Pure
Clover -25.8 ± 0.2 -25.7 ± 0.2 -0.1 0.6 Pure
Pine -25.2 ± 0.2 -24.9 ± 0.1 -0.3 1.9 Pure
Sunflower -25.6 ± 0.1 -25.5 ± 0.2 -0.1 0.6 Pure
Citrus -26.6 ± 0.3 -25.6 ± 0.2 -1.0 5.9 Pure
Heather -25.3 ± 0.2 -25.1 ± 0.4 -0.2 1.3 Pure
Thyme -26.6 ± 0.3 -26.1 ± 0.4 -0.5 3.0 Pure
Chestnut -26.4 ± 0.3 -26.2 ± 0.3 -0.2 1.2 Pure
Sideritis -27.0 ± 0.1 -26.5 ± 0.2 -0.5 2.9 Pure
Acacia -25.9 ± 0.1 -25.9 ± 0.1 0.0 0.0 Pure
Lavender -24.7 ± 0.3 -24.1 ± 0.3 -0.6 4.0 Pure
Cotton -25.7 ± 0.2 -25.7 ± 0.2 0.0 0.0 Pure
Linden -25.5 ± 0.2 -25.3 ± 0.2 -0.2 1.3 Pure
also high EC value. Moreover, the lowest EC was 0.143 mS.cm-1 in acacia honey. Rest of honey types showed lower conductivity than allowable upper limit 0.8 mS.cm-1.
Honey acidity is related to having organic acids, especially gluconic acid, in equilibrium with their corresponding lactones or internal esters, and to inorganic ions, mainly phosphate, sulphate and chloride (Silva et al., 2009; Terrab et al., 2002). Free acidity values ranged between 16.05 meq.kg-1 (clover honey) and 34.10 meq.kg-1 (citrus honey). According to the Council Directive 2001/110/EC (European Union, 2001), allowable upper limit for free acidity is 50 meq.kg-1 (European Union, 2001). None of the tested honey was exceeded upper limit value. Citrus honey had the highest free acidity, also acacia and sunflower honeys showed more than 30 meq.kg-1. The lowest value was found in clover honey samples. Chestnut, cedar and vitex honey had less than 20 meq.kg-1 of free acidity level.
pH of honey is influenced from the circumstances of extraction and storage, affecting texture, stability and shelf-life final product. Indeed, honey pH is related to microbial growth, due to bacterial growth occurring in a neutral and mildly alkaline environment; however, yeasts and moulds are found in an acidic environment (pH = 4.0 – 4.5) and do not grow well in alkaline media (Conti, 2000; Silva et al., 2009). According to previous reports, the pH of honey is between 3.2 and 5.5 (Bogdanov et al., 2004; Karabagias et al., 2014). Similarly, in the present study, the pH ranged from 3.33 (for cedar honey) to 5.54 (for chestnut honey). Additionally, multiflower, rhododendron, carob, pine, heather, thyme, sideritis, linden and citrus honeys showed similar pH values, between 4.03 and 4.51. Dur results are in good agreement with previous researches for the same type of honeys.
Diastase acts in the digestion of starch and is secreted from the honeybee’s stomach one such parameter. Diastase activity is mostly recognized for the evaluation of honey freshness and/or overheating (Can et al., 2015). The Council Directives 2001/110/EC (European Union, 2001) do not permit less than 8 Scade units. In this present study, diastase activity of honey samples ranged from 8.09 to 25.67 Scade units, for citrus and sideritis honey, respectively. Diastase activity for all honey types was detected higher than minimum level 8 Scade units. Sideritis, thyme, multiflower, linden honeys exhibited higher diastatic activity than 20 Scade units. These results approved that all of honey samples were not overheated or prolonged storage.
HMF content is commonly recognized as a parameter of freshness for honeys. It is well-known that warm-up operation of honey results in the formation of HMF (Belitz & Grosch, 1999). In a fresh honey it can be detected very little HMF, but its content increases during storage of honey as it is observed in diastase activity. Increased HMF content may be indication of overheating of honey during filtration or recrystallization, as well as an adulteration of honey by invert sugar (Juszczak et al., 2013). In the present study, HMF content ranged from 0.58 to 4.25 mg.kg-1, sideritis and cedar honey, respectively. All honey samples showed HMF level below 40 mg.kg-1 of honey which is allowed upper limit by European Council (European Union, 2001). Dnly cedar honey samples showed HMF level above 4 mg.kg-1, which is tenfold lower than acceptable limit. Citrus, eucalyptus and clover honeys had HMF content between 3 and 4 mg.kg-1. The other analyzed honeys contained less than 2.08 mg.kg-1 HMF content.
Proline is one of the non-essential amino acid and one of the most important amino acids, found in human body and nature. It is located in collagen structure. In this study, except acacia
Table 2. Physicochemical and chemical properties of Turkish honeys.
Honey types
Moisture content
(%)
Electric conductivity
(mS.cm-1)
Free acid (meq.kg-1) pH
Diastase activity
(Scade units)
Proline content (mg.kg-1)
HMF content (mg.kg-1)
Total mono-saccharides
(%)
Total phenolic content (mg GAE.100g-1)
Total flavonoid content (mg QE.100g-1)
Cedar 15.56 i 1.283 b 18.67 m 3.33 i 10.96 k 592.10 ij 4.25 a 54.76 l 57.22 m 3.70 g
Eucalyptus 16.40 h 0.970 c 21.36 j 3.69 gh 9.40 l 455.03 k 3.12 b 54.03 m 80.91 g 3.09 h
Multiflower 17.16 def 0.373 gh 22.33 hi 4.38 bcd 21.46 c 756.32 f 1.43 cd 68.56 d 61.14 k 3.72 fg
Rhododendron 16.92 fg 0.466 f 20.59 k 4.03 ef 12.26 i 832.61 d 1.89 c 67.50 e 67.95 i 2.00 j
Vitex 17.10 ef 0.326 i 19.44 l 3.98 f 12.68 h 809.73 de 2.08 c 61.55 j 65.51 j 4.30 d
Carob 17.61 cd 0.533 e 26.46 f 4.24 cde 11.39 j 722.25 g 1.30 cde 63.11 h 94.39 d 4.04 de
Clover 16.58 gh 0.250 j 16.05 n 3.84 fg 8.15 m 445.40 k 3.09 b 63.53 g 37.04 n 3.30 h
Pine 15.64 i 1.316 b 26.00 fg 4.34 bcd 13.09 g 565.55 j 1.55 cd 54.80 l 99.42 c 2.33 i
Sunflower 18.28 ab 0.326 i 30.43 c 3.56 h 12.53 hi 801.30 e 2.02 c 70.18 c 88.79 f 3.91 efg
Citrus 18.39 a 0.273 j 34.10 a 4.51 b 8.09 m 344.74 l 3.87 ab 63.52 g 58.91 l 3.99 ef
Heather 17.31 de 0.760 d 28.24 d 4.22 de 12.44 hi 865.22 c 1.58 cd 62.25 i 64.51 j 6.21 c
Thyme 16.23 h 0.416 g 25.52 g 4.44 bc 22.17 b 1778.87 a 0.79 de 72.00 a 106.46 a 9.01 a
Chestnut 16.21 h 2.006 a 17.97 m 5.54 a 15.44 f 666.74 h 1.66 c 58.99 k 97.66 d 9.24 a
Sideritis 16.51 gh 0.350 hi 22.99 h 4.38 bcd 25.67 a 1252.79 b 0.58 e 71.06 b 103.24 b 7.99 b
Acacia 18.15 ab 0.143 k 32.41 b 3.56 h 8.12 m 283.43 m 1.79 c 59.05 k 19.11 p 1.12 k
Lavender 18.00 abc 0.400 g 22.01 ij 3.71 gh 18.26 e 747.48 fg 1.68 c 64.95 f 71.76 h 3.33 h
Cotton 17.09 ef 0.253 j 20.13 kl 3.85 fg 9.08 l 322.07 l 1.92 c 58.89 k 34.24 o 1.13 k
Linden 17.85 bc 0.473 f 27.29 e 4.42 bcd 20.47 d 602.61 i 1.86 c 70.04 c 62.10 k 2.07 ij
honey samples, obtained slightly lower amount than acceptable level of proline, rest of the honey samples possessed quite high proline content. The highest proline amount was found in thyme and the lowest in sideritis honey, 1778.87 and 283.43 mg.kg-1, respectively. In the previous study on amino acid profile of these honeys, it was reported that some specific characteristics related to amino acids as properties of floral origin of honey can indicate a higher degree of variability, though most of the honeys contained 20 amino acids (Kıvrak, 2015). The high level of proline content in the studied honeys is in good consistency with that in other European honeys (Cotte et al., 2004; Kečkeš et al., 2013; Rebane & Herodes, 2008).
Analysis of honey sugar was executed with HPLC-RID and the percentage (%) values for monosaccharides per 100g are displayed in Table 2. Glucose and fructose represent the largest portion of honey composition. According to results, thyme, sideritis, sunflower and linden contained higher than 70% total monosaccharides. Total monosaccharide levels of honey ranged from 54.03% to 72.00%. The lowest glucose-fructose content was observed in eucalyptus honey. Cedar and pine honey samples displayed similar to eucalyptus honey for total monosaccharide level. Thyme, sideritis, sunflower, linden, multiflower, rhododendron, lavender, clover, citrus, carob, heather and vitex honey samples involved more than 60% monosaccharide content, which is compatible with the codices, allowable lowest level by European Council (European Union, 2001). These obtained values are in accordance with acceptable range for honey (Bogdanov et al., 1999) and similar to those obtained with others Turkish honeys (Can et al., 2015; Senyuva et al., 2009).
3.3 Total phenolic and flavonoid contents
Polyphenolics are phytochemicals which show wide structural varieties. They are classified into three major groups: phenolic acids, flavonoids, and tannins (Kečkeš et al., 2013).
Total phenolic contents (TPC) of the all analyzed honey samples ranged from 106.46 to 19.11 mg GAE.100g-1. Analysis
of variance (ANDVA) results implied that all types of honey samples indicated statistically different LSD group for phenolic content (Table 2).
Similar to physicochemical parameters thyme honey samples held highest TPC. It is followed by sideritis honey samples as second. Moreover, pine, chestnut and carob honey samples involved quite high TPC. Besides that acacia honey samples contained lowest TPC, and cotton, clover, cedar and citrus honeys possessed respectively low TPC among others.
Total flavonoid contents (TFC) were determined in all types of honey samples. Data were shown in Table 2. Flavonoids are low molecular weight phenolic compounds that are vital components for the aroma properties and antioxidant capacities of honey. TFC varied between 1.12 and 9.24 mgQE.100g-1. The differences between the different honey types were significant (p > 0.05). Chesnut honey samples had highest level as 9.24 mgQE.100g-1, in consistent with the previous study Can et al. (2015). Additionally, thyme, sideritis and heather honey samples had flavonoid content more than 6 mgQE.100g-1 level. TFC of acacia and cotton honeys were 1.12 and 1.13 mg.kg-1, respectively. These results indicate that the phenolic composition of honeys is influenced by the floral origins.
3.4 Principal component analysis and hierarchical cluster analysis
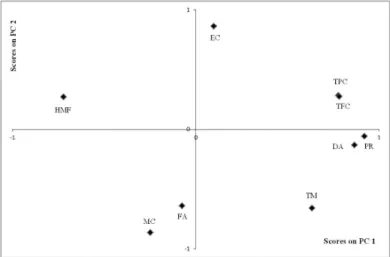
Principal component analysis (PCA) and hierarchical cluster analysis (HCA) are two main approaches in chemometrics, and they are widely used for the classification study in the field of food research (Yu, 2005). PCA is a statistical data reduction method. It transforms the original set of variables to a new set of uncorrelated variables called principal components (PCs). By plotting the PCA scores, it is possible to visually assess similarities between samples and determine whether samples can be grouped. PCA was generated four significant principal components (PCs) explaining 41.72, 28.28, 10.66 and 6.72% of the variance respectively. Figure 1 is a plot of principal component loadings of quality properties on the first and second principal components, PC1, PC2. PC1 explained mainly variation in
HMF which was in negative area, and, in proline, diastase, TFC, TPC, and total monosaccharides which were in positive area. PC2 represents the positive variations in electrical conductivity, HMF, TFC and TPC, and the negative variations in moisture content, total monosaccharide, proline, diastase, free acids of honey samples. The third component, PC3, accounted for 10.66% of the total variance and was dominated by free acid.
The loadings indicated that the HMF was negatively correlated with TFC, TPC, proline content, diastase activity and total monosaccharides as described by PC2. This indicates that honey quality increasing as the value of PC1 became increasingly positive (Figure 1). TPC was related to TFC, proline and diastase activity, and were negative correlated with HMF content. This demonstrates that higher HMF content lower quality of honey. It is well known that honey heating results in the formation of HMF, which is produced during acid-catalyzed dehydration of hexoses, such as fructose and glucose (Belitz & Grosch, 1999). As it is recognized for the parameter of freshness,
affected from storage conditions and floral sources (Fallico et al., 2004; Silva et al., 2009; Terrab et al., 2002).
Proline, diastase activity, total flavonoid and total phenolic contents, total mono saccharides, and HMF loaded similarly on both of PC plots (Figure 1 and 2). Free acids, moisture content, electrical conductivity and HMF were on the negative side of PC3 and negatively correlated with proline content, diastase activity and total monosaccharides.
PCA of the honey samples are represented in Figure 3. Thyme and sideritis honey samples differed from the other types of honeys and clustered on positive side of PC1. In contrast, cedar, eucalyptus, clover, cotton, citrus and acacia honeys were on the negative side of PC1 and overlapped in the high HMF direction as shown previously in Figure 1. This signifies that thyme and sideritis honey samples have respectively eminent quality according to the European Community regulation than those of other types of honeys which were on the negative side of PC1. The rest of honeys clustered around the center of score plot. Moreover, chesnut honey was the only honey type displayed
Figure 2. PCA loadings of quality properties on the first and third principal components. HMF: 5-hydroxymethylfurfural; MC: moisture content; FA: free acidity; EC: electrical conductivity; TM: total monosaccharides; DA: diastase activity; PR: proline content; TFC: total flavonoid content; TPC: total phenolic content.
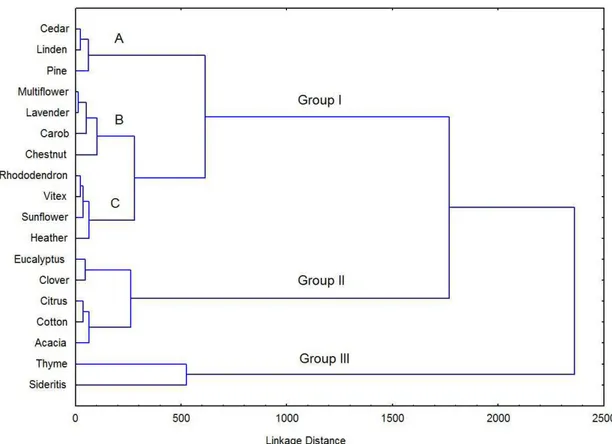
in the positive side of PC1 and PC2. This finding overlapped with higher total flavonoid and total phenolic content, and electrical conductivity values as those were exhibited in Figure 1. Searching for grouping among the honey samples to provide complementary information to the factor analysis, it was used hierarchical agglomeration according to Ward’s method and to the average linkage weighted pair group algorithm. This permit the explanation of 100% variance (Liebig et al., 1992). Hierarchical cluster analysis (HCA) involves a measurement of the similarity between objects to be clustered, and samples with the maximum similarities were clustered preferentially (Yi et al., 2013). In this study, the ten determined components of the 54 honey samples was inputted into STAT as variables, between group average linkage method was applied to sort honey types into groups, and rescaled distance was selected as measurement to obtain a HCA dendrogram shown in Figure 4. The first graphical evidence is that samples can be divided into three main groups. The first cluster can be divided into three sub-groups as, sub-group A: cedar, linden, pine honeys; sub-group B: multiflower, lavender, carob, chestnut honeys; sub-group C: rhododendron, vitex, sunflower, heather honeys. Cedar honeys, having high HMF content, would have appeared second cluster; however, other physicochemical properties of cedar honeys placed it in fist cluster. The second cluster included eucalyptus, clover, citrus, cotton and acacia honeys. This finding was overlapped with negative side of PC1 in Figure 3 and high HMF direction of Figure 1. The third cluster included thyme and sideritis honeys. This finding confirmed high proline content and diastase activity, and less than 1 mg.kg-1 of HMF content for thyme and sideritis
honeys. This observation decided the physicochemical properties of those honeys were distinctive.
4 Conclusion
The present research furnished a detailed qualification of 54 honey samples from eighteen different Turkish origins. Turkish honeys indicate a good level of quality, maturity and freshness. All honey samples of all the origin had the qualified required standards with no adulteration. Determination of adulteration percentage in honey using Combustion Module-Cavity Ring-Down Spectroscopy (CM-CRDS) was reported for the first time in this study. Physicochemical and chemical analyses of honey samples are in agreement with the European and Turkish legislations. The results of this study present that the distribution of total phenolic and flavonoids is affected by the floral origin of honey, based on the botanical origins of honeys to the point of contributing to their differentiation. The discrimination between honey types was achieved by Principal Component Analysis and Hierarchical cluster analysis. In the light of results, it was revealed the natural honey properties of Turkish honeys. The natural Turkish honeys can be suggested children, adult and athletes. The studied honey types could be characterized as natural Turkish honey.
References
Anklam, E. (1998). A review of the analytical methods to determine
the geographical and botanical origin of honey. Food Chemistry,
Arvanitoyannis, I. S., Chalhoub, C., Gotsiou, P., Lydakis-Simantiris, N., & Kefalas, P. (2005). Novel quality control methods in conjunction with chemometrics (multivariate analysis) for detecting honey
authenticity. Critical Reviews in Food Science and Nutrition, 45(3),
193-203. http://dx.doi.org/10.1080/10408690590956369. PMid:16048148. Arvouet-Grand, A., Vennat, B., Pourrat, A., & Legret, P. (1994).
Standardisation d’un extrait de propolis et identification des
principaux constituants. Journal de Pharmacie de Belgique, 49(6),
462-468. PMid:7884635.
Association of Dfficial Analytical Chemists – ADAC. (2005). Official
method of analysis, 998.12, C4 plant sugars in honey. International
standard stable carbon isotope ratio method (Chapter 44:27-30).
Gaithersburg: ADAC.
Association of Dfficial Analytical Chemists – ADAC. (1990). Official
methods of analysis of the Association of Official Analytical Chemists
(15th ed., Methods 954.11-979.21, 977.20 1028–1030). Arlington: ADAC.
Baltrušaityte, V., Venskutonis, P. R., & Čeksteryte, V. (2007). Radical scavenging activity of different floral origin honey and beebread
phenolic extracts. Food Chemistry, 101(2), 502-514. http://dx.doi.
org/10.1016/j.foodchem.2006.02.007.
Belitz, H. D., & Grosch, W. (1999). Food chemistry. New York: Springer.
http://dx.doi.org/10.1007/978-3-662-07281-3.
Bertoncelj, J., Dobeřsek, U., Lamnik, M., & Golob, T. (2007). Evaluation of the phenolic content, antioxidant activity and colour of Slovenian
honey. Food Chemistry, 105(2), 822-828. http://dx.doi.org/10.1016/j.
foodchem.2007.01.060.
Bogdanov, S., Jurendic, T., Sieber, R., & Gallmann, P. (2008). Honey
for nutrition and health: a review. Journal of the American College
of Nutrition, 27(6), 677-689. http://dx.doi.org/10.1080/07315724.2
008.10719745. PMid:19155427.
Bogdanov, S., Lüllmann, C., Martin, P., von der Dhe, W., Russmann, H., Vorwohl, G., Dddo, L. P., Sabatini, A.-G., Marcazzan, G. L., Piro, R., Flamini, C., Morlot, M., Lhéritier, J., Borneck, R., Marioleas, P., Tsigouri, A., Kerkvliet, J., Drtiz, A., Ivanov, T., D’Arcy, B., Mossel, B., & Vit, P. (1999). Honey quality and international regulatory
standards: review by the International Honey Commission. Bee World,
80(2), 61-69. http://dx.doi.org/10.1080/0005772X.1999.11099428. Bogdanov, S., Lüllmann, C., Martin, P., von der Dhe, W., Russmann, H.,
Vorwohl, G., et al. (2005). Honey quality and international regulatory
standards. Avenches: Swiss Bee Research Centre.
Bogdanov, S., Ruo, K., & Dddo, L. (2004). Physico-chemical methods
for the characterization of uniflorall honeys: a review. Apidologie,
35(Suppl. 1), S4-S17. http://dx.doi.org/10.1051/apido:2004047. Can, Z., Yildiz, D., Sahin, H., Akyuz Turumtay, E., Silici, S., & Kolayli, S.
(2015). An investigation of Turkish honeys: their physico-chemical
properties, antioxidant capacities and phenolic profiles. Food Chemistry,
180, 133-141. http://dx.doi.org/10.1016/j.foodchem.2015.02.024. PMid:25766810.
Conti, M. E. (2000). Lazio region (central Italy) honeys: a survey of
mineral content and typical quality parameters. Food Control, 11(6),
459-463. http://dx.doi.org/10.1016/S0956-7135(00)00011-6. Cotte, J. F., Casabianca, H., Giroud, B., Albert, M., Lheritier, J., &
Grenier-Loustalot, M. F. (2004). Characterization of honey amino acid profiles using high-pressure liquid chromatography to control
authenticity. Analytical and Bioanalytical Chemistry, 378(5),
1342-1350. http://dx.doi.org/10.1007/s00216-003-2430-z. PMid:14740139. Demianowicz, Z. (1961). Pollenkoeffizienten als Grundlage der
quantitativen Pollen analyse des Honigs. Pszczelnicze Zesz Nauk,
5, 95-107.
European Union. (2001, December 20). Council directive 2001/110/
EC relating to honey. Official Journal of the European Communities.
Fallico, B., Zappala, M., Arena, E., & Verzera, A. (2004). Effects of
conditioning on HMF content in Monofloral honeys. Food Chemistry,
85(2), 305-313. http://dx.doi.org/10.1016/j.foodchem.2003.07.010. Ferreira, M. R. P., Alves, A., & Ferreira, M. A. (1998). Estudo comparativo de metodos de avaliaçao de humidade, cinzas e açucares em mel.
Revista Portuguesa de Farmacia, 39, 119-122.
Food and Agriculture Drganization – FAD, World Health Drganization
– WHD, & Food Codex Alimentarius Commission. (2001). Codex
standard for honey codex stan 12-1981. Genebra: FAD/WHD.
Gheldof, N., & Engeseth, N. J. (2002). Antioxidant capacity of honeys from various floral sources based on the determination of oxygen radical absorbance capacity and inhibition of in vitro lipoprotein
oxidation in human serum samples. Journal of Agricultural and Food
Chemistry, 50(10), 3050-3055. http://dx.doi.org/10.1021/jf0114637.
PMid:11982440.
Gheldof, N., Wang, X. H., & Engeseth, N. J. (2003). Buckwheat honey
increases serum antioxidant capacity in humans. Journal of Agricultural
and Food Chemistry, 51(5), 1500-1505. http://dx.doi.org/10.1021/
jf025897t. PMid:12590505.
International Honey Commission – IHC. (2002). Harmonized methods
of the International Honey Commission. Liebefeld: Swiss Bee Research
Centre.
Juszczak, L., Fortuna, T., Socha, R., & Gałkowska, D. (2013). Trade quality
of honeys sold in stores of retail chains. Potravinarstvo, 7, 74-77.
Karabagias, I. K., Badeka, A., Kontakos, S., Karabournioti, S., & Kontominas, M. G. (2014). Characterisation and classification of Greek pine honeys according to their geographical origin based on volatiles,
physicochemical parameters and chemometrics. Food Chemistry,
146, 548-557. http://dx.doi.org/10.1016/j.foodchem.2013.09.105. PMid:24176380.
Kečkeš, J., Trifković, J., Andrić, F., Jovetić, M., Tešić, Ž., & Milojković-Dpsenica, D. (2013). Amino acids profile of Serbian unifloral honeys.
Journal of the Science of Food and Agriculture, 93(13), 3368-3376.
http://dx.doi.org/10.1002/jsfa.6187. PMid:23606039.
Kıvrak, İ. (2015). Free amino acids profile of seventeen Turkish unifloral
honeys. Journal of Liquid Chromatography & Related Technologies,
38(8), 855-862. http://dx.doi.org/10.1080/10826076.2014.976712. Kropáčová, S. (1969). Příspěvek k pylovým analýzám medů jihovýchodní
Moravy. Acta Universitatis Agriculturae (A) Brno, 17, 793-797.
Liberato, M. C. T. C., Morais, S. M., Magalhães, C. E. C., Magalhães, I. L., Cavalcanti, D. B., & Silva, M. M. D. (2013). Physicochemical properties and mineral and protein content of honey samples from
Ceará State, Northeastern Brazil. Food Science and Technology,
33(1), 38-46.
Liebig, W., Ehrlich, G. G., Herman, U., Siegert, L., & Kluge, W. (1992). Characterization of the chemical homogeneity of solid-state materials by chemometric methods. Multivariate aspects and general
recommendations. Fresenius’ Journal of Analytical Chemistry, 343(3),
251-258. http://dx.doi.org/10.1007/BF00322370.
Louveaux, J., Maurizio, A., & Vorwohl, G. (1978). Methods of
melissopalynology. Bee World, 51(3), 125-131. http://dx.doi.org/1
0.1080/0005772X.1970.11097312.
Majewska, E., Kowalska, J., & Jeżewska, A. (2010). Charakterystyka
jakości miodów z różnych regionów Polski. Bromatologia i Chemia
Toksykologiczna, 3, 391-397.
McKibben, J., & Engeseth, N. J. (2002). Honey as a protective agent
Simsek, A., Bilsel, M., & Goren, A. C. (2012). 13C/12C pattern of honey from Turkey and determination of adulteration in commercially
available honey samples using EA-IRMS. Food Chemistry, 130(4),
1115-1121. http://dx.doi.org/10.1016/j.foodchem.2011.08.017. Sivakesava, S., & Irudayaraj, J. (2002). Classification of simple and
complex sugar adulterants in honey by mid-infrared spectroscopy.
International Journal of Food Science & Technology, 37(4), 351-360.
http://dx.doi.org/10.1046/j.1365-2621.2002.00573.x.
Statsoft. (1995). Statistica for Windows. Tulsa: Statsoft Inc.
Swellam, T., Miyanaga, N., Dnozawa, M., Hattori, K., Kawai, K., Shimazui, T., & Akaza, H. (2003). Antineoplastic activity of honey in an experimental bladder cancer implantation model: in vivo and
in vitro studies. International Journal of Urology, 10(4), 213-219.
http://dx.doi.org/10.1046/j.0919-8172.2003.00602.x. PMid:12657101. Szezęsna, T., & Rybak-Chmielewska, H. (2004). The temperature
correction factor for electrical conductivity of honey. The Journal
of Agricultural Science, 48(2), 97-102.
Terrab, A., Díez, M. J., & Heredia, F. J. (2002). Characterization of Moroccan monofloral honeys by their physicochemical characteristics.
Food Chemistry, 79(3), 373-379.
http://dx.doi.org/10.1016/S0308-8146(02)00189-9.
Tonks, A. J., Cooper, R. A., Jones, K. P., Blair, S., Parton, J., & Tonks, A. (2003). Honey stimulates inflammatory cytokine production from
monocytes. Cytokine, 21(5), 242-247. http://dx.doi.org/10.1016/
S1043-4666(03)00092-9. PMid:12824009.
Tonks, A., Cooper, R. A., Price, A. J., Molan, P. C., & Jones, K. P. (2001).
Stimulation of TNF-α release inmonocytes by honey. Cytokine, 14(4),
240-242. http://dx.doi.org/10.1006/cyto.2001.0868. PMid:11448125.
Turkey. (2012). Turkish Food Codex Regulation: directive on honey
2012/58. Official Journal.
Yanniotis, S., Skaltsi, S., & Karaburnioti, S. (2006). Effect of moisture
content on the viscosity of honey at different temperatures. Journal
of Food Engineering, 72(4), 372-377. http://dx.doi.org/10.1016/j.
jfoodeng.2004.12.017.
Yi, T., Chen, Q. L., He, X. C., So, S. W., Lo, Y. L., Fan, L. L., Xu, J., Tang, Y., Zhang, J., Zhao, Z., & Chen, H. (2013). Chemical quantification and antioxidant assay of four active components in Ficus hirta root using UPLC-PAD-MS fingerprinting combined with cluster analysis.
Chemistry Central Journal, 7(1), 115.
http://dx.doi.org/10.1186/1752-153X-7-115. PMid:23835498.
Yu, P. Q. (2005). Applications of hierarchical cluster analysis (CLA) and principal component analysis (PCA) in feed structure and feed molecular chemistry research, using synchrotron-based Fourier
transform infrared (FTIR) microspectroscopy. Journal of Agricultural
and Food Chemistry, 53(18), 7115-7127. http://dx.doi.org/10.1021/
jf050959b. PMid:16131119.
Zappala, M., Fallico, B., Arena, E., & Verzera, A. (2005). Methods for
the determination of HMF in honey: A comparison. Food Control,
16(3), 273-277. http://dx.doi.org/10.1016/j.foodcont.2004.03.006.
and Food Chemistry, 50(3), 592-595. http://dx.doi.org/10.1021/
jf010820a. PMid:11804534.
Meda, A., Lamien, C. E., Romito, M., Millogo, J., & Nacoulma, D. G. (2005). Determination of total phenolic, flavonoid and proline contents in Burkina Fasan honey, as well as their radical scavenging
activity. Food Chemistry, 91(3), 571-577. http://dx.doi.org/10.1016/j.
foodchem.2004.10.006.
Mendes, E., Brojo Proença, E., Ferreira, I. M. P. L. V. D., & Ferreira, M. A.
(1998). Quality evaluation of Portuguese honey. Carbohydrate Polymers,
37(2), 219-223. http://dx.doi.org/10.1016/S0144-8617(98)00063-0. Drsolic, N., Terzic, S., Sver, L., & Basic, I. (2005). Honey-bee products
in prevention and/or therapy of murine transplantable tumours.
Journal of the Science of Food and Agriculture, 85, 363-370. http://
dx.doi.org/10.1002/jsfa.2041.
Pichichero, E., Canuti, L., & Canini, A. (2009). Characterisation of the phenolic and flavonoid fractions and antioxidant power of Italian
honeys of different botanical origin. Journal of the Science of Food
and Agriculture, 89(4), 609-616. http://dx.doi.org/10.1002/jsfa.3484.
Pires, J., Estevinho, M. L., Feás, X., Cantalapiedra, J., & Iglesias, A. (2009). Pollen spectrum and physico-chemical attributes of heather (Erica
sp.) honeys of north Portugal. Journal of the Science of Food and
Agriculture, 89(11), 1862-1870. http://dx.doi.org/10.1002/jsfa.3663.
Přidal, A., & Vorlová, L. (2002). Honey and its physical parameters.
Czech Journal of Animal Science, 47(10), 439-444.
Rebane, R., & Herodes, K. (2008). Evaluation of the botanical origin of
estonian uni and polyfloral honeys by amino acid content. Journal
of Agricultural and Food Chemistry, 56(22), 10716-10720. http://
dx.doi.org/10.1021/jf8018968. PMid:18973300.
Schramm, D. D., Karim, M., Schrader, H. R., Holt, R. R., Cardetti, M., & Keen, C. L. (2003). Honey with high levels of antioxidants can
provide protection to healthy human subjects. Journal of Agricultural
and Food Chemistry, 51(6), 1732-1735. http://dx.doi.org/10.1021/
jf025928k. PMid:12617614.
Senyuva, H. Z., Gilbert, J., Silici, S., Charlton, A., Dal, C., Gürel, N., & Cimen, D. (2009). Profiling Turkish honeys to determine authenticity
using physical and chemical characteristics. Journal of Agricultural
and Food Chemistry, 57(9), 3911-3919. http://dx.doi.org/10.1021/
jf900039s. PMid:19326859.
Silva, I. A. A., da Silva, T. M. S., Camara, C. A., Queiroz, N., Magnani, M., de Novais, J. S., Soledade, L. E. B., Dliveira Lima, E., Souza, A. L., & Souza, A. G. (2013). Phenolic profile, antioxidant activity and palynological analysis of stingless bee honey from Amazonas,
Northern Brazil. Food Chemistry, 141(4), 3552-3558. http://dx.doi.
org/10.1016/j.foodchem.2013.06.072. PMid:23993520.
Silva, L. R., Videira, R., Monteiro, A. P., Valentão, P., & Andrade, P. B. (2009). Honey from Luso region (Portugal): Physicochemical
characteristics and mineral contents. Microchemical Journal, 93(1),