http://dx.doi.org/10.1590/1806-9061-2015-0037
Chickens Subjected to Different Nutritional Plans
Author(s)
Martins JMSI
Carvalho CMCII
Litz FHII
Silveira MMIII
Moraes CAII
Silva MCAII
Fagundes NSIV
Fernandes EAII
I Escola de Veterinária e Zootecnia -
Universidade Federal de Goiás
II Faculdade de Medicina Veterinária -
Universidade Federal de Uberlândia
III Instituto de Genética e Bioquímica -
Universidade Federal de Uberlândia
IV Escola Superior de Agricultura “Luiz de
Queiroz” - Universidade de São Paulo
Mail Address
Corresponding author e-mail address Julyana Machado da Silva Martins Laboratório de Nutrição Animal – LANRA Rua Ceará, s/n, bloco 2 D, sala 36, Bairro
Umuarama
38402-018. Uberlândia, MG, Brasil. Phone: (34) 32182371
E-mail: [email protected]
Keywords
Nutrient density, performance, carcass yield, economic viability.
Submitted: March/2015 Approved: September/2015
ABSTRACT
The objective of the study was to evaluate the effect of nutritional plans on the productive and economic performance of Hubbard Flex broiler chickens. A completely randomized experimental design was applied, consisting of five treatments. Treatments consisted of five different nutritional plans: a basal diet containing the nutrient and energy levels recommended by literature and designated reference diet; two diets containing 1.5% and 3% lower levels than the reference diet; and two diets containing 1.5% and 3% higher levels than the reference diet (-3%, -1.5%, reference plan, +1.5% and +3%). Feed intake (FI), body weight (BW), feed conversion rate (FCR), livability (L) and productive efficient index (PEI) were determined when broilers were 42 days old. Broilers were processed, and carcass and parts (breast fillet, leg, and wings) yields were determined. The economic viablility of the nutitional plans was evaluated as a function of feed cost/kg live and carcass weights, economic efficiency index (EEI), and cost index (CI). Feed intake and the feed conversion rate decreased as dietary nutrient and energy levels increased. Feed cost/kg live weight, economic efficiency index, and cost index cost increased as dietary nutrient and energy levels increased. Feed intake, feed conversion ratio, production efficiency index, and breast yield improved with increasing nutritional and energy levels. However, worse economic results were obtained with higher nutritional and energy levels.
INTRODUCTION
The improvement of performance parameters requires constant adjustment of the nutritional requirements of the modern broiler strains, in order to allow the expression of their full genetic potential. When adequately fed, broilers are efficient, producing the required carcass yield and quality at the lowest possible cost.
When evaluating the effect of dietary nutritional levels on broiler performance, no performance losses were observed by Aziz et al.
(2011), when diluting dietary protein and energy, or by Widyaratne & Drew (2011), when reducing protein and digestible amino acid levels. This indicates that reducing dietary nutrient levels may yield significant performance and economic benefits. Leandro et al. (2003) observed that the dietary metabolizable energy and crude protein levels applied in different nutritional plans influenced the weight gain and the feed conversion ratio of both male and female Ross 308 broilers, as well as male breast yield, and emphasized the importance of studies to determine the best nutritional plan for each broiler strain.
direct impact on farm productivity, and therefore, on its profitability. Production efficiency is significantly and negatively affected when feed nutritional levels are lower than the broilers’ requirements. On the other hand, supplying diets with nutrient levels above the requirements improves live performance, but may result in economic losses due the higher cost of those diets.
Considering that the genetic line Hubbard Flex was recently introduced in Brazil, where climate, production conditions, and typical feedstuffs are different from those in the country of origin, its nutritional requirements under Brazilian conditions need to be established. According to Araujo et al.
(2002), the nutritional recommendations established in genetic manuals do not always promote maximum live performance and profitability when applied in the Brazilian broiler production setting.
Therefore, the objective of this study was to evaluate the effects different nutritional plans relative to the recommendations on the live and economic performance of Hubbard Flex broilers reared during the summer in the southeast of Brazil.
MATERIAL AND METHODS
The experiment was carried out in the experimental broiler facilities of Gloria experimental farm of the Federal University of Uberlândia, state of Minas Gerais, Brazil, between March and April, 2013. The experimental procedures were approved by the Committee of Ethics of that university, under protocol CEUA/UFU 002/13.
In total, 1,700 (850 males and 850 females) one-day-old Hubbard Flex broilers, with 44-g average initial body weight, were housed in pens in a conventional poultry house until 42 days of age. A completely randomized experimental design, consisting of five treatments with 10 replicates of 34 birds per pen (17 males and 17 females) was applied.
Treatments consisted of five different nutritional plans: a basal diet containing the nutrient and energy levels recommended by Rostagno et al. (2011), and
designated reference diet; two diets containing 1.5% and 3% lower levels than the reference diet; and two diets containing 1.5% and 3% higher levels than the reference diet (Tables 1 and 2).
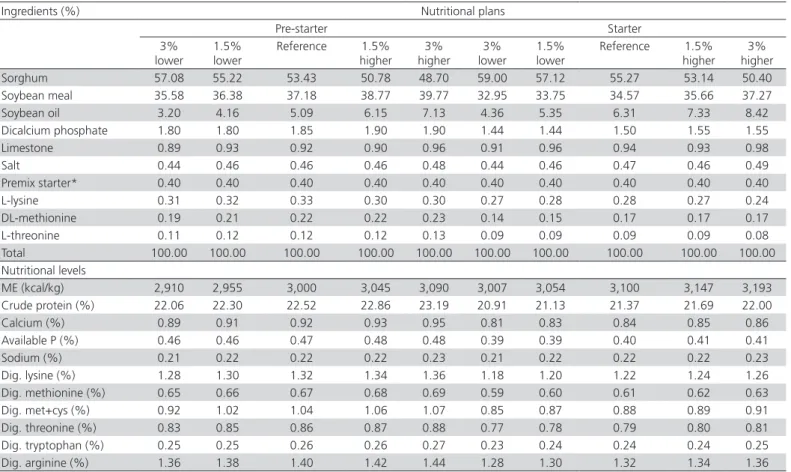
Table 1 – Feedstuffs and calculated nutritional composition of the pre-starter and starter diets.
Ingredients (%) Nutritional plans
Pre-starter Starter
3% lower
1.5% lower
Reference 1.5%
higher
3% higher
3% lower
1.5% lower
Reference 1.5%
higher
3% higher
Sorghum 57.08 55.22 53.43 50.78 48.70 59.00 57.12 55.27 53.14 50.40
Soybean meal 35.58 36.38 37.18 38.77 39.77 32.95 33.75 34.57 35.66 37.27
Soybean oil 3.20 4.16 5.09 6.15 7.13 4.36 5.35 6.31 7.33 8.42
Dicalcium phosphate 1.80 1.80 1.85 1.90 1.90 1.44 1.44 1.50 1.55 1.55
Limestone 0.89 0.93 0.92 0.90 0.96 0.91 0.96 0.94 0.93 0.98
Salt 0.44 0.46 0.46 0.46 0.48 0.44 0.46 0.47 0.46 0.49
Premix starter* 0.40 0.40 0.40 0.40 0.40 0.40 0.40 0.40 0.40 0.40
L-lysine 0.31 0.32 0.33 0.30 0.30 0.27 0.28 0.28 0.27 0.24
DL-methionine 0.19 0.21 0.22 0.22 0.23 0.14 0.15 0.17 0.17 0.17
L-threonine 0.11 0.12 0.12 0.12 0.13 0.09 0.09 0.09 0.09 0.08
Total 100.00 100.00 100.00 100.00 100.00 100.00 100.00 100.00 100.00 100.00
Nutritional levels
ME (kcal/kg) 2,910 2,955 3,000 3,045 3,090 3,007 3,054 3,100 3,147 3,193
Crude protein (%) 22.06 22.30 22.52 22.86 23.19 20.91 21.13 21.37 21.69 22.00
Calcium (%) 0.89 0.91 0.92 0.93 0.95 0.81 0.83 0.84 0.85 0.86
Available P (%) 0.46 0.46 0.47 0.48 0.48 0.39 0.39 0.40 0.41 0.41
Sodium (%) 0.21 0.22 0.22 0.22 0.23 0.21 0.22 0.22 0.22 0.23
Dig. lysine (%) 1.28 1.30 1.32 1.34 1.36 1.18 1.20 1.22 1.24 1.26
Dig. methionine (%) 0.65 0.66 0.67 0.68 0.69 0.59 0.60 0.61 0.62 0.63
Dig. met+cys (%) 0.92 1.02 1.04 1.06 1.07 0.85 0.87 0.88 0.89 0.91
Dig. threonine (%) 0.83 0.85 0.86 0.87 0.88 0.77 0.78 0.79 0.80 0.81
Dig. tryptophan (%) 0.25 0.25 0.26 0.26 0.27 0.23 0.24 0.24 0.24 0.25
Dig. arginine (%) 1.36 1.38 1.40 1.42 1.44 1.28 1.30 1.32 1.34 1.36
Diets were formulated according to a 4-phase feeding schedule: pre-starter (1-7 d), starter (8-21 d), grower (22-35 d), and finisher (36-42 d).
Cumulative performance was evaluated at 42 days of age. Birds and feed offer and residues were weekly weighed, and mortality was daily recorded. The following parameters were evaluated: average feed intake (FI), average body weight (BW), feed conversion ratio (CA), livability, and productive efficiency index (PEI). This index took into account body weight, livability, bird age, and feed conversion ratio, and was calculated according to the following equation:
PEI (%)= Body weight (kg) x livability (%) x 100 Age (days) x feed conversion ratio
At 42 days of age, 10 birds per treatment (five males and five females), with average live weight equal to the average weight (± 5%) of each treatment,
were processed (stunned, bled, scalded, plucked, and eviscerated). Carcass yield (CY, %) was calculated as clean and eviscerated carcass weight relative to body weight at slaughter. Carcasses were then cut up, and parts yields (thigh+drumstick or leg, breast fillet, and wings) were calculated as part weight relative to carcass weight.
The economic viability of the applied nutritional plans was determined as feed cost relative to body weight (Yi) and relative to eviscerated carcass weight (Yi), according to the following equation proposed by Bellaver et al. (1985):
Yi = Qi x Pi
Gi
where Yi is the feed cost per kg of body weight or eviscerated carcass weight of the ith treatment; Pi is
the price per kg feed fed in the ith treatment; Qi is the
amount of feed intake in the ith treatment; and Gi is
Table 2 – Feedstuffs and calculated nutritional composition of the grower and finisher diets.
Nutritional plans
Grower Finisher
Ingredients (%) 3%
lower
1.5% lower
Reference 1.5%
higher
3% higher
3% lower
1.5% lower
Reference 1.5%
higher
3% higher
Sorghum 61.48 59.66 57.67 55.53 52.77 64.08 62.24 60.55 57.82 55.69
Soybean meal 29.64 30.44 31.38 32.45 34.10 27.24 28.04 28.67 30.29 31.31
Soybean oil 5.44 6.44 7.44 8.47 9.59 5.70 6.69 7.67 8.79 9.85
Dicalcium
phosphate 1.20 1.26 1.28 1.31 1.30 1.00 1.00 1.05 1.06 1.11
Limestone 0.90 0.89 0.89 0.90 0.91 0.77 0.79 0.79 0.80 0.79
Salt 0.44 0.44 0.44 0.44 0.47 0.42 0.45 0.45 0.45 0.47
Premix grower* 0.40 0.40 0.40 0.40 0.40 - - - -
-Premix finisher** - - - 0.30 0.30 0.30 0.30 0.30
L-lysine 0.28 0.26 0.26 0.26 0.22 0.26 0.25 0.26 0.23 0.22
DL-methionine 0.14 0.14 0.16 0.16 0.16 0.17 0.18 0.19 0.20 0.20
L-threonine 0.08 0.07 0.08 0.08 0.08 0.06 0.06 0.07 0.06 0.06
Total 100.00 100.00 100.00 100.00 100.00 100.00 100.00 100.00 100.00 100.00
Composition
ME (kcal/kg) 3,104 3,152 3,200 3,248 3,296 3,153 3,201 3,250 3,299 3,348
Crude protein (%) 19.59 19.77 20.07 20.37 20.85 18.70 18.90 19.06 19.55 19.83
Calcium (%) 0.74 0.75 0.76 0.77 0.78 0.64 0.65 0.66 0.67 0.68
Avail. phosphorus (%) 0.34 0.34 0.35 0.36 0.36 0.30 0.31 0.31 0.31 0.32
Sodium (%) 0.20 0.210 0.210 0.210 0.220 0.20 0.21 0.21 0.21 0.22
Dig. lysine (%) 1.10 1.11 1.13 1.15 1.16 1.03 1.04 1.06 1.08 1.09
Dig. methionine (%) 0.55 0.56 0.57 0.58 0.59 0.51 0.52 0.53 0.54 0.55
Dig. met+cys (%) 0.80 0.81 0.82 0.83 0.84 0.75 0.76 0.77 0.78 0.79
Dig. threonine (%) 0.72 0.73 0.74 0.75 0.76 0.67 0.68 0.69 0.70 0.71
Dig. tryptophan (%) 0.21 0.22 0.22 0.22 0.23 0.20 0.21 0.21 0.21 0.22
Dig. arginine (%) 1.18 1.20 1.22 1.24 1.26 1.11 1.13 1.14 1.15 1.17
*Premix grower (composition per kg product): vitamin A 1,280,000 IU; vitamin B1 400 mg; vitamin B12 1,600 mcg; vitamin B2 720 mg; vitamin B6 320 mg; vitamin D3 3,500 IU; vitamin E 2.400 mg; vitamin K 300 mg; copper 1,200 mg; iron 10 g; iodine 240 mg; manganese 12 g; selenium 60 mg; zinc 12 g; folic acid 100 mg; pantothenic acid 1,600 mg; biotin 6 mg; choline 50 g; halquinol 6,000 mg; methionine 267.30 g; niacin 4,800 mg; salinomycin 13.20 g.
the weight gain or carcass weight obtained in the ith
treatment.
Diet cost and feed intake were separately calculated for each feeding phase, and subsequently summed. The price of each dietary treatment took into account nutrient density. The feedstuff prices considered were those effective in the market of the region of Uberlândia, state of Minas Gerais, in March, 2013.
Subsequently, the economic efficiency index (EEI) and the cost index (CI), proposed by Fialho et al.
(1992), as follows:
EEi = LCa x 100
CTai and
CI = CTai x 100
LCa
where MCa is the lowest feed cost per kg body weight or eviscerated carcass weight among treatments and CTai is the cost of the ith treatment.
Data were checked for residue normality, and then submitted to analysis of variance at 5% significance level. Nutritional plan data were submitted to analysis of regression. Statistical analyses were performed using SAS 9.3 (SAS, 2011).
RESULTS AND DISCUSSION
The performance results obtained from one to 42 days of age are shown in Table 3. Feed intake and feed conversion ratio linearly decreased as dietary nutrient and energy levels increased. Body weight presented a cubic response to nutritional plan, with the lowest body weight obtained at +0.106% nutritional level.
The treatments did not influence (p>0.05) livability. Production efficiency index linearly improved as dietary nutrient and energy density increased, which may have been due to the linear reduction in feed conversion ratio.
Reginatto et al. (2000), Mendes et al. (2004), and
Dozier et al. (2006), evaluating different nutritional
plans, also found a linear reduction in feed intake with increasing dietary energy levels. Waldroup et al. (1990)
and Dozier et al. (2006) stated that dietary energy level controls the feed intake of broilers. Silva et al. (2001),
Costa et al. (2001), and Kamran et al. (2008) observed
a linear reduction in feed intake and feed conversion ratio with increasing dietary crude protein levels.
The manipulation of dietary nutrient density levels may be an alternative to supply the nutritional requirements of broilers, while minimizing performance losses resulting from reduced feed intake, as typically occurs in hot climates. In the present experiment, dietary energy level was increased with the inclusion of oil, which promotes low heat increment, and therefore, better dietary energy:protein ratio, resulting in high protein deposition and consequent better feed conversion ratio. This result corroborates with Leandro
et al. (2003), Mendes et al. (2004), and Sakomura
et al. (2004), who reported that feed conversion
ratio improved as dietary ME levels increased. On the other hand, Lima et al. (2008) did not find any
effect of dietary energy and amino acid levels on the feed conversion ratio of either male or female broilers between 1-40 or 1-45 days of age. Relative to dietary amino acid content, Kidd et al. (2005) observed better
feed conversion ratio when supplying higher amino acid levels.
Table 3 – Feed intake (FI), body weight (BW), feed conversion (FCR), livability (LIV), and productive efficiency index (PEI) of 42-d-old Hubbard Flex broilers submitted to different nutritional plans.
Treatments FI (kg) BW (kg) FCR (kg/kg) LIV (%) PEI (%)
Plan -3% 4.750 2.853 1.670 95.90 391.31
Plan -1.5% 4.670 2.892 1.628 97.39 415.22
Reference plan 4.574 2.860 1.605 97.71 416.54
Plan +1.5% 4.381 2.781 1.589 98.04 412.62
Plan +3% 4.300 2.820 1.551 97.32 428.90
CV (%) 4.64 2.72 3.03 2.98 5.58
p value Linear <0.0001¹ 0.2600 <0.0001³ 0.7314 0.00134
Quadratic 0.5094 0.5894 0.6664 0.2153 0.4346
Cubic 0.3191 0.0139² 0.1713 0.9692 0.0621
¹y = 4.5346-0.07891x (R² = 0.9756)
²y=2.87499-0.04729x-0.00147x²+0.00464x³ (R²=0.9603) ³y=1.60859-0.01859x (R²=0.976)
4y=412.79935+4.95579x (R²=0.7111)
Similarly to the results of the present study, Silva et al. (2001) did not find any influence of different dietary
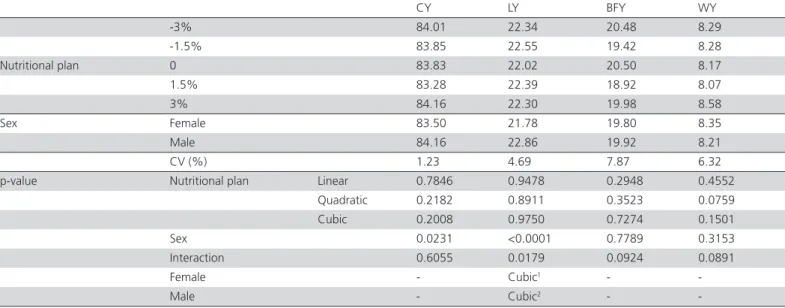
energy levels and ME:CP ratios on broiler mortality. There was no interaction between sex and nutritional plans for carcass yield or breast and wing yields. However, a significant interaction between these factors was observed for leg yield (Table 4). The regression equation for females showed that the lowest leg yield was obtained at a -0.278% nutritional plan, whereas the regression equation for males indicated the highest leg yield at a nutritional plan of +0.233%. Nutritional plans did not affect carcass, breast meat, or wing yields.
The obtained results are consistent with the reports of Leandro et al. (2003) and Kamran et al. (2008), who
did not find any carcass yield differences in broilers submitted to different nutritional plans, i.e., fed diets with different energy and protein levels. On the other hand, Sabino et al. (2004) found a linear effect of
increasing CP levels on carcass yield. Such divergent results may be attributed to differences among broiler strains, dietary nutritional levels and nutrient balances applied in the experiments.
Higher protein intake results in higher breast yield, as shown by Costa et al. (2001), who observed a linear
increase in breast yield in broilers fed diets containing 17.50 to 19.50% CP. However, this effect was not observed in the present experiment, possibly due to the physiology of the evaluated broiler strain.
Antunes et al. (2012), evaluating the effects of three
dietary energy levels on the carcass yield of two broiler strains, did not find wing yield or breast yield (with or without the skin and bones) differences; however, lower leg yield was obtained when broilers were fed the intermediate energy level.
Table 4 also shows the effect of sex (p<0.05) on carcass yield, with males presenting better results, independently of energy levels, whereas parts yields were not different between sexes. Female broilers accumulate more body fat, which compromises their weight gain and therefore, their carcass yield.
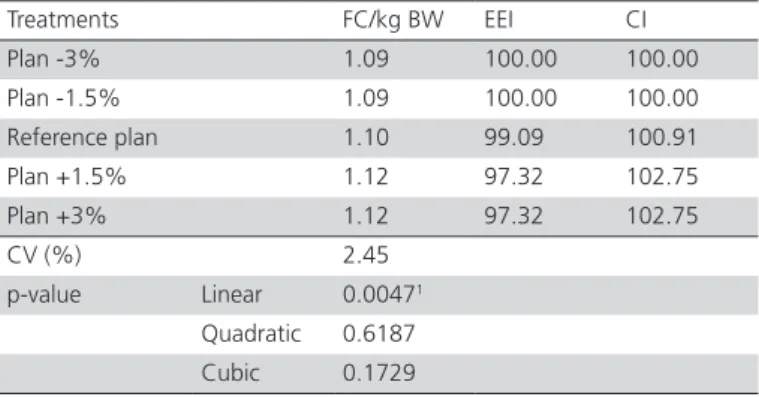
Table 5 shows the results of feed cost/kg body weight, economic efficiency index, and cost index, which were used for the analysis of the economic viability of the different nutritional plans. Feed cost/ kg body weight was linearly affected by the nutritional plans, and is represented by the equation y = 0.0065x + 1.1069 (R² = 0.8765), showing that feed cost increased as dietary nutrient levels increased.
The best economic efficiency and cost indexes were obtained with the -3% and -1.5% plans. Therefore, it does not seem to be economically viable to increase nutrient and energy levels in the diet of Hubbard Flex broilers. However, this depends on the market price of soybean meal and soybean oil at the time of feed formulation, as these were the feedstuffs which levels were most increased in the diets and that most affected the economic indices.
Table 4 – Carcass yield (CY), leg yield (LY), breast fillet yield (BFY), and wing yield (WY) of 42-d-old male and female broilers submitted to different nutritional plans.
CY LY BFY WY
-3% 84.01 22.34 20.48 8.29
-1.5% 83.85 22.55 19.42 8.28
Nutritional plan 0 83.83 22.02 20.50 8.17
1.5% 83.28 22.39 18.92 8.07
3% 84.16 22.30 19.98 8.58
Sex Female 83.50 21.78 19.80 8.35
Male 84.16 22.86 19.92 8.21
CV (%) 1.23 4.69 7.87 6.32
p-value Nutritional plan Linear 0.7846 0.9478 0.2948 0.4552
Quadratic 0.2182 0.8911 0.3523 0.0759
Cubic 0.2008 0.9750 0.7274 0.1501
Sex 0.0231 <0.0001 0.7789 0.3153
Interaction 0.6055 0.0179 0.0924 0.0891
Female - Cubic1 -
-Male - Cubic2 -
Table 5 – Feed cost per kg body weight (FC/kg BW), economic efficiency index (EEI), and cost index (CI) obtained for 42-d-old Hubbard Flex broilers submitted to different nutritional plans.
Treatments FC/kg BW EEI CI
Plan -3% 1.09 100.00 100.00
Plan -1.5% 1.09 100.00 100.00
Reference plan 1.10 99.09 100.91
Plan +1.5% 1.12 97.32 102.75
Plan +3% 1.12 97.32 102.75
CV (%) 2.45
p-value Linear 0.00471
Quadratic 0.6187
Cubic 0.1729
¹y = 0.0065x+1.1069 (R² = 0.8765) CV = coefficient of variation
Table 6 shows the results of the economic viability analysis relative to eviscerated carcass. Feed cost/kg eviscerated carcass was not influenced by the nutritional plans. The best economic efficiency and cost indexes were obtained with the -3% plan, followed by +1.5 and + 3% plans. Therefore, the nutritional plan to be applied depends on the market price of feedstuffs, as mentioned above.
Table 6 – Feed cost per kg eviscerated carcass (FC/kg eviscerated carcass), economic efficiency index (EEI), and cost index (CI) obtained for 42-d-old Hubbard Flex broilers submitted to different nutritional plans.
Treatments FC/kg carcass EEI CI
Plan -3% 1.32 100.00 100.00
Plan -1.5% 1.35 97.78 102.27
Reference plan 1.35 97.78 102.27
Plan +1.5% 1.33 99.25 100.76
Plan +3% 1.33 99.25 100.76
CV (%) 2.76
p-value Linear 0.2704
Quadratic 0.0889
Cubic 0.2355
CV = coefficient of variation
CONCLUSIONS
Feed intake, feed conversion ratio, production efficiency index, and breast yield improved with increasing nutritional and energy levels. However, worse economic results were obtained with higher nutritional and energy levels. Therefore, the choice of the nutritional plan to be applied depends on the market price of feedstuffs at the time of feed formulation.
REFERENCES
Antunes MM, Bueno JPR, Silva MCA, Soares DB, Santos IL, Carvalho CMC, Oliveira MV, Fernandes EA. Rendimento de carcaça e cortes em frangos de corte fêmeas de duas linhagens submetidas a diferentes níveis nutricionais. Veterinária Notícias 2012; 18(2):100-104. (Suplemento). Azizi B, Sadeghi G, Karimi A, Abed F. Effects of dietary energy and protein
dilution and time of feed replacement from starter to grower on broiler chickens performance. Journal of Central European Agriculture 2011; 12(1):44-52.
Bellaver C, Fialho ET, Protas JFS, Gomes PC. Radícula de malte na alimentação de suínos em crescimento e terminação. Pesquisa Agropecuária Brasileira 1985; 20(8):969-974.
Costa FGP, Rostagno HS, Albino LFT, Gomes PC, Toledo RS, Vargas Junior JG. Níveis dietéticos de proteína bruta para frangos de corte de 1 a 21 e 22 a 42 dias de idade.Revista Brasileira de Zootecnia 2001; 30(5):1498-1505.
Dozier WA, Price CJ, Kidd MT, Corzo A, Anderson J, Branton SL. Growth performance, meat yield, and economic responses of broilers fed diets varying in metabolizable energy from thirty to fifty-nine days of age. Journal of Applied Poultry Research 2006; 15:367-382.
Fialho ET, Barbosa HP, Ferreira AS, Gomes PC, Girotto AF. Utilização da cevada suplementada com óleo de soja para suínos em crescimento e terminação. Pesquisa Agropecuária Brasileira 1992; 27(10):1467-1475. Kamran Z, Sarwar M, Nisa M, Nadeem MA, Mahmood S, Babar ME, Ahmed S. Effect of low-protein diets having constant energy-to-protein ratio on performance and carcass characteristics of broiler chickens from one to thirty-five days of age. Poultry Science 2008; 87:468-474. Kidd MT, Corzo A, Hoehler D, Miller ER, Dozier WA. Broiler responsiveness
(Ross x 708) to diets varying in amino acid density. Poultry Science 2005; 84(4):1389-1396.
Leandro NSM, Café MB, Stringhini JH, Moraes Filho R, Moura KA, Silva Júnior RP. Plano nutricional com diferentes níveis de proteína bruta e energia metabolizável na ração para frangos de corte. Revista Brasileira de Zootecnia 2003; 32(3):620-631.
Lima LMB, Lara LJC, Baião NC, Cançado SV, Michell BC, Ferreira FCR. Efeitos dos níveis de energia, lisina e metionina+cistina sobre o desempenho e o rendimento de carcaça de frangos de corte. Revista Brasileira de Zootecnia 2008; 37(8):1424-1432.
Mendes AA, Moreira J, Oliveira EG, Garcia EA, Almeida MEM, Garcia RG. Efeitos da energia da dieta sobre desempenho, rendimento de carcaça e gordura abdominal de frangos de corte. Revista Brasileira de Zootecnia 2004; 33(6):2300-2307. (Suplemento 4).
Moosavi M, Eslami M, Chaji M, Boujarpour M. Economic value of diets with different levels of energy and protein with constant ratio on broiler chickens. Journal of Animal and Veterinary Advances 2011; 10:709-711.
Reginatto MF, Ribeiro AM, Penz Junior AM, Kessler AM, Krabbe EL. Suplementação de treonina em dietas de frango de corte, variando a energia e as relações energia:proteína. Revista Brasileira de Ciências Avícola 2000; 2(3):239-247.
Rostagno HS, Albino LFT, Donzele JL, Gomes PC, Oliveira RF, Lopes DC, Ferreira AS, Barreto SLT, Euclides RF. Tabelas brasileiras para aves e suínos: composição de alimentos e exigências nutricionais. 3 ed. Viçosa; UFV; 2011.
Sakomura NK, Longo FA, Rabello CB, Watanabe K, Pelícia K, Freitas ER. Efeito do nível de energia metabolizável da dieta no desempenho e metabolismo energético de frangos de corte. Revista Brasileira de Zootecnia 2004; 33(6):1758-1767. (Suplemento 1).
SAS - Statistical Analysis System. Statistical analysis system: user’s guide: statistics. Version 9.3. Cary: SAS Institute Inc.; 2011.
Silva JHV, Albino LFT, Nascimento AH. Níveis de energia e relações energia: proteína para frangos de corte de 22 a 42 dias de idade. Revista Brasileira de Zootecnia 2001; 30(6):1791-1800.
Waldroup PW, Tidwell NM, Izat AL. The effects of energy and amino acid levels on performance and carcass quality of male and female broilers grown separately. Poutry Science 1990; 69(9):1513-1521.