INFLUENCE OF LITTER LAYER REMOVAL ON THE SOIL
THERMAL REGIME OF A PINE FOREST IN A
MEDITERRANEAN CLIMATE
(1)José Alexandre Varanda Andrade(2), Francisco Manuel Gonçalves de Abreu(3) & Manuel Armando Valeriano Madeira(4)
SUMMARY
The removal of the litter layer in Portuguese pine forests would reduce fire hazard, but on the other hand this practice would influence the thermal regime of the soil, hence affecting soil biological activity, litter decomposition and nutrient dynamics. Temperature profiles of a sandy soil (Haplic Podzol) under a pine forest were measured with thermocouples at depths to 16 cm, with and without litter layer. The litter layer acted as a thermal insulator, reducing the amplitude of the periodic temperature variation in the mineral soil underneath and increasing damping depths, particularly at low soil water contents. At the mineral soil surface the reduction of amplitudes was about 2.5 ºC in the annual cycle and 5 to 6.7 ºC in the daily cycle, depending on the soil water content. When soil was both cold and wet, mean daily soil temperatures were higher (about 1 – 1.5 ºC) under the litter layer. Improved soil thermal conditions under the litter layer recommend its retention as a forest management practice to follow in general.
Index terms: soil temperature, Fourier series, damping depth.
(1) Received for publication in May 2010 and approved in July 2010.
(2) Assistant Professor of Agrometeorology - Institute of Mediterranean Agricultural and Environmental Sciences, University of Evora 7000-671 Evora. E-mail: [email protected]
(3) Associate Professor of Agrometeorology - Superior Institute of Agronomy, Technical University of Lisbon 1349-017 Lisbon. E-mail: [email protected]
(4) Full Professor of Forest Soils - Superior Institute of Agronomy, Technical University of Lisbon 1349-017 Lisbon. E-mail: [email protected]
RESUMO: INFLUÊNCIA DA MANTA MORTA NO REGIME TÉRMICO DE UM SOLO SOB PINUS NUM CLIMA DO TIPO MEDITERRÂNEO
A remoção da manta morta nos pinhais portugueses pode reduzir o risco de incêndio florestal, mas essa prática pode influenciar o regime térmico do solo, alterando dessa forma a atividade biológica, a decomposição da manta morta e a dinâmica de nutrientes. Num solo arenoso (Haplic Podzol) sob pinus foram medidos perfis térmicos com termopares a várias profundidades até 16 cm, com ou sem manta morta. A manta morta atuou como um isolador térmico, reduzindo a amplitude da variação periódica da temperatura na camada de solo subjacente e aumentando as profundidades de amortecimento, sobretudo em teores baixos de umidade do solo. Na superfície do solo mineral a redução das amplitudes foi de cerca de 2,5 ºC no ciclo anual e de 5 a 6,7 ºC no ciclo diário, dependendo da umidade do solo. A manta morta aumentou em cerca de 1–1,5 ºC as temperaturas médias diárias do solo mineral quando este se encontrava mais frio e mais úmido. A melhoria das condições térmicas do solo sob a manta morta recomenda a sua retenção como regra a seguir enquanto prática de ordenamento florestal.
Termos de indexação: temperatura do solo, séries de Fourier, profundidade de amortecimento.
INTRODUCTION
About 30 % (900 x 103 ha) of the total forest area
in Portugal is covered by Pinus spp., growing mainly on nutrient-poor sandy soils under Mediterranean climate. Forest fires have become a severe economic and environmental concern in Portugal over the last years. During the last decade, an average of about 74 x 103 ha of forest was devastated by fires every year
(DGRF, 2005). At present, the risk of fires is expected to increase due to the predicted temperature increase and decrease of spring rainfall in the context of global climate changes in Southern Europe (IPCC, 2007). To reduce fire risks, the removal of the litter layer and understory vegetation is being recommended in the country, in spite of the awareness that litter removal can be responsible for the yield decline in several forest species, such as Picea sitchensis (Proe et al., 1994) and Eucalyptus globulus (Jones et al., 1999).
Retention or removal of the litter layer from the forest floor raises several issues. The presence of litter is important for the sustainability of pine forests, due to better nutrient dynamics (Meentemeyer & Berg, 1986) and water balance (Cubera et al., 2004) in soils with a very limited potential. In addition, the litter layer is assumed to influence the thermal regime of the mineral soil underneath.
Information on the influence of litter layer removal on the thermal behavior of forest soils is scarce. Under canopy shading only, daily and annual variations of soil temperature are known to be reduced (Ghuman & Lal, 1987; Morecroft et al., 1998; Hashimoto & Susuki, 2004). Additional shelter provided by the litter layer may reduce further convective and radiative heat exchange between soil and atmosphere, but this effect may depend on both the degree of canopy cover and thickness of the layer (Johnson-Maynard et al., 2004).
Kang et al. (2000) predicted deciduous forest soil temperatures from air temperature data in vast areas and latitudes, and assigned a value to the litter layer similar to that of the leaf area index, while Paul et al. (2004) used the litter layer mass to predict average soil temperatures from air temperature of several forest types in Australia. The daily variation of soil temperature would be reduced under increased shelter, controlling the penetration depth of the daily heat wave into the soil. The removal of the litter layer may change the soil temperature regime, hence affecting the rates of temperature-dependent biological processes such as organic matter mineralization (Bonito et al., 2003; Liu et al., 2010) and root development (Boone et al., 1998). However, no information about litter layer removal on the soil thermal regime is available so far for Mediterranean conditions.
In this context, a study was carried out to evaluate the influence of litter layer removal on the thermal regime of a sandy soil under a pine forest, over a full year. Since the extent of the litter layer effect on soil thermal behavior may depend on soil water content due to both the high specific heat and low thermal diffusivity of water compared to those of other constituents of mineral soils (Monteith & Unsworth, 2007), three mean daily cycles of soil temperature were analyzed using Fourier series, each one representing a different level of soil water content.
MATERIALS AND METHODS
Site description
10 km from the Atlantic Ocean. The stand is surrounded by a Eucalyptus globulus plantation and the experimental plot occupied an area of 50 x 50 m within the stand. The 24-year-old pine trees were about 17 m high and stand density was 1,520 trees ha-1
(2 x 2 m spacing) and the canopy cover about 90 %. The local climate is Csb, according to Köppen (Arhens, 2003). At a meteorological station nearby (Caldas da Rainha, about 12 km away from the site) the mean annual temperature averages 15.2 ºC, ranging from a monthly mean of 10.4 ºC in January to 19.8 ºC in August. Mean annual rainfall is 607 mm, 73 % of which falls between October and March.
The soil is a Haplic Podzol and with a profile O – Ah (down to 30/40 cm) – Bsh (from 30/40 to 60/70 cm). The sandy-textured soil (about 96 % sand) had a mean bulk density of 1.36 g cm-3 and the organic matter
content ranged from 16–21 g kg-1 in the Ah horizon
to about 30 g kg-1 in the Bsh. In the Ah horizon, the
soil water content at -1,500 kPa (wilting point) was 0.024 ± 0.0052 cm3 cm-3 and 0.086 ± 0.007 cm3 cm-3
at -30 kPa (field capacity). The thickness of the O horizon (litter) was 2–5 cm, with about 3 cm in the experimental plot. Three different decomposition stages (each about 1 cm thick) were differentiated in the 3 cm thick litter layer, corresponding to L (undecomposed needles), F (fragmented, compressed but recognizable needles) and H (humus-like amorphous mass) layers, as defined by Pritchett & Fisher (1987). Twelve 0.5 x 0.5 m litter sample units, outlined by a rigid metal frame, were randomly collected in the experimental plot for dry mass. Litter samples were oven-dried in the laboratory at 80–85 ºC and weighed. Sticks, twigs and cones were not included as part of the litter layer. The total amount of litter was 4.27 ± 1.15 kg m-2; L and F together weighed 1.07
± 0.24 kg m-2, while the most decomposed layer H
weighed 3.20 ± 1.01 kg m-2.
Temperature and soil water measurements
Measurements were made from April 2000 to March 2001. Soil temperatures were measured with copper-constantan thermocouples in two profiles, with (P1) and without (P2) litter layer, at 0 (surface of Ah horizon), 2, 4, 8, and 16 cm depth in both the mineral profiles and at location L1 within layer L in P1. For this purpose, the litter layer in P2 was removed from a 2 x 2 m area. Temperature was also measured in the litter at two additional points within L (L2 and L3), and at one position each in the F and H layers. The air temperature within the pine stand was measured at 1.5 m height. Temperatures were registered every 60 s by a CR 10 data logger (Campbell Scientific, Inc,) and hourly and daily averages were recorded. Soil water contents under the litter layer were measured every week by the gravimetric method in 5-cm-thick layers, down to 25 cm.
Data analysis
Daily courses of soil temperature at each depth were analyzed for three days close to the autumn equinox (for similar day lengths) using Fourier series (Carson, 1963; Gupta et al., 1984). Each day represents a different soil water content and is the mean of a set of five consecutive single days: day D (12–16 September), with a mean soil water content of 0.02 ± 0.006 cm3 cm-3, close to the wilting point in the upper
25 cm of the soil (dry soil); day W (23–27 October), with a mean soil water content of 0.09 ± 0.026 cm3 cm-3,
close to field capacity (wet soil); day M (30 September -4 October), with an intermediate mean soil water content of 0.06 ± 0.012 cm3 cm-3 (moist soil).
The daily temperature variation at any depth in a homogenous and isotropic soil layer can be represented by a Fourier series of harmonics (van Wijk & De Vries, 1963):
(1)
where T(z,t) is the soil temperature (ºC) at depth z
and time t, Tave (ºC) is the average temperature in the layer during the period of oscillation, n is the nth
harmonic (n = 1 is the first harmonic corresponding to the single sinusoidal representation), ω is the daily angular frequency of the oscillation, Cz,n is the
semi-amplitude (Tmax - Tave or Tave - Tmin) of harmonic n at
depth z, and φz,n is the phase angle of the nth harmonic
at depth z.
The number of harmonics required for a good description of temperature at each depth must explain a high percentage of the total variance (ST2) of
temperature data about Tave. According to Panofsky & Brier (1958), the fraction of total variance accounted for by each of the first four harmonics is:
%Variance = [(Cn2/2)/S
T2] x 100 (for n = 1, 2 and 3)
(2) %Variance = (Cn2/ST2) x 100 (for n = 4)
Cz,n decreases exponentially with depth as follows: Cz,n = C0,n exp (-z/Dn) (3)
where C0,n is the semi-amplitude at the soil surface
and Dn is the damping depth of the thermal wave of the nth harmonic (D
1 is for the first harmonic). D1 on
days D, M and W in both profiles P1 and P2 were estimated by equation (3) based on the measured temperatures (Monteith & Unsworth, 2007).
RESULTS AND DISCUSSION
Annual course of mean monthly temperatures
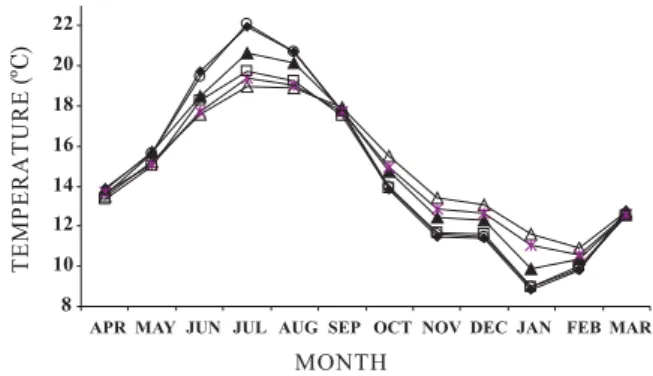
Figure 1 shows the time-course of monthly mean temperatures at L1, at the surface of the mineral soil in both profiles P1 and P2 and at 16 cm depth in P1 and P2, from April 2000 to March 2001. Corresponding values of air temperature in the pine stand are also shown for comparison. Monthly mean temperatures at L1 and at the surface of P2 ranged from about 9 to 22 ºC, and from about 10 to 20.6 ºC at the surface of the mineral soil, under the litter layer, in P1. Air temperature ranged from 9 to about 20 ºC in the same period. The smallest annual thermal amplitudes were observed at 16 cm depth in both profiles (about 8 ºC in P1 and 9 ºC in P2). Mean monthly temperatures at all depths and in the air were minimum in January and maximum in July, according to the annual course of solar irradiance.
The presence of the litter layer reduced the annual thermal amplitudes and thermal amplitude gradients in the mineral soil underneath compared to the soil without litter layer, due to both lower maximum in summer and higher minimum in winter. In fact, mean monthly temperatures at the surface of the
mineral soil were significantly (*p < 0.05) greater in P2 than in P1 in June and July and at 16 cm depth in July and were significantly (*p < 0.05) greater in P1 than in P2 in November and at 16 cm depth from November to January. The differences between P1 and P2 temperatures at the surface of the mineral soil reached about 1.5 ºC in July and about 1.0 ºC in November. In a pure stand of Coultier pine grown in the Mediterranean conditions of California, Johnson-Maynard et al. (2004) measured annual thermal amplitudes (12 ºC) similar to those in this study at the mineral surface of a clayey soil under a 10 cm thick litter layer (including a L sub-layer with 4 cm). However, they found smaller thermal amplitude gradients than those measured here down to 50 cm of the soil profile, probably due to the thicker litter layer. At all depths in both profiles mean annual temperatures were about 15 ºC, supporting the concept of a unique mean annual temperature in the soil profile, unaffected by the presence of the litter layer. Mean annual temperatures ranged from 14.8 ºC in both the O horizon of P1 and 16 cm depth of P1 and P2 to 15 ºC at the surface of the mineral soil in P1 and P2. Constant mean annual temperatures along the soil profile have been reported in numerous situations (Carson, 1963; Andrade, 2001), including under the litter layer of pure stands of Coulter Pine, chamise and scrub oak stands (Johnson-Maynard et al., 2004).
Mean daily temperatures
On each day, mean daily temperatures within the whole litter layer (Table 1) were significantly similar (*p < 0.05), showing no spatial differences (both in the L sub-layer and between L, F and H sub-layers) of the soil thermal behavior in the experimental area. Then, P1 was taken as representative of the soil profile under the pine forest. Daily mean temperatures in the O horizon were 17.1 ± 0.17 ºC on day D, 16.4 ± 0.1 ºC on day M and 10.4 ± 0.3 ºC on day W. Day W, later in winter, was significantly cooler (*p < 0.05) than the other two. Mean air temperatures measured 1.5 m above ground within the pine stand on days D, M and W were 17.2 ± 0.8 ºC, 16.4 ± 0.8 ºC and 10.9 ± 0.7 ºC, and the corresponding thermal amplitudes 7.0 ± 2.2 ºC, 6.2 ± 1.4 ºC and 7.4 ± 1.2 ºC.
Figure 1. Time-course of monthly temperatures in the litter layer (♦♦♦♦♦) in P1, at the mineral soil surface in P1 ( ) and P2 (∆∆∆∆∆), at 16 cm depth in P1 ( ) and P2 ( ) and in the air ( ), from April 2000 to March 2001 ( P1 is the profile with litter layer and P2 without).
Table 1. Mean and standard deviation values of average daily temperatures in L, F and H litter sub-layers on days D (dry soil), M (moist soil) and W (wet soil), in a pine-forested Haplic Podzol
The mean daily temperatures were nearly constant along both soil profiles on days D and M (Table 2), but increased significantly (*p < 0.05) with depth on day W along both P1 (3.5 ºC) and P2 (2.4 ºC). Mean daily temperatures for the whole profiles on days D and M were 17.7 ± 0.3 ºC and 16.8 ± 0.2 ºC in P1 and 17.4 ± 0.4 ºC and 16.4 ± 0.3 ºC in P2, respectively. Both profiles on day W were in a cool period as a result of the annual course of net radiation at the soil surface at these latitudes. Non-constant mean temperatures along soil profiles were also found in a silt loam bare soil in Rosemount, USA, in summer, spring and autumn (Gupta et al.,1984), and in clay loam and sandy loam bare soils in Lisboa and Évora, Portugal, in the winter (Andrade, 2001).
The litter layer increased mean daily temperatures of the mineral soil underneath, during the cool period of the year. In fact, mean daily temperatures at any depth of the mineral soil on day W were significantly (*p < 0.05) greater (1 to 1.5 ºC) in P1 than in P2, while no differences between profiles were found on days D and M (Table 2). Warmer and moist soil conditions under the litter layer during winter, the cold and rainy season in Mediterranean climates, are expected to promote soil biological activity and the rates of organic matter mineralization and root development (Boone et al., 1998; Bonito et al., 2003; Liu et al., 2010), when compared to those in cooler and moist soils without litter cover.
Daily cycles
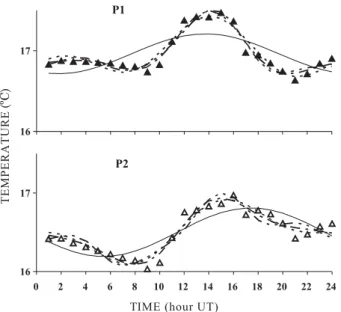
Measured and Fourier-simulated hourly litter layer temperatures are illustrated in figure 2 and similar courses of temperature are shown at the mineral soil surface (Figure 3) and at 16 cm depth (Figure 4) in both profiles. Only day M is represented, since the patterns of variation were identical to those on the other days. Time-courses of mineral soil temperature at 2 and 4 cm depth are represented by those at the surface; at 8 cm they were similar to those at 16 cm. Fourier series with equation (1) were
simulated using the average temperature at each depth, since mean daily temperatures were not invariant along both soil profiles on day W.
The measured daily variation of temperature in the litter layer (Figure 2) and down to 4 cm depth in the Ah horizon (Figure 3) was harmonic in both profiles. However, the use of the first harmonic alone was not adequate to describe the daily thermal variation, mainly because maximum temperatures were underestimated at 1–3 ºC and warming periods were overestimated; observed warming periods were shorter than the standard 12 h defined by the first harmonic, lasting from 6 to 10 h. To minimize this problem, higher order harmonics were fitted to the
Table 2. Mean and standard deviation values of average daily temperatures in soil profiles P1 and P2, on days D (dry soil), M (moist soil) and W (wet soil) in a pine-forested Haplic Podzol
(1) Depths refer to mineral soil; L1 is in the litter layer.
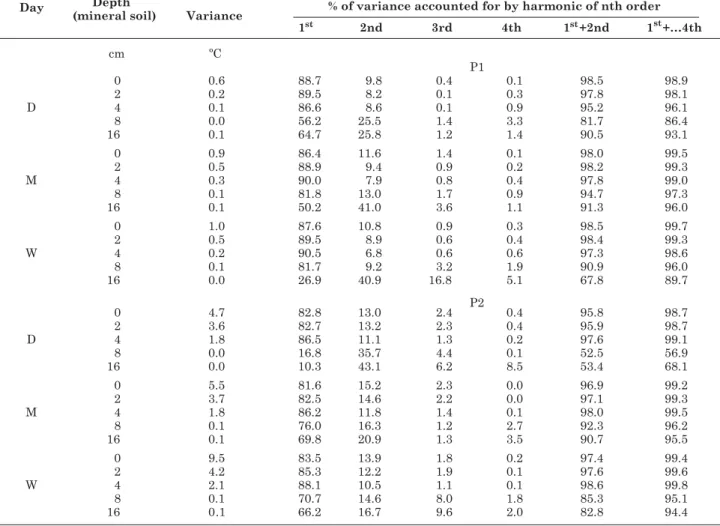
upper 30 cm of a silty-loam soil (Gupta et al., 1984) in USA (Df climate) or at 5 cm depth in a sandy loam soil (Ghuman & Lal, 1982) in Nigeria (Am climate). From 8 to 16 cm depth in the Ah horizon (Figure 4), daily temperature variation was much smaller than in the upper layers, so that the harmonic behavior of daily temperature in both profiles was not as clear. In addition, more than one warming period was observed occasionally at these depths in both profiles. The relative contribution of the first harmonic was more variable and smaller than closer to the soil surface, particularly at 16 cm depth (Table 4). The
Table 3. Total variance of temperature in L, F and H litter sub-layers in a pine-forested Haplic Podzol and the percentage accounted for by the first four Fourier harmonics on days D (dry soil), M (moist soil) and W (wet soil)
data. The total variance of soil temperatures around its daily average at each depth and the percentage accounted for by each harmonic in both profiles were calculated with equation (2) and are presented in table 3 (litter layer) and 4 (mineral soil) for the first four harmonics. The superposition of the first two harmonics in the litter layer explained more than 96 % of the total variance of measured temperatures, compared to 80–90 % generally explained by the first harmonic alone. In the upper layers of the mineral Ah horizon the first two harmonics explained more than 95 % of total variance of measured temperatures in P1 and P2, compared to 86–90 % generally explained by the first harmonic alone (Table 4). The superposition of the first two harmonics reduced the durations of the simulated warming periods, approaching them to those measured (Figures 2 and 3), making the use of the 3rd and 4th harmonics unnecessary.
Two harmonics were also required to describe the daily course of soil temperature in different types of bare soil located in different climatic areas, such as in the upper 16 cm of a sandy loam and a clay loam soils (Andrade, 2001) in Portugal (Cs climate), in the
Figure 3. Time-course of temperature at mineral soil surface measured ( , ) and simulated with the first (___) and the first two Fourier harmonics (---) in a pine-forested Haplic Podzol, with (P1) and without (P2) litter layer, on day M (moist soil).
superposition of the first two harmonics explained about 68 to 95 % of total variance of temperature measured at each depth in P1 and about 52 to 92 % in P2 (Table 4). The superposition of the first four harmonics explained generally more than 90 %, except in P2 on day D where it explained less than 70 %. Thermocouple sensitivity of the same order of magnitude of thermal amplitudes at these depths might help explain part of the failure to fit a harmonic behavior to the daily temperature course.
Thermal wave damping with depth
Thermal amplitudes in both the litter layer and the mineral soil decreased with increasing depth in the soil due to the damping of the daily temperature heat wave along the profiles. Daily thermal amplitudes in the litter layer decreased significantly (*p < 0.05) from about 10 ºC in the L to 4 ºC in the H layers (Table 5). Daily thermal amplitudes also decreased markedly with depth in both mineral soil
profiles (Table 6), and at 8 and 16 cm depth they were between 1 and 1.8 ºC only. Thermal amplitudes along both soil profiles were considerably smaller than those measured in sandy loam and clay loam bare soils in Portugal (Andrade, 2001), which ranged from 16 to 28 ºC at soil surface in similar periods of the year.
Table 4. Total variance of soil temperature in P1 and P2 mineral soil profiles on days D (dry soil), M (moist soil) and W (wet soil) in a pine-forested Haplic Podzol, and the percentage accounted for by the first four Fourier harmonics
The low amplitudes were probably due to the shading and shelter effect of the pine canopy, which reduced radiative and convective heat exchanges between the soil and the atmosphere. Significant reductions in daily thermal amplitudes under a rain forest were found by Ghuman & Lal (1987) in the humid belt of Nigeria when compared to those measured in an open area, and by Morecroft et al. (1998) in woodland of pedunculate oak and sycamore in contrast to those observed under grass and bare soil. A similar effect was reported by Hashimoto & Susuki (2004), when annual thermal amplitudes before and after clear-cutting of sugi and japanese cypress stands were compared.
The litter layer had a strong effect on the thermal amplitudes close to the surface in the mineral soil. Down to 4 cm in the Ah horizon, amplitudes were significantly larger (*p < 0.05) on any day in P2 (without litter layer) than in P1 (Table 6). For example, at the surface of mineral soil amplitude differences between P2 and P1 ranged from 5 ºC on day D to 6.7 ºC on day W. Since no differences between profiles were found at greater depths, gradients of thermal amplitudes along the Ah horizon were considerably lower in P1 than in P2. The litter layer reduced both the heating of the mineral soil underneath during the day and the cooling during the night, probably because the porosity of the layer strongly decreases its thermal conductivity (Barkley et al., 1965). The effect of the litter layer on the daily fluctuation of soil temperature must be taken into account in models predicting forest soil temperature, as does the model presented by Kang et al. (2000), particularly in cool regions, where litter layers are thick due to the low decomposition rates.
The gradient of thermal amplitudes along the soil profile is expected to be lower in wet than in dry soil due to the large heat capacity of water compared to that of the air. However, table 6 shows that in P1 thermal amplitudes within the litter layer and down to 16 cm in the Ah horizon were not significantly (*p < 0.05) different between days D, M and W. The presence of both the canopy cover and litter layer
overcame the effect of different soil water contents between days on thermal amplitudes in this profile. The presence of canopy cover alone in P2 had the same effect at any depth on days D and M and down to 4 cm on day W. Only at 8 and 16 cm depth on day W, thermal amplitudes in P2 were significantly higher (*p < 0.05) than those on days D and M. The effect of water to reduce gradients of thermal amplitudes along the soil profile was only notorious deep in wet soil and when the thermal insulation provided by the litter layer (in addition to that of the canopy) was removed. Thermal amplitude gradients in the soil affect damping depths. Mean daily damping depths for the first harmonic only (D1) shown in table 7 were
estimated fitting equation (3) to the measured daily thermal amplitudes throughout the profiles P1 and P2 and in the mineral soil profile in P1. Strictly, equation (3) is only applicable if mean temperatures are invariant along the soil profile. However, most models to predict daily and seasonal changes of soil temperature assume a constant mean soil temperature along the profile (Kang et al., 2000; Paul et al., 2004), irrespectively of the soil type and period of the year, to be able to use the equation. The fitted regressions were significant (*p < 0.05) on all single days, showing
Table 6. Mean and standard deviation values of average daily thermal amplitudes in soil profiles P1 and P2 on days D (dry soil), M (moist soil) and W (wet soil), in a pine-forested Haplic Podzol
At each depth, values followed by different letters are significantly different (*p < 0.05).
Table 7. Damping depth in soil profiles P1 (entire and mineral soil only) and P2 estimated from measured thermal amplitudes on days D (dry soil), M (moist soil) and W (wet soil), in a pine-forested Haplic Podzol
that the daily thermal amplitudes decreased exponentially with increasing depth, even on day W. Mean D1 dailyvalues in the entire profiles ranged from 7.1 to 10.6 cm (Table 7) and are consistent with those presented by van Wijk & De Vries (1963) for sandy soils with water contents lower than 0.1 cm3 cm-3. On days D and M, D
1 values were
significantly greater in the entire P1 (*p < 0.05) than in P2, while no differences between profiles were found on day W. The rise in soil water content from day D to day W increased D1 values significantly (*p < 0.05) in P2 but not in P1, showing that the effect of soil water on the damping depth was evident only when no litter was present. Independently of soil water content, the presence of a 3 cm thick litter layer under the pine cover increased the damping depth of the daily heat wave in the sandy soil similarly to that of water in a very wet soil without litter layer.
D1 values calculated in P1 for the mineral soil only
(Table 7) were significantly higher (*p < 0.05) than those for the entire profile and for P2 due to the lower temperature amplitude gradients in the Ah horizon under the litter layer. When litter was present, the velocity of the thermal wave into the mineral soil was apparently greater but the heat flux through the mineral soil surface was lower than in the absence of litter layer.
The effect of litter layer is similar to that of some opaque mulches widely used in agricultural practices (Bussière & Cellier, 1994), reducing heat exchange between soil and atmosphere and making the mineral soil a more thermally moderate environment. In forests, temperature-dependent soil biological processes are expected to be favored by the reduction of thermal amplitudes, so that retention of the litter layer may improve the rates of organic matter mineralization and root development in established plantations. Since soil temperature regime under the litter layer is similar to that in a wet soil without litter layer in the cool season, litter retention is further supported by the present climate variation in Portugal, where reduced rainfall at the end of the winter over the last 40 years (Miranda et al., 2002) has led to drier soils in early spring. However, the extent of litter layer effects on the soil thermal regime may depend on the combination between the thickness of the layer and the degree of canopy cover: probably, the denser the canopy the smaller the litter layer effect, an issue that deserves further attention.
CONCLUSIONS
The pine forest litter layer acts as a soil thermal insulator, in addition to the canopy cover, strongly reducing daily and annual soil temperature amplitudes and gradients in the subjacent mineral horizon and increasing daily damping depths. In addition, the litter layer increases mean daily soil temperatures in
cold and wet soil. Apart from these cases, soil water content had no effect on the soil thermal regime under the litter layer. Daily courses of temperature in the litter layer and the upper layers of the sandy soil with or without litter layer were well-described by the first two Fourier harmonics, facilitating the simulation of soil temperature variations. Retention of the litter layer must be a forest management practice to follow in general, while litter removal must be recommended in extreme cases only.
ACKNOWLEDGEMENTS
The authors are indebted to the CICLUS Project (Fundação para a Ciência e Tecnologia, Portugal) for financial support.
LITERATURE CITED
AHRENS, C.D. Meteorology today. Thomson, Pacific Grove, 2003. 624p.
ANDRADE, J. Temperatura do solo (e análise de Fourier), humidade do solo e desenvolvimento inicial de várias culturas em solos Pmg e Cb. Évora, Universidade de Évora, 2001. 341p. (Tese de Doutorado)
BARKLEY, D.G.; BLASER, R.E. & SCHMIDT, R.E. Effect of mulches on microclimate and turf establishment. Agron. J., 57:189-192, 1965.
BOONE, R.D.; NADEHOFLER, K.J.; CANARY, J.D. & KAYE J.P. Roots exert a strong influence on the temperature sensitivity of soil respiration. Nature, 396:570-572, 1998. BONITO, G.; COLEMAN, D. & HAINES, B. Can nitrogen budgets explain differences in soil nitrogen mineralization rates of forest stands along an elevation gradient? For. Ecol. Manag.,176:563-574, 2003.
BUSSIÈRE, F. & CELLIER, P. Modification of the soil temperature and water content regimes by a crop residue mulch: Experiment and modelling. Agric. For. Meteorol., 68:1-28, 1994.
CARSON, J.E. Analysis of soil and air temperatures by Fourier techniques. J. Geophys. Res., 68:2217-2232, 1963. CUBERA, E.; MONTERO, M.J. & MORENO, G. Effect of land
use on the soil water dynamic in dehesas of Central-Western Spain. In: SCHABEL, S. & GONÇALVES, A., eds. Sustainability of agrosilvopastoral systems – dehesas, montados. Reiskirchen, Catena Verlag, 2004. (Advances in GeoEcology, 37)
DGRF. Estatísticas Nacionais de Incêndios Florestais. Access under: <http://www.dgrf.min-agricultura.pt>. Access date: Jan.29 2007.
GHUMAN, B. & LAL, R. Effects of partial clearing on microclimate in a humid tropical forest. Agric. For. Meteorol., 40:17-29, 1987.
GUPTA, S.C.; LARSON, W.E. & ALLMARAS, R.R. Predicting soil temperature and soil heat flux under different tillage-surface residue conditions. Soil Sci. Soc. Am. J., 48:223-232, 1984.
HASHIMOTO, S. & SUSUKI, M. The impact of forest clear-cutting on soil temperature; A comparison between before and after cutting, and between clear-cutting and control sites. J. For. Res., 9:125-132, 2004.
IPCC Fourth Assessment report. Access under: <http:// www.ipcc.ch/ipccreports/ar4-syr.htm>. Access date: Jan. 15, 2007.
JOHNSON-MAYNARD, J.L.; SHOUSE, P.J.; GRAHAM, R.C.; CASTIGLIONE, P. & QUIDEAU, S.A. Microclimate and pedogenic implications in a 50-year-old chaparral and pine biosequence. Soil Sci. Soc. Am. J., 68:876-884, 2004. JONES, H.E.; MADEIRA, M.; HERRAEZ, L.; DIGHTON, J.;
FABIÃO, A.; GONZÁLEZ-RIO, F.; FERNANDEZ MARCOS, M.; GOMEZ, C.; TOMÉ, M.; FEITH, H.; MAGALHÃES, M.C. & HOWSON, G. The effect of organic-matter management on the productivity of Eucalyptus globulus stands in Spain and Portugal: Tree growth and harvest residue decomposition in relation to site and treatment. For. Ecol. Manag., 122:73-86, 1999. KANG, S.; KIM, S.; O.H, S. & LEE, D. Predicting spatial and
temporal patterns of soil temperature based on topography, surface cover and air temperature. For. Ecol. Manag., 36:173-184, 2000.
LIU, X.; WANG, G.; LI, J. & WANG, Q. Nitrogen isotope composition characteristics of modern plants and their variations along an altitudinal gradient in Dongling Mountain in Beijing. Sci. China Earth Sci., 53:128-140, 2010.
MEENTEMEYER, V. & BERG, B. Regional variation in rate of mass loss of Pinus sylvestris needle litter in Swedish pine forests as influenced by climate and litter quality. Scandinavian J. For. Res., 1:167-180, 1986.
MIRANDA, P.; COELHO M.F.; TOMÉ, A.R. & VALENTE, M.A. 20th century Portuguese climate and climate scenarios. In: SANTOS, F.D.; FORBES, K. & MOITA, R., eds. Climate change in Portugal: Scenarios, impacts and adaptation measures, SIAM Project’. Lisboa, Gradiva, 2002. p.23-83. MONTEITH, J.L. & UNSWORTH, M.H. Principles of environmental physics. 3.ed. London, Edward Arnold, 2007. 440p.
MORECROFT, M.D.; TAYLOR, M.E. & OLIVER, H.R. Air and soil microclimates of deciduous woodland compared to an open site. Agric. For. Meteorol., 90:141-156, 1998. PANOFSKY, H.A. & BRIER, G.W. Some applications of
statistics to meteorology. Pennsylvania State, University Press, 1958. 224p.
PAUL, K.I.; POLGLASE, P.J.; SMETHURST, P.J.; O’CONNELL, A.M.; CARLYLE, C.J. & KHANNA, P.K. Soil temperature under forests: A simple model for predicting soil temperature under a range of forest types. Agric. For. Meteorol., 121:167-182, 2004.
PRITCHETT, W.L. & FISHER, R.F. Properties and management of forest soils 2.ed. New York, John Willey & Sons, 1987. 512p.
PROE, M.F. & DUTCH, J. Impact of whole-tree harvesting on second-rotation growth of Sitka spruce: The first 10 years. For. Ecol. Manag.,66:39-54, 1994.
van WIJK, W.R. & DE VRIES, D.A. Periodic temperature variations in homogeneous soil. In: van WIJK, W.R., ed. Physics of the plant environment. Amsterdam, North-Holland, 1963. p.102-143.