www.biogeosciences.net/7/1133/2010/
© Author(s) 2010. This work is distributed under the Creative Commons Attribution 3.0 License.
Biogeosciences
Effects of environmental factors and soil properties on topographic
variations of soil respiration
K. Tamai
Forestry and Forest Products Research Institute, Tsukuba, Japan
Received: 24 August 2009 – Published in Biogeosciences Discuss.: 24 November 2009 Revised: 17 March 2010 – Accepted: 17 March 2010 – Published: 26 March 2010
Abstract.Soil respiration rates were measured along
differ-ent parts of a slope in (a) an evergreen forest with common brown forest soil and (b) a deciduous forest with immature soil. The effects of soil temperature, soil moisture and soil properties were estimated individually, and the magnitudes of these effects in the deciduous and evergreen forests were compared. In the evergreen forest with common brown forest soil, soil properties had the greatest effect on soil respiration rates, followed by soil moisture and soil temperature. These results may be explained by the fact that different soil proper-ties matured within different environments. It can be argued that the low soil respiration rates in the low parts of the slope in the evergreen forest resulted from soil properties and not from wet soil conditions. In the deciduous forest, soil respi-ration rates were more strongly affected by soil moisture and soil temperature than by soil properties. These effects were likely due to the immaturity of the forest soil.
1 Introduction
To estimate carbon uptake in forests, several researchers have compared soil respiration rates with tower-based flux mea-surements (Davidson et al., 2002; Kominami et al., 2003; Sugawara et al., 2005). However, for scientifically robust comparisons, the soil respiration rates must represent an area as large as the area represented by the tower-based flux. Such a requirement is problematic, because many factors such as topography can cause substantial spatial variation in soil res-piration rates.
Studies of spatial variation have been focused on a various scale, ranging from several meters (Kosugi et al., 2007) to a
Correspondence to:K. Tamai ([email protected])
national scale (Ishizuka et al., 2006). Because most forested areas in Japan involve complex terrain, the topographic scale is extremely important when comparing soil respiration rates with tower-based fluxes.
Soil respiration rates are affected by environmental factors such as soil moisture and soil temperature (Davidson et al., 1998) and by soil properties such as root biomass and poros-ity (Hanson et al., 2000; Dannoura et al., 2006). Therefore, both environmental factors and soil properties can affect to-pographic variation in soil respiration. Generally, soil mois-ture declines as elevation along a slope increases. Moreover, due to soil classifications, soil type is often different from each other between low and high parts in a slope. Thus, slope scale should focus on the various topological scales to esti-mate topological effect on soil respiration.
Spatial variation in soil respiration on slopes has been ex-amined in many forest types including Japanese cedar forests (Ohashi et al., 2007), Japanese cypress forests (Mitani et al., 2006), deciduous broadleaf forests (Hanson et al., 1993; Jia et al., 2003) and tropical rain forests (Sotta et al., 2006; Ko-sugi et al., 2007). The slope heights in these studies varied substantially (between 7 and 70 m), but most studies reported lower soil respiration rates in lower parts of the slopes. Jia et al. (2003), Mitani et al. (2006) and Kosugi et al. (2007) noted that the decreased soil respiration rates on lower slopes were caused by higher soil moisture ratios. However, in a study of a weathered granitic area of southern Kyoto Prefecture, Tamai et al. (2005a) linked lower soil respiration rates in ar-eas of elevated topography to incrar-eased dryness. This result shows that the relationship between soil respiration and soil moisture is not unique to any forest and remains unclear.
To ensure that soil respiration rates represent an area as large as the area represented by tower-based fluxes, estimates of the effects of environmental factors and soil properties are necessary (Fang et al., 1998). However, it is important to note that environmental factors and soil properties both
vary depending on slope locations. Most soil properties such as carbon content, soil microorganisms, root biomass and porosity exist under unique environmental conditions such as soil moisture at each location during the process of soil maturation. Thus, it is impossible to estimate environmental factors and soil properties individually by simply comparing the spatial variations of environmental factors and soil prop-erties with soil respiration.
Some studies have been performed to estimate these varia-tions individually. In a secondary broadleaf forest in northern Japan, Hashimoto et al. (2008) examined the spatial variation of environmental factors such as the soil moisture ratio and physical factors such as the basal area of stems and soil respi-ration. The researchers concluded that the basal area of stems potentially affects soil respiration via the soil moisture ratio. Palmroth et al. (2005) measured soil respiration rates in adja-cent pine plantations and hardwood areas in the Duke Forest, North Carolina, USA. They reported that differences in soil respiration rates were more strongly controlled by the effects of soil temperature than by soil moisture or soil properties.
In this study, the effects of environmental factors including soil moisture and soil temperature and soil property on soil respiration are estimated individually in a slope scale. The effects in an evergreen forest with common forest soil that developed individually under each environmental condition on a slope are compared with the effects in a deciduous forest with very immature soil that is not developed and has similar properties on a slope.
2 Site Description
The study sites were located in the Yamashiro. Experimen-tal Forest (34◦
47′ N, 135◦
51′
E) and the Kahoku Experimen-tal Forest (33◦
08′
N, 130◦ 43′
E) in Japan (Fig. 1a). The Ya-mashiro forest is a deciduous forest with immature soil, and the Kahoku forest is an evergreen forest with common brown forest soil.
2.1 Yamashiro experimental forest
The Yamashiro Experimental Forest has been denuded by heavy logging and soil erosion. The ground surface has been barren with no vegetation for a long time. A picture drawn in the seventeenth century shows that the Yamashiro area had no vegetation at that time (Yamashiro town history ed-itorial board, 1986) and remained bare until erosion control and plantation work was performed after 1875 (Goto et al., 2004). Thus, the soil in this location is immature, even today (Araki et al., 1997). The soils, which originate from granite, are Regosols of sandy loam or loamy sand and contain fine granitic gravel (53% by weight). Consequently, the surface soil layer at a 5-cm depth has carbon ratios ranging from 38 to 42 mg g−1(Table 1). Most of the trees planted after 1875 have died, and the area is currently covered by deciduous
Table 1.Outline of the observation plots.
Experimental Plot Slope Slope Altitude Basal area Dominant Total C Forest name direction angle (m) of stem species (mg g−1)
(m2100 m−2)
Yamashiro V S 53◦W 2◦ 188 0.131 Clethra barvinervis 42
R S 52◦E 18◦ 222 0.322 Ilex pedunclosa 38 Kahoku B S 48◦W 43◦ 166 0.753 Cryptomeria japonica 81
M S 32◦W 32◦ 184 0.564 Cryptomeria japonica 62
U S 5◦W 22◦ 213 0.382 Chamaecyparis obtusa Sieb. et Zucc. 118
T S 17◦E 6◦ 221 3.855 Chamaecyparis obtusa Sieb. et Zucc. 79
Table 2.Comparison of the variations in factors between experimental forests.
Experimental Variation Variation Variation Forest in topography in vegetation in Soil property Yamashiro Remarkable; Altitude Slight; All plots is Slight;
difference is≈30 m covered by deciduous species. Extremely immature soil Kahoku Remarkable; Altitude Remarkable; Japanese cedar Supposed to be remarkable;
difference is≈70 m (Plot B, M) Japanese cypress (Plot U, T) matured forest soil Duke Slight; Slope angle<5% Remarkable; Hard wood forest
(Palmroth et al., 2005) and pine plantation
est dominated by oaks. The mean annual precipitation from 1999 to 2002 was 1449.1 mm, with a mean air temperature of 15.5◦
C (Goto et al., 2003).
2.2 Kahoku experimental forest
The lower area of the Kahoku Experimental Forest is cov-ered by an approximately 50-year-old Japanese cedar (Cryp-tomeria japonica) forest and the upper area is covered by a 27- to 50-year-old Japanese cypress (Chamaecyparis obtusa Sieb. et Zucc.) forest. Crystalline schist underlies the water-shed. The forest soil is classified as brown forest soil (Cam-bisol) with a clay loam texture. This soil is common and judged to be more mature than that in Yamashiro. The mean annual precipitation from 1992 to 2003 was 2160 mm, and the mean annual air temperature was 15.4◦
C for the same time period. (Kobayashi and Shimizu, 2007). Detailed soil information has been provided by Ishizuka et al. (2006). The carbon ratios of the soil surface layer are larger than those at Yamashiro, ranging from 78 to 119 mg g−1. The basal area tends to have a larger ratio at the plots at lower altitude, al-though the carbon ratio does not reflect this tendency as it relates to slope location (Table 1).
2.3 Comparison of the features of experimental forests
The features of the experimental forests including the Duke Forest (Palmroth et al., 2005) are summarized in Table 2. These features are compared with those for this study and are presented in the Discussion section.
Altitudinal differences existed at approximately 30 m and 70 m in the Yamashiro and Kahoku forests, respectively. To-pographic variability was lower in the pine plantation and hardwood plots of the Duke Forest, with<5% incline in each (Palmroth et al., 2005).
The difference in vegetation among the plots in Yamashiro is smaller than those in Kahoku and Duke. The Yamashiro Experimental Forest, which is dominated by oaks, exhibits little variation in tree species. Conversely, at the Kahoku Experimental Forest, Plots L and M were dominated by Japanese cedar, and Plots U and T were dominated by Japanese cypress. The difference in the soil property among the plots is supposed to be the smallest in Yamashiro, where soils are immature because of heavy disturbance in the past. Thus, soil property is supposed to be same in Plots V and R. In contrast, the soil in Kahoku, which is brown forest soil with an organized soil structure, is supposed to vary greatly among each plot compared to that in Yamashiro. For ex-ample, Kobayashi and Shimizu (2007) reported that soil wa-ter repellency occurred below a threshold wawa-ter content of approximately 0.29 m3m−3 on the top part of the slope in
Kahoku. Moreover, the soil in the lower part of the slope in Kahoku includes many fist-sized stones that rolled to the base of the slope and accumulated there.
3 Observation methodology
3.1 Yamashiro experimental forest
The Yamashiro Experimental Forest is located in a moun-tainous area and includes an approximately 10-m-wide valley with a 30-m-high ridge (Fig. 1b). The plots are 10 m×10 m. Plot V was at the valley bottom, and Plot R was on a ridge above the valley (see Table 1 for plot details). The distance between the plots was approximately 70-m horizontally and 30-m vertically.
The automated chamber system, with a closed static cham-ber of transparent acrylic, was used to monitor soil respira-tion at the centre of each plot. The inner space of the chamber had a cross section of 28 cm×13 cm and was 13-cm high. A stainless steel collar was inserted into the soil at 10-cm depth, and a motor opened and closed the chamber lid au-tomatically (Tamai et al., 2005b). An infrared gas analyzer (IRGA; GMT222, Vaisala, Finland) and thermocouple en-closed in the chamber monitored the CO2concentration ra-tio and air temperature. Nobuhiro et al. (2003) and Tamai et al. (2005b) verified the accuracy of this type of enclosed IRGA chamber. The soil temperature and soil moisture ra-tio were monitored simultaneously at a 5-cm depth with a SS-201A (Rogu Denshi, Japan) and a HYDRA (Stevens Vi-tel, USA), respectively, in both plots. No plants were present in the automated chamber. Observations were made from July 2004 to June 2005. Throughout the winter (December– March), the automated chamber was closed to take measure-ments at 30-min intervals and then opened and inactive for 150-min intervals. The active and inactive intervals were 12 and 48 min, respectively, for the remaining months. Soil res-piration was monitored by the automated chamber at 1-h in-tervals in summer and 3-h inin-tervals in winter. Analyses were based on the daily average rate.
To investigate spatial variation in the soil respiration rate, measurements were performed around the automated cham-ber by manually placing an IRGA (GMD-20, Vaisala) en-closed chamber onto eight soil collars set around the auto-mated chamber and inserting it into the soil at a 5-cm depth. The inner space of the chamber was a circle 9.1 cm in di-ameter and 13-cm high (Tamai et al., 2005a). No plants were present in the soil collars. The manual chamber ob-servations were performed 11 times at Plot V and 10 times at Plot R. Manual measurements were taken once or twice a day in the afternoon. The manual chamber was closed for 30 min from December to March and for 12 min for the other months. The closed times for the automated and manual chambers were 12 or 30 min; these time periods were rela-tively longer than those in other studies (Mitani et al., 2006;
Kosugi et al., 2007). However, it was confirmed that the CO2 concentration in the chamber increased linearly while below 1300 ppm, beyond which CO2 concentration rate tended to decrease (Nobuhiro et al., 2003). The CO2concentration in the chamber took much longer than 12 or 30 min to increase to around 1300 ppm in this experimental forest (Nobuhiro et al., 2003). Thus, the closed times of 12 or 30 min did not cause underestimation of Soil respiration.
3.2 Kahoku experimental forest
In Kahoku, Plots T, U, M and L were established at the top, upper, middle and lower areas, respectively, of a south-facing slope that was approximately 70-m high (Fig. 1c). Detailed plot information is provided in Table 1. The plot size was 10 m×10 m. The soil respiration was measured for 24 soil collars at the centre in each plot using the manual chamber that was used at Yamashiro. Measurements were performed 13 to 14 times in each plot from August 2005 to August 2006. The distances between the collars were around 20 to 30 cm. The frequency was once or twice each month. The closed time of the manual chamber was 30 min from December to March and 12 min for other months. The soil temperature (S-TMB, Onset, USA) and soil moisture (S-SMA, Onset) at a 5-cm depth were also monitored. The soil respiration rates presented in this study correspond to the average rates mea-sured for the 24 soil collars in each plot.
4 Analysis method
The soil respiration rate was calculated from the soil temper-ature and soil moisture using Eq. (1) (Tamai et al., 2005b; Palmroth et al., 2005):
Fp Tp,θp=aEXP(bTp) θ
p c+θp
(1)
whereFp(Tp,θp)is the soil respiration rate (mg CO2m−2 s−1),T is the soil temperature (◦
C) at 5-cm depth,θ is the soil moisture ratio (m3m−3)at 5-cm depth, anda,b andc are constants. The subscript letter denotes the name of the test plot, withp= R, V, T, U, M or L.
The magnitudes of the effects of soil temperature, soil moisture and soil properties on soil respiration rates were es-timated individually using Eqs. (2), (3) and (4), respectively:
EF (T )=Fc(Tt,θc)−Fc(Tc,θc) (2) EF (θ )=Fc(Tc,θt)−Fc(Tc,θc) (3) EF (Soil)=Ft(Tc,θc)−Fc(Tc,θc) (4) where terms with subscriptscandt refer to parameters for the control plot and test plot, respectively.
relevant terms on the right-hand side of Eqs. (2) through (4) to estimate the magnitude of the effect of each parameter on the soil respiration rate. For example, to estimate the effect ofT on the difference in soil respiration rates between the test plot and control plot, values ofa,b,candθ for the con-trol plot were substituted into both terms of the right-hand side of Eq. (2). Only values ofT for test and control plots were substituted into the first and second terms, respectively, of the right-hand side of Eq. (2). Equation (4) can be used to estimate the effect of soil properties on soil respiration rate, because its parameters,a,bandc, are thought to represent features of soil properties (Palmroth et al., 2005). Positive, negative and larger absolute values calculated using Eqs. (2) through (4) imply accelerated, suppressed and greater influ-ence, respectively, of each factor on the soil respiration rate.
5 Results
5.1 Yamashiro experimental forest
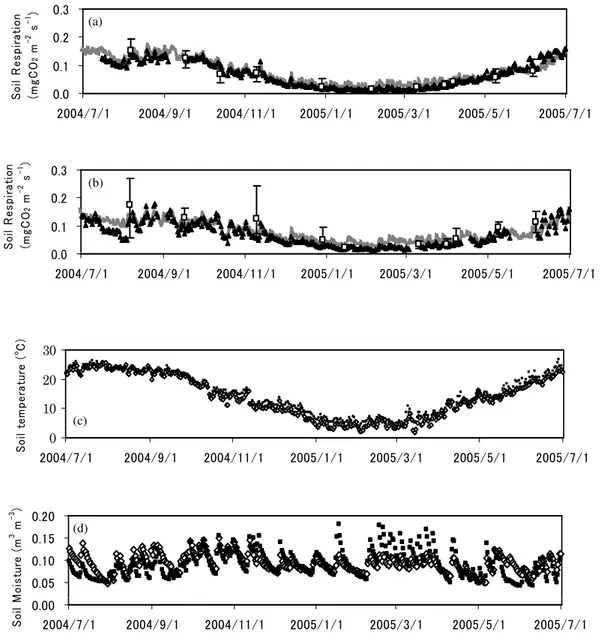
Figures 2a and b present seasonal variations in the soil res-piration rate (F) at Plots V and R, respectively. Spatial vari-ation inF within each plot was large, with the widest range of values recorded in the manual chamber (approximately 0.2 mg CO2m−2s−1). Nevertheless, the soil respiration rate recorded by the automated chamber and the average respira-tion rate based on data from the manual chamber were almost identical in every case. These results suggest that the value ofF measured with the automated chamber can be regarded as the soil respiration rate for each plot.
TRwas slightly higher thanTV in winter, andθV tended to be slightly higher thanθR(Fig. 2d). However, this difference was, in general, very small.
Using the minimum total square difference method to es-timate the values for the constants in Eq. (1) for Plots R and V, Eq. (1) can be written as Eqs. (5) and (6), respectively:
FR(TR,θR)=0.1111EXP(0.1000TR) θ
R 0.6752+θR
(5)
FV(TV,θV)=0.0424EXP(0.0878TV) θ
V
0.1368+θV
(6) The soil respiration rates for Plots R and V, calculated us-ing Eqs. (5) and (6), respectively, agreed well with the measured soil respiration rates (Fig. 3). The root mean square error between the calculated and observed respira-tion rates and the ratio between the two over the average observed ratio were 0.0002 mg CO2m−2s−1and 1.1% and 0.0002 mg CO2m−2s−1and 1.1% for Plots R and V, respec-tively.
5.2 Kahoku experimental forest
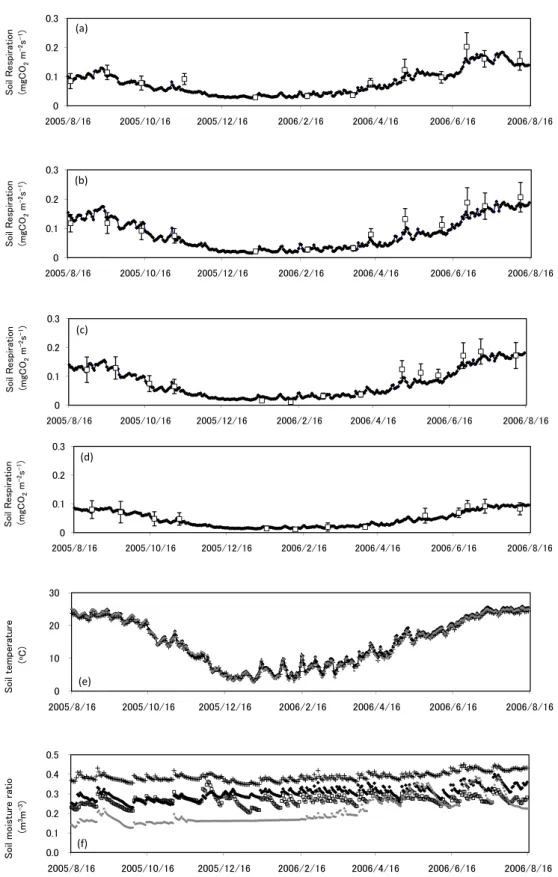
T andθ were compared in each of the four plots (Figs. 4e, f). The results indicate that the measured values ofT were
almost the same in each of the four plots. However, the mea-sured values of θ differed greatly between the plots. Plot L generally had the highestθ values, but the values fluctu-ated the least within a narrow range of values forθL(0.35– 0.45 m3m−3). The widest range ofθwas recorded at Plot T, where the measured values forθT ranged between 0.12 and 0.38 m3m−3. Interestingly, while rapid increases inθ
U,θM
andθL were recorded after a precipitation event, no com-parable increases inθT were measured, particularly during winter. Kobayashi and Shimizu (2007) attributed water re-pellency in forest soil in the Kahoku Experimental Forest to soil dryness. We also propose soil repellency as the reason for the lack of an observed increase inθT following a rainfall event during this study. Indeed, soil moisture differed greatly between the four Kahoku plots.
Using the minimum total square difference method to cal-culate the constants, Eq. (1) can be rewritten as Eqs. (7, 8, 9 and 10) for Plots T, U, M and L, respectively.
FT(TT,θT)=0.0904EXP(0.0619TT) θ
T
0.4648+θT
(7)
FU(TU,θU)=0.0464EXP(0.1049TU) θ
U
0.6935+θU
(8)
FM(TM,θM)=0.0357EXP(0.0969TM) θ
M 0.4716+θM
(9)
FL(TL,θL)=0.0159EXP(0.0890TL) θ
L 0.1989+θL
(10) The soil respiration rates calculated using Eqs. (7) through (10) agreed well with the observations made at the Kahoku plots (Fig. 5). Seasonal changes in soil respiration rates for Plots T, U, M and L, calculated using Eqs. (7) through (10), are shown in Figs. 4a through d, respectively. The root mean square error between the calculated and observed rates and the ratio of the two over the averaged observed ra-tio in the four plots were 0.014 mg CO2m−2s−1and 14.6%, 0.014 mg CO2m−2s−1 and 12.7%, 0.005 mg CO2m−2s−1 and 9.9% and 0.017 mg CO2m−2s−1and 16.6% for Plots T, U, M and L, respectively.
5.3 Spatial variations of the estimated annual soil
respiration rates and observed environmental factors
The annual rate ofF was estimated to be 21.56 t CO2ha−1 year−1 and 21.10 t CO2ha−1 year−1 in Plots R and V, re-spectively, in Yamashiro from 1 July 2004 to 30 June 2005 using Eqs. (5) and (6). These two rates are almost equal. These results do not agree with those of Jia et al. (2003), Mi-tani et al. (2006) and Kosigi et al. (2007), who report that the soil respiration was less at the plots on the lower part of the slope. On the other hand, the annual rate ofF was estimated to be 24.79 t CO2ha−1year−1, 25.13 t CO2ha−1year−1,
(a)
(b)
10 20 30
(c)
0
( )
M
(d)
M
Fig. 2. Seasonal variation of soil respiration, soil temperature and soil moisture ratio in Yamashiro Experimental Forest. (a)and(b), Soil respirations in Plot V and R, respectively. Black point: Observed soil respiration by automated chamber system. Gray line: Calculated soil respiration by Eqs. (5) and (6), respectively. White square: Averaged soil respiration by manual chamber system. Bar: The range of maximum and minimum rate by manual chamber. (c)and(d), Soil temperature and soil moisture, respectively, at 5 cm depth. White dot: Plot V. Black dot: Plot R.
(a) (b)
ai (a) 8 8 i eiai gCO (a) 8 8 i eiai gCO (a) (b) 8 8 i eiai gCO i eiai gCO (a) (b) 8 8 i eiai gCO 8 8 i eiai gCO (a) (b) 8 8 i eiai gCO 8 8 i eiai gCO e i a i gCO (a) (c) (b) 8 8 i eiai gCO 8 8 i eiai gCO 8 8 i eiai gCO (a) (c) (b) 8 8 i eiai gCO 8 8 i eiai gCO 8 8 i eiai gCO (a) (c) (b) iai (d) 8 8 i eiai gCO (d) 8 8 i eiai gCO (d) 8 8 i eiai gCO i eeae C (e) (d) 8 8 i eiai gCO 8 8 i eeae C (e) (d) 8 8 i eiai gCO 8 8 i eeae C e ai (e) (d) 8 8 i eiai gCO 8 8 i eeae C 8 8 i ie ai (f) (e) (d) 8 8 i eiai gCO 8 8 i eeae C 8 8 i ie ai (f) (e) (d)
Fig. 4.Seasonal variation of soil respiration, soil temperature and soil moisture ratio in Kahoku Experimental Forest. (a, b, candd), Soil respirations in Plot T, U, M and L, respectively Black line: Calculated soil respiration by Eqs. (7–10), respectively. White square: Averaged soil respiration by manual chamber system. Bar: The range of maximum and minimum rate by manual chamber.(e)Soil temperature at 5cm depth Gray dot: Plot T. Line: Plot U. Black dot: Plot M. Plus: Plot L.(f)soil moisture ratio at 5cm depth Gray dot: Plot T. White dot: Plot U. Black dot: Plot M. Plus: Plot L.
℃ ℃
Fig. 5. Comparison of observed and calculated respiration rate in Kahoku Experimental Forest. Cross: Plot T. Black diamond: Plot U. White square: Plot M. Gray diamond:Plot L.
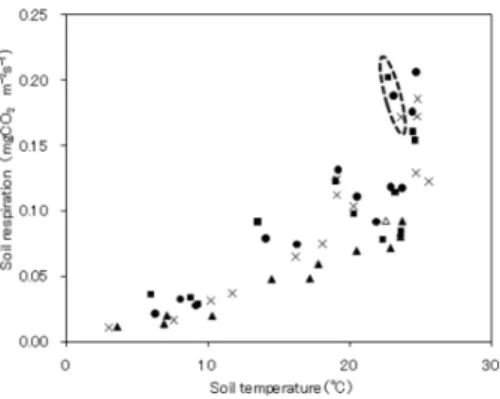
Fig. 6. Comparison between soil respiration and soil temperature in Kahoku Experimental Forest. Black square: Plot T. Black cir-cle: Plot U. Cross: Plot M. Black and white triangle: Plot L. Three points in dotted circle and white triangle were observed on 27th June, 2006.
23.87 t CO2ha−1year−1 and 14.42 t CO2ha−1year−1 for Plots T, U, M and L, respectively, in Kahoku from 16 Au-gust 2005 to 15 AuAu-gust 2006 using Eqs. (7) through (10). The rates in Plots M, U and T are not much different from each other. The fact that the rate in only Plot L is much less is in agreement with the findings of Jia et al. (2003), Mitani et al. (2006) and Kosigi et al. (2007).
Jia et al. (2003) presumed that soil moisture suppresses soil respiration at the lower slope. Figure 6 shows the re-lationship betweenF andT in four plots in Kahoku. The observed values forF in Plots T, U and M on 27 June 2006 (dotted circle in Fig. 6) were much greater than other mea-sured soil respiration rates atT ≈22◦
C. This result can be attributed to elevated values of θ at this time: 328 mm of rain fell between 22 June 2006 and 26 June 2006, and the measurements ofF were made a day after this precipitation event, whenθ was very large. The observed value ofF in Plot L on 27 June 2006 (shown as 1 in Fig. 6) was also greater than the other observed rates for Plot L.
y
y
H
y H
Plot V L U T hardwood
Yamashiro Kahoku Duke
Yamashiro Kahoku Duke
Fig. 7. Comparison of the effect on soil respiration by soil mois-ture (EF(θ)), soil temperature (EF(T)) and soil property (EF(Soil)). Black block:EF(θ), Gray block:EF(T), White block:EF(Soil).
Thus, the soil moisture is not the reason for the low res-piration rate in Plot L. The observed variation in soil tem-perature was very low in both experimental forests, although large variation in soil moisture was recorded in Kahoku, par-ticularly in Plots L and T.
6 Discussion
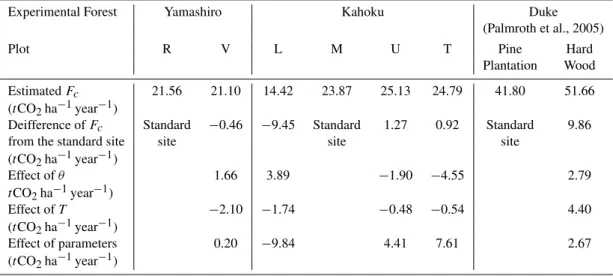
The effects of soil temperature, soil moisture and soil proper-ties on soil respiration rate, calculated using Eqs. (2) through (4), are shown in Table 3 and Fig. 7. These calculations were performed for one-year periods from 1 July 2004 to 30 June 2005 in the Yamashiro Experimental Forest and from 16 August 2005 to 15 August 2006 in the Kahoku Experi-mental Forest. Plots R and M were the control plots in the Ya-mashiro and Kahoku Experimental Forests, respectively. The results of the study by Palmroth et al. (2005) for pine planta-tion and hardwood areas in the Duke Forest, North Carolina, are also shown.
6.1 Comparison of effective factors between forests
Soil respiration rates in the Duke Forest were affected by soil temperature, soil moisture and soil properties, in decreasing order of influence (Palmroth et al., 2005). Variation in topog-raphy was small in the pine plantation and hardwood areas in the Duke Forest, which explained whyEF(Soil) for these ar-eas was smaller thanEF(T)andEF(θ ).
This order of influence in the Yamashiro was the same as that in the Duke Forest, with soil temperature having the greatest effect on soil respiration rates. However, estimates of the magnitude of the effect exerted by each parameter us-ing Eqs. (2) through (4) yielded unusually small values for Yamashiro, particularly EF(Soil). Conversely, at Kahoku, soil properties had the greatest effect on soil respiration rates, followed by soil moisture and soil temperature. One remark-able result from the Kahoku study was the very large calcu-lated value ofEF(Soil).
Table 3.Comparion of the effect on soil respiration by soil moisture (EF(θ )), soil temperature (EF(T)) and soil property (EF(Soil)).
Experimental Forest Yamashiro Kahoku Duke (Palmroth et al., 2005)
Plot R V L M U T Pine Hard
Plantation Wood EstimatedFc 21.56 21.10 14.42 23.87 25.13 24.79 41.80 51.66
(tCO2ha−1year−1)
Deifference ofFc Standard −0.46 −9.45 Standard 1.27 0.92 Standard 9.86 from the standard site site site site
(tCO2ha−1year−1)
Effect ofθ 1.66 3.89 −1.90 −4.55 2.79
tCO2ha−1year−1)
Effect ofT −2.10 −1.74 −0.48 −0.54 4.40 (tCO2ha−1year−1)
Effect of parameters 0.20 −9.84 4.41 7.61 2.67 (tCO2ha−1year−1)
properties including total C, microbial biomass and activ-ity, root biomass and activity and porosity. These properties develop within the environment, e.g. soil temperature, soil moisture and vegetation, at each location. The soil in Ya-mashiro is immature and its properties have not developed at each location. Thus, the soil characteristics exhibited mini-mal variation and created a very smini-mall value ofEF(Soil) for Yamashiro. Conversely, many factors such as topography, vegetation and soil moisture varied greatly among the plots in Kahoku. Properties of the forest soil at this location devel-oped under the conditions that in turn were influenced by the large variation of many factors. Thus, each soil type from the four plots in Kahoku had different characteristics. For example, the soil in Plot T had water repellency properties, which suggests peculiar microbial or root activity.
The smallerEF(Soil) in Yamashiro is the result of imma-ture soil that has not developed enough to make it different among the plots. On the other hand, the largerEF(Soil) in Kahoku is the result of the soil that has developed under the conditions present at each location, thus making it different among the plots.
6.2 Relation between EF(θ) and EF(Soil) in Kahoku
The annual calculated soil respiration rate was almost the same (23–26 t CO2ha−1year−1)in three of the plots at Ka-hoku, with the exception of Plot L. The positive and negative values ofEF(θ )andEF(Soil) differed from each other in ev-ery plot in Kahoku. This suggests that the effects ofEF(θ )
andEF(Soil) cancel each other out in Kahoku, and that soil respiration rates become nearly equal. This discussion can be applied forEF(θ )andEF(T)in Plots R and V in Yamashiro.
F in Plot L was much less thanFin the other three plots in Kahoku. Soil respiration was increased after heavy precipi-tation events in every plot in Kahoku, as shown in Fig. 6. The
value ofEF(θ )in Plot L is positive, 3.89 t CO2ha−1year−1, and indicates that soil moisture accelerated soil respiration in Plot L. In contrast, the value ofEF(Soil) in Plot L is negative, at−9.84 t CO2ha−1year−1, and indicates that soil property decelerates soil respiration. Thus, it is concluded that the re-stricting factor in Plot L is soil respiration, not the wet soil condition. The peculiar characteristics of the soil in Plot L included many fist-sized stones that rolled to the base of the slope and accumulated there. Consequently, the soil volume contributing to soil respiration was small. This characteristic is supposed to minimize soil respiration in Plot L.
7 Conclusions
This study concludes as follows:
1. The cause of the smallerEF(Soil) in Yamashiro was im-mature soil and the fact that the soil had not developed enough to be different among the plots. Whereas the cause of the largerEF(Soil) in Kahoku was the fact that the soil had developed under the conditions at each lo-cation and was different among the plots.
2. The positive and negative effects of soil moisture and soil properties,EF(θ )andEF(Soil), differed from each other in every plot in Kahoku and Yamashiro. Conse-quently, their effects cancelled out each other, possibly leading to nearly equal annual rates of soil respiration in Plots T, U and M in Kahoku. This can be applied for EF(θ )andEF(T) in Plots V and R in Yamashiro, respectively.
3. The restricting factor of soil respiration in Plot L is judged to be the soil property, not the wet soil condi-tion.
Acknowledgements. This study was supported by JSPS A3 Foresight Program, the Global Environment Research Account for National Institutes Long-term Monitoring of Carbon Flux and Promotion of Data Network in Asian Terrestrial Ecosystems and Research Fund (Evaluation, Adaptation and Mitigation of Global Warming in Agriculture, Forestry and FisheriesFResearch and Development) by Ministry of Agriculture, Forestry and Fisheries of Japan.
Edited by: J. Chen
References
Araki, M., Torii, A., Kaneko, S., and Yoshioka, J.: Estimation of the soil water holding capacity and soil water content in a granite small watershed, Applied Forest Science, (in Japanese), 6, 49– 52, 1997.
Dannoura, M., Kominami, Y., Tamai, K., Jomura, M., Miyama, T., Goto, Y., and Kanazawa, Y.: Development of an automatic cham-ber system for long-term measurements of CO2flux from roots,
Tellus, 58B, 502–512, 2006.
Davidson, E. A., Belk, E., and Boone, R. D.: Soil water content and temperature as independent and confounded factors control-ling soil respiration in a temperate mixed hardwood forest, Glob. Change Biol., 4, 217–227, 1998.
Davidson, E. A., Savage, K., Verchot, L. V., and Navarro, R.: Min-imizing artifacts and biases in chamber-based measurements of soil respiration, Agric. and For. Meteorol., 113, 21–37, 2002. Fang, C., Moncrieff, J. B., Gholz, H. L., and Clark, K. L.: Soil CO2
efflux and its spatial variation in a Florida slash pine plantation, Plant Soil, 205, 135–146, 1998.
Goto, Y., Kominami, Y., Miyama, T., Tamai, K., and Kanazawa ,Y.: Aboveground biomass and net primary production of a broad-leaved secondary forest in the southern part of Kyoto Prefec-ture, central Japan, Bull. of the For. and For. Prod. Res. Inst.,(in Japanese with English abstract), 2, 115–147, 2003.
Goto, Y., Tamai, K., Miyama, T., and Kominami, Y.: Stand structure and dynamics during a 5-year period in a broad-leaved secondary forest in southern Kyoto Prefecture, central Japan, Jpn. J. Ecol., (in Japanese with English summary), 54, 71–84, 2004.
Hanson P. J., Edwards, N. T., Garten, C. T., and et al.: Separating root and soil microbial contributions to soil respiration in a forest ecosystem, Biogeochemistry, 48, 115–146, 2000.
Hanson, P. J., Wullschleger, S. D., Bohlman, S. A., and Todd, D. E.: Seasonal and topographic patterns of forest floor CO2efflux
from an upland oak forest, Tree Physiol., 13, 1–15, 1993. Hashimoto, T., Miura, S., Ikeda, S., and Shichi, K.: Estimation of
spatial variation of soil CO2efflux from tree index, J. Jpn. For.
Soc., (in Japanese with English summary), 90, 386–390, 2008. Ishizuka S., Sakata, T., Sawata, S., Ikeda, S., Takenaka C., Tamai
N., Sakai H., Shimizu, T., Kan-na, K., Onodera, S, Tanaka, N., and Takahashi, M.: High potential for increase in CO2 flux from forest soil surface due to global warming in cooler areas of Japan, Ann. For. Sci., 63, 537–546, 2006.
Jia, S., Akiyama, T., Mo, W., Inatomi, M., and Koizumi, H.: Tem-poral and spatial variability of soil respiration in a cool tempera-ture broad-leaved forest. 1.Measurement of spatial variance and factor analysis, Jpn. J. Ecol., 53, 13–22, 2003. (in Japanese with English abstract)
Kobayashi, M. and Shimizu, T.: Soil water repellency in a Japanese cypress plantation restricts increases in soil water storage during rainfall events, Hydrol. Process., 21, 2356–2364, 2007. Kominami, Y., Miyama, T., Tamai, K., Nobuhiro, T., and Goto, Y.:
Characteristics of CO2flux over a forest on complex topography, Tellus, 55B, 313–321, 2003.
Kosugi, Y., Mitani, T., Itoh, M., Noguchi, S., Tani, M., Matso, N., Takanashi, S., Ohkubo, S., and Nik, A. R.: Spatial and temporal variation in soil respiration in a Southeast Asian tropical rainfor-est, Agric. For. Meteorol., 147, 16–34, 2007.
Mitani, T., Kosugi, Y., Osaka,K., Ohkubo,S., Takanashi, S., and Tani, M.: Spatial and temporal variability of soil respiration rate at a small watershed revegetated with Japanese cypress, J. Jpn. For. Soc., (in Japanese with English summary), 88, 496–507, 2006.
Nobuhiro, T., Tamai, K., Kominami, Y., Miyama, T., Goto, Y., and Kanazawa, Y.: Development of IRGA enclosed-chamber system for soil CO2efflux measurement and its application to a spatial
variation measurement, J. For. Res., 8, 297–301, 2003.
Ohashi M. and Gyokusen K.: Temporal change in spatial variabil-ity of soil respiration on a slope of Japanese ceder (Cryptomeria japonica D. Don) forest, Soil Biol. Biochemi., 39, 1130–1138, 2007.
Palmroth, S., Maier, C. A., McCarthy, H. R., Oishi, A. C., Kim, H.-S., Johnsen, K. H., Katul, G. G., and Oren, R.: Contrasting responses to drought of forest floor CO2 efflux in a Loblolly pine plantation and a nearby Oak-Hickory forest, Glob. Change Biol., 11, 1–14, 2005.
Sotta, E. D., Veldkamp, E., Guimar˜aes, B. R., Paix˜ao, R. K., Ruivo, M. L. P., and Almeida, S. S.: Landscape and climatic controls on spatial and temporal variation in soil CO2efflux in an Eastern
Amazonian rainforest, Caxiuan˜a,Brazil, For. Ecol. Manage., 237, 57–64, 2006.
Sugawara, T., Kumagai, T., Ohashi, M., Morooka, T., and Suzuki, M.: Nighttime CO2 flux over a Bornean tropical rainforest, J.
Jpn. Soc. Hydrol. Water Resour., 18, 64–77, 2005.
Tamai, K., Kominami, Y., Miyama, T., and Goto, Y.: The estimation of time series data for soil respiration based on soil temperature and soil moisture content ratio and its spatial variations in a small mountainous catchment: in the case of weathered granite region in southern Kyoto Prefecture, J. Jpn. For. Soc., (in Japanese with English summary), 87, 331–339, 2005a. .
Tamai, K., Kominami, Y., Miyama, T., and Goto, Y.: Temporal fluc-tuations in the CO2efflux on a forest floor—the case of an ex-tremely immature forest soil, J. Agric. Meteorol., 60, 773–776, 2005b.