Crop Breeding and Applied Biotechnology 12: 132-137, 2012 Brazilian Society of Plant Breeding. Printed in Brazil
Chemical composition as related to seed color of common bean
Camila Andrade Silva1*, Ângela de Fátima Barbosa Abreu2, Magno Antonio Patto Ramalho1 and Lucas Gontijo Silva Maia1
Received 22 September 2011
Accepted 4 April 2012
Abstract - This study aimed to quantify the levels of protein and minerals in common bean lines from the Germplasm Bank of Uni-versidade Federal de Lavras and to investigate the relationship between color and the mineral and protein contents of the beans. One hundred common bean lines with carioca, black and other grain color patterns were assessed for the protein levels and the mineral contents of phosphorus, potassium, calcium, magnesium, copper, manganese, zinc, and iron. Genetic variability was detected among the different groups and also between lines within each group. In general, the protein, iron and zinc contents were highest in the black bean lines. The carioca grain was outstanding for manganese and magnesium and the other grain colors for calcium. Positive correla-tions between most nutrients were observed. This indicates the possibility of obtaining lines with higher nutritional value by selection. Key words: Phaseolus vulgaris L., nutrients, correlation.
1 Universidade Federal de Lavras (UFLA), C.P. 3037, 37.200-000, Lavras, MG, Brazil. *E-mail: [email protected]
2 Embrapa Arroz e Feijão/UFLA INTRODUCTION
Common bean (Phaseolus vulgaris L.) is a nutrient-rich food that contains nutrients essential for humans, such as proteins, minerals, vitamins (especially B-complex),
carbo-hydrates, and fiber. In Brazil, common bean consumption
supplies on average 28% of the daily protein and 5-11% of the daily calorie demand (Silva 2010).
The protein quality in common bean is high and many
cultivars available for cultivation in Brazil have sufficiently
high levels of essential and nonessential amino acids to meet the daily nutritional needs (Ribeiro et al. 2007), according to standards of the Food and Agriculture Organization - FAO - (FAO 1998). The protein content of common beans is about half of the content in soybean, while the protein digestibility is higher (78.70%) (Pires et al. 2006).
For minerals, the main bioavailable sources are foods of animal origin (Costa and Liberato 2003). However, in view of the high cost, they are inaccessible to many people.
In view of the high mineral content in the relatively cheap seeds, the consumption of common beans is beneficial to
health (Mesquita et al. 2007, Ribeiro et al. 2008, Jost et al. 2009) and can be a means of prevention of a number of
mineral deficiencies. The high nutritional quality of common
beans and their importance in human nutrition has aroused
the interest of national and international breeding programs to verify the existence of variability for these nutrients in their genebanks (Mesquita et al. 2007, Ribeiro et al. 2008, Bassinello et al. 2010). As lines with higher nutritional
quality are identified, improvement programs that combine
a high nutritional quality with agronomic traits of interest can be initiated.
The type of common beans consumed in different
re-gions differs, especially with regard to grain color. In the
Zona da Mata of Minas Gerais, e.g, black or red beans are
preferred. In other regions the carioca bean is predominant.
This preference is often explained by some factor associated with the chemical composition. However, no studies have been published comparing the chemical composition of representative samples of the different bean color patterns.
In the over 40 years since the beginning of the common
bean breeding program of the Federal University of Lavras (UFLA) in 1970, many common bean lines have been col-lected, selected and stored in the germplasm bank. As there is no information about the chemical composition of the grains of these lines, this study was conducted with the objective of quantifying the protein and mineral levels from a representative sample of these lines and to investigate the relations between seed color and protein and mineral contents.
MATERIAL AND METHODS
One hundred lines of the Federal University of Lavras (UFLA) Common Bean Germplasm Bank (51 with carioca, 13 with black and 36 with other grain colors) were sown in
an experimental field of UFLA, in the southern region of
the state of Minas Gerais (lat 21° 14’ S, long 45° 59’ W, 919 m asl). The seeds were sown in plots with two 2-m rows, spaced 0.50 m apart, in the dry season (sowing in February 2009). Fertilization consisted of 400 kg ha-1 NPK fertilizer
(8- N; 28- P2O5; 16 -K20) at sowing and 150 kg ha-1 of
am-monium sulfate were top dressed, 25 days after sowing. In
this way, 62 kg ha-1 N was applied to the areas. Sprinkler
irrigation was applied when necessary.
After harvest, three 50-g seed samples per plot were analyzed in a completely randomized design for the protein and mineral contents (P, K, Ca, Mg, Cu, Mn, Zn, and Fe). For this purpose, the seeds were air-dried to a moisture content of approximately 13%. Each sample was ground in a micro-mill (particle size < 1 mm), stored in completely sealed plastic bags, labeled, and refrigerated until laboratory tests. The chemical analyses were performed in the leaf analysis laboratory of the UFLA Chemistry Department.
The protein content was quantified based on the total
N content, by the Kjeldahl method, which consists in heating the N substance in concentrated sulfuric acid in the presence of a catalyst, so that N and H present are converted into ammonium salt. Nitrogen in the form of ammonia is removed in the distillation stage. The distillate is then titrated and the N content of the sample determined, which is converted to crude protein by the factor 6.25 (AOAC 2005).
For the mineral analysis, nitroperchloric digestion was carried out with 0.5 g of each sample. At the end of the digestion, the extract volume was completed with deionized water to 15 mL. This digestion removes the elements from the organic compounds of the sample or adsorbed to them. Ca, Mg, Cu, Mg, Fe, and Zn contents were determined by atomic absorption spectroscopy,
us-ing a SpectrAA 110 model (Varian Inc.), calibrated for each element under specific conditions of wavelength,
slit width and gas mixture. P and S were analyzed by UV spectrophotometry in a Perkin Elmer Lambda 25 UV/Vis
and K by flame emission photometry in a Micronal B262
unit. For all analyses, the procedures described by Mala-volta et al. (1997) were used. After the analysis, the data were corrected to a dry basis by the method of moisture content, measured by the water loss from the sample at a drying temperature of 100-105 °C (AOAC 2005).
The data of the chemical analyses of the 100 lines were subjected to analysis of variance, according to the follow-ing statistical model, considerfollow-ing all effects random, except the mean: Yij = µ +1i + eij, where: Yij: value observed in the line, within the replication j (j=1, 2, 3);µ: general mean of the experiment; li: effect of line i, where i = 1, 2,..., 100; eij: experimental error associated with observation Yij, assuming that errors are independent and normally distributed with mean
0 and variance σ2
e. For the statistical analyses the softwares
Genes (Cruz 2006) and SAS Institute (2008) were used.
The selection accuracy was estimated by the methodol-ogy proposed by Resende and Duarte (2007). Means were compared by the Scott–Knott (1974) grouping test. The heritability was also estimated (Bernardo 2002), considering that the selection would be based on the means of the lines
and confidence intervals, according to Knapp et al. (1985). The correlation coefficients between nutrients were estimated
by the methodologies of Vencovsky and Barriga (1992).
To obtain a selection index involving the data of all nutrients, the sum of the standardized variables (Z) was estimated (Mendes et al. 2009). As variable Z assumes negative and positive values, the value three was added to
make all values positive. In this case, the mean of the lines
would come to be three instead of zero. Analysis of variance
of ∑Z was performed and the coefficient of variation of Z
(CVZ) per line estimated.
RESULTS AND DISCUSSION
Initially it was found that all accuracy estimates were high
(> 90%) (Table 1), indicating good experimental precision (Resende and Duarte 2007). The source of variation of lines
and of the lines of each color group differed significantly from each other (P ≤ 0.01) (Table 1). This result indicates
the existence of genetic variability between the different groups and also between the lines of each group.
The existence of a difference between the lines for all nutrients may also be detected by the estimates of the mean amplitude of variation of line means. The difference was
especially significant for Mn, Zn and Fe. Several studies in the literature quantified the nutritional contents of common
The heritability estimates, all non-zero and above 94%, allow the conclusion that the chance of success with selection for lines with outstanding nutritional quality is high (Table 1). The high heritability estimate obtained in this study must be attributed to the fact that the evaluated lines are from a gene-bank involving lines with differentiated expression of several traits. Many of these phenotypes are not necessarily related to the acceptance or not of a line by farmers. However, the heritability value indicates that there is a possibility of success in identifying lines with improved nutritional value.
As the sample contained beans of different skin colors, as-sociations were sought between color and nutrient content. The lines were grouped into carioca, black and other color patterns.
As already mentioned, significant differences (P ≤ 0.01) between groups were found (Table 1). In general, black bean lines stood
out for protein, Fe and Zn. For Ca, the average levels were higher in the lines of the colored group. Carioca beans, which are the most consumed in Brazil, stood out with highest average
Mg and Mn contents. Although the protein content of the black
group lines was on average higher (26.08%), line CIAT-A-257
of the red bean (color) group had the highest protein
percent-age (30.4%) (Table 2). It is noteworthy that, as this line is not
adapted to the regional growing conditions, it could be used in the hybridization program, in particular with the carioca grain lines, with a view to increase its protein content.
Unfortunately, there is little information in the literature relating nutrient contents with the skin color. Moraghan et al. (2002) observed that the amount of iron found in beans can vary according to the color; they attributed this difference to the tannin content, which is higher in black grain cultivars, since tannins can complex iron. Lombardi-Boccia et al. (1998) reported a higher
Ca content in colored beans, especially in white beans. In this
study, where a representative sample of the different colors was used, it can be inferred that a considerable proportion of nutrients must be located in the skin, as reported elsewhere (Leleji et al. 1972, Moraghan and Etchevers 2006, Jost et al. 2009).
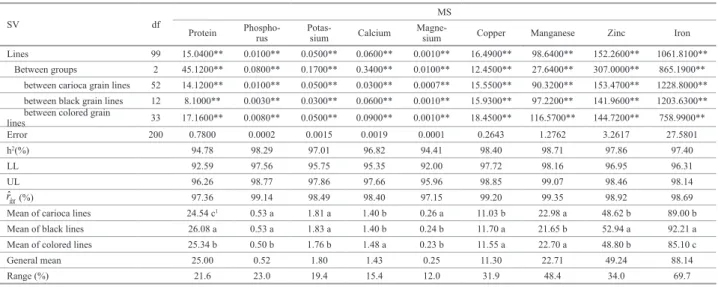
Table1. Summary of the analysis of variance, heritability estimates with their lower (LL) and upper limits (UL), accuracy ( ) and general mean for protein and mineral (P, K, Ca, Mg, Cu, Mn, Zn, and Fe) contents of the 100 tested common bean lines of the Common Bean Germplasm Bank
SV df
MS
Protein Phospho-rus Potas-sium Calcium Magne-sium Copper Manganese Zinc Iron
Lines 99 15.0400** 0.0100** 0.0500** 0.0600** 0.0010** 16.4900** 98.6400** 152.2600** 1061.8100** Between groups 2 45.1200** 0.0800** 0.1700** 0.3400** 0.0100** 12.4500** 27.6400** 307.0000** 865.1900**
between carioca grain lines 52 14.1200** 0.0100** 0.0500** 0.0300** 0.0007** 15.5500** 90.3200** 153.4700** 1228.8000**
between black grain lines 12 8.1000** 0.0030** 0.0300** 0.0600** 0.0010** 15.9300** 97.2200** 141.9600** 1203.6300** between colored grain
lines 33 17.1600** 0.0080** 0.0500** 0.0900** 0.0010** 18.4500** 116.5700** 144.7200** 758.9900**
Error 200 0.7800 0.0002 0.0015 0.0019 0.0001 0.2643 1.2762 3.2617 27.5801
h2(%) 94.78 98.29 97.01 96.82 94.41 98.40 98.71 97.86 97.40
LL 92.59 97.56 95.75 95.35 92.00 97.72 98.16 96.95 96.31
UL 96.26 98.77 97.86 97.66 95.96 98.85 99.07 98.46 98.14
(%) 97.36 99.14 98.49 98.40 97.15 99.20 99.35 98.92 98.69
Mean of carioca lines 24.54 c1 0.53 a 1.81 a 1.40 b 0.26 a 11.03 b 22.98 a 48.62 b 89.00 b
Mean of black lines 26.08 a 0.53 a 1.83 a 1.40 b 0.24 b 11.70 a 21.65 b 52.94 a 92.21 a
Mean of colored lines 25.34 b 0.50 b 1.76 b 1.48 a 0.23 b 11.55 a 22.70 a 48.80 b 85.10 c
General mean 25.00 0.52 1.80 1.43 0.25 11.30 22.71 49.24 88.14
Range (%) 21.6 23.0 19.4 15.4 12.0 31.9 48.4 34.0 69.7
** Significant by the F test at 1% probability.
1 Means followed by the same letter in a column belong to the same group. by Scott Knott (1974) analysis. at 5% probability.
ˆ
ˆgg r
ˆ
ˆgg r
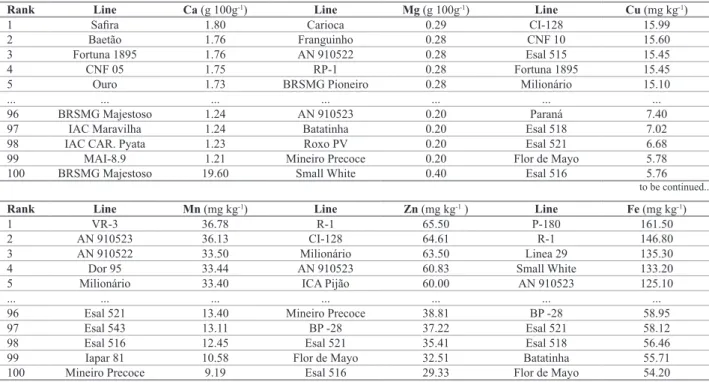
Table 2. Classification of 10 common bean lines with the highest and 10 lines with the lowest levels for each nutrient (protein, P, K, Ca, Mg, Cu, Mn,
Zn, and Fe)
Rank Line Protein (%) Line P (g 100g-1) Line K (g 100g-1)
1 Ciat-A-257 30.40 CI-128 0.69 BRS Campeiro 2.06
2 Bolinha 30.19 CI-164 0.69 CI-128 2.05
3 Iapar 81 29.25 R-29 0.64 CNF 05 2.04
4 Linea 29 29.10 Pérola 0.63 G 2333 2.02
5 Roxo PV 28.95 BRSMG Pioneiro 0.62 ICA Pijão 2.00
... ... ... ... ... ... ...
96 Small White 20.60 Batatinha 0.40 Bolinha 1.60
97 RC-1.8 20.44 Ouro 0.40 Mineiro Precoce 1.52
98 P-1. 103 20.34 Esal 627 0.40 Esal 543 1.48
99 FP-5.9 20.30 Esal 512 0.40 Flor de Mayo 1.46
100 BRSMG Majestoso 19.60 Small White 0.40 Esal 521 1.45
The correlation estimates (Table 3) show a positive as-sociation among most nutrients. The same was observed by Beebe et al. (2000). This situation is favorable for improving nutritional quality, indicating the possibility of obtaining lines with higher nutritional value, since selection may be effective for two or more minerals.
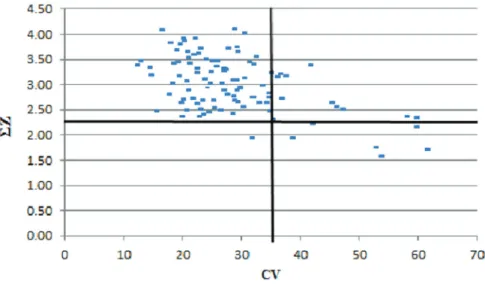
To identify lines with superior chemical composition,
the selection index based on the sum Z (∑Z) was used. The
line with the highest ∑Z estimate associated with a small coefficient of variation (CV) is ideal, indicating the line with
highest levels of most nutrients and a small variation in the
chemical composition as a whole. The ∑Z and CV estimates were plotted on a graph (Figure 1). It was observed that most of the lines associated high ∑Z with a low CV estimate,
indicating that the chemical composition of the lines being improved and/or planted in the state is good. Nevertheless,
Rank Line Ca (g 100g-1) Line Mg (g 100g-1) Line Cu (mg kg-1)
1 Safira 1.80 Carioca 0.29 CI-128 15.99
2 Baetão 1.76 Franguinho 0.28 CNF 10 15.60
3 Fortuna 1895 1.76 AN 910522 0.28 Esal 515 15.45
4 CNF 05 1.75 RP-1 0.28 Fortuna 1895 15.45
5 Ouro 1.73 BRSMG Pioneiro 0.28 Milionário 15.10
... ... ... ... ... ... ...
96 BRSMG Majestoso 1.24 AN 910523 0.20 Paraná 7.40
97 IAC Maravilha 1.24 Batatinha 0.20 Esal 518 7.02
98 IAC CAR. Pyata 1.23 Roxo PV 0.20 Esal 521 6.68
99 MAI-8.9 1.21 Mineiro Precoce 0.20 Flor de Mayo 5.78
100 BRSMG Majestoso 19.60 Small White 0.40 Esal 516 5.76
to be continued...
Rank Line Mn (mg kg-1) Line Zn (mg kg-1 ) Line Fe (mg kg-1)
1 VR-3 36.78 R-1 65.50 P-180 161.50
2 AN 910523 36.13 CI-128 64.61 R-1 146.80
3 AN 910522 33.50 Milionário 63.50 Linea 29 135.30
4 Dor 95 33.44 AN 910523 60.83 Small White 133.20
5 Milionário 33.40 ICA Pijão 60.00 AN 910523 125.10
... ... ... ... ... ... ...
96 Esal 521 13.40 Mineiro Precoce 38.81 BP -28 58.95
97 Esal 543 13.11 BP -28 37.22 Esal 521 58.12
98 Esal 516 12.45 Esal 521 35.41 Esal 518 56.46
99 Iapar 81 10.58 Flor de Mayo 32.51 Batatinha 55.71
100 Mineiro Precoce 9.19 Esal 516 29.33 Flor de Mayo 54.20
Table 3. Phenotypic genetic and environmental correlation coefficients between nutrients levels assessed in 100 common bean lines from the Common
Bean Germplasm Bank
Protein Phosphorus Potassium Calcium Magnesium Copper Manganese Zinc Iron
Protein 1 0.35 ± 0.09
1 (0.34) **
-0.12 ± 0.10 (-0.11)
0.10 ± 0.10 (0.10)
0.09 ± 0.11 (0.09)
0.29 ± 0.10 (0.28) **
-0.15 ± 0.10 (-0.14)
0.24 ± 0.10 (0.24) *
-0.17 ± 0.10 (-0.16)
Phosphorus 0.14 1 0.37 ± 0.09
(0.37) **
-0.14 ± 0.10 (-0.14)
0.32 ± 0.10 0.32) **
0.27 ± 0.02 (0.27) **
0.13 ± 0.10 (0.13)
0.53 ±0.07 (0.53) **
0.05 ± 0.10 (0.05)
Potassium 0.02 0.49 1 0.10 ± 0.10
(0.10)
0.17 ± 0.10 (0.18)
0.44 ± 0.08 (0.44) **
0.26 ± 0.10 (0.26) **
0.49 ±0.08 (0.49) **
0.31 ± 0.03 (0.31) **
Calcium 0.10 0.11 0.20 1 -0.22 ± 0.10
(-0.20)
0.60 ± 0.07 (0.58) **
0.24 ± 0.10 (0.24) *
0.08 ± 0.10 (0.08)
0.13 ± 0.10 (0.08)
Magnesium 0.14 0.39 0.39 0.27 1 0.08 ± 0.71
(0.08)
0.35 ± 0.09 (0.35) **
0.19 ± 0.08 (0.20) *
0.03 ± 0.10 (0.03)
Copper 0.01 0.30 0.47 0.12 0.25 1 0.52 ± 0.07
(0.52) **
0.63 ± 0.06 (0.62) **
0.41 ± 0.09 (0.41) **
Manganese 0.11 0.29 0.44 0.17 0.28 0.48 1 0.53 ± 0.07
(0.52) **
0.37 ± 0.09 (0.37) **
Zinc 0.14 0.53 0.48 0.28 0.50 0.46 0.44 1 0.55 ± 0.07
(0.54) **
Iron 0.26 0.03 0.09 0.14 0.08 0.14 0.11 0.08 1
Composição química e sua associação com a cor das sementes de feijão comum
Resumo –Visando a quantificar os teores de proteína e minerais de linhagens de feijão pertencentes ao Banco de Germoplasma da
Universidade Federal de Lavras e verificar se existe relação entre a cor do grão e o teor de nutrientes foi realizado o presente tra
-balho. Foram avaliadas 100 linhagens de feijão dos tipos carioca, preto e cores, quanto aos teores de proteína e dos minerais fósforo,
potássio, cálcio, magnésio, cobre, manganês, zinco e ferro. Observou-se variabilidade genética entre os diferentes grupos avaliados e,
também, entre as linhagens dentro de cada grupo. Em média, as linhagens de grãos pretos se destacaram para os teores de proteína, ferro e zinco. Já os grãos tipo carioca, para manganês e magnésio e os do tipo cores, para cálcio. Detectou-se correlação positiva
entre a maioria dos nutrientes, condição essa favorável para a seleção.
Palavras-chave:Phaseolus vulgaris L., nutrientes, correlação.
the possibility of a successful selection for each particular nutrient or for the chemical composition as a whole is
evident. In this context, the lines CI 128, Safira and RP-1 had the highest ∑Z estimates and lowest CV (Figure 2). The lines CI-128 and RP-1 belong to the Carioca group and Safira, to the
colored group (red coat). On the other hand, the worst lines were ESAL 543 (red skin), BP-28 (Carioca) and ESAL 521 (Carioca).
It is worth noting that although
some currently recommended lines had undergone selection for mineral and protein contents, the levels of all nutrients were high, e.g., in the case of the recently recommended BRS Cometa and BRSMG Pioneiro (Moreira et al. 2006, Faria et al. 2007) and RP-1 which is about to
be officially recommended (Table
2). These were always ranked among the best 15 lines.
ACKNOWLEDGEMENTS
The authors thank the CAPES (Brazilian Federal Agency for Support and Evaluation of Graduate
Educa-tion), the FAPEMIG (Research Foun -dation of the state of Minas Gerais) and the CNPq (National Council for
Scientific and Technological Develop
-ment) for research grants and financial
support.
Figure 1. Graphic dispersion of the100 lines evaluated for the sum of standardized variables Z (∑Z)
and the coefficient of variation of each line (CV).
Figure 2. Graphical representation of the standardized values for protein and minerals (P, K, Ca,
REFERENCES
Araújo R, Miglioranza E, Montalvan R, Destro D, Gonçalves-Vidigal MC and Moda-Cirino V (2003) Genotype x environment interaction effects on the iron content of common bean grains. Crop Breeding
and Applied Biotechnology 4: 269-274.
Association of Official Analytical Chemists - International [AOAC] (2005)
Official methods of analysis. 18th ed., AOAC, Gaithersburg.
Barampama Z and Simard RE (1993) Nutrient composition, protein quality and antinutritional factors of some varieties of dry beans (Phaseolus vulgaris L.) grown in Burundi. Food Chemistry 47: 159-167.
Bassinello PZ, Oliveira BR, Lorrana NNN and Wellington MRS (2010) Effect of the environment on zinc and iron levels in common beans.
Annual Report of common bean Improvement Cooperative 10:
146-147.
Beebe S, Gonzalez AV and Rengifo J (2000) Research on trace minerals in the common bean. Food and Nutrition Bulletin 21: 387-391.
Bernardo R (2002) Breeding for quantitative traits in plants. Stemma Press, Minnesota, 369p.
Costa NMB and Liberato SC (2003) Biotecnologia na nutrição e saúde. In Costa NMB and Borém A (eds.) Biotecnologia e nutrição: saiba como
o DNA pode enriquecer os alimentos. Nobel, São Paulo, p. 71-127.
Cruz CD (2006) Programa Genes: estatística experimental e matrizes. UFV, Viçosa, 285p.
FAO - Junta de Conselho de Especialistas FAO/WHO/ONU (1998)
Necessidades de energia e proteína. FAO, São Paulo, 225p.
Faria LC, Peloso MJ, Melo LC, Costa JGC, Rava CA, Diaz JLC, Faria JC, Silva HT, Sartorato A, Bassinello PZ and Trovo JB (2007) BRS Cometa: a carioca grain type common bean cultivar with erect growth habit. Annual Report of common bean Improvement Cooperative 50: 209-210.
Holland JB (2006) Theoretical and biological foundations of plant breeding. In Lamkey KR and Lee M (eds). Plant Breeding:The Arnel R. Hallauer International Symposium. Blackwell Publishing, Ames, p.127-140.
Jost E, Ribeiro ND, Maziero SM, Cerutti TR and Rosa DP (2009) Efeitos gênicos do teor de cálcio em grãos de feijão. Ciência Rural 39: 31-37.
Knapp SJ, Stroup WW and Ross WM (1985) Exact confidence intervals for heritability on a progeny mean basis. Crop Science 25: 192-194.
Leleji OI (1972) Inheritance of crude protein percentage and its correlation with seed yield in beans, Phaseolus vulgaris L. Crop Science 12: 168-171.
Lombardi-Boccia G, Lucarini M, Di Lullo G, Del Puppo E, Ferrari A and Carnovale E (1998) Dialysable, soluble and fermentable calcium from beans (Phaseolus vulgaris L.) as model for in vitro assessment of the potential calcium availability. Food Chemistry 61: 167-172.
Malavolta E, Vitti GC and Oliveira AS (1997) Avaliação do estado nutricional das plantas: princípios e aplicações. Potafos, Piracicaba, 319p.
Maldonado S and Sammám N (2000) Composición química y contenido de minerales de leguminosas y cereales producidos en el noroeste argentino. Archivos Latino Americanos de Nutrición 50: 195-199.
Mendes FF, Ramalho MAP and Abreu AFB (2009) Índice de seleção para escolha de populações segregantes de feijoeiro comum. Pesquisa
Agropecuária Brasileira 44: 1312-1318.
Mesquita FR, Corrêa AD, Abreu CMPA, Lima RAZL and Abreu AFB (2007) Linhagens de feijão (Phaseolus vulgaris L.): composição química e digestibilidade proteica. Ciência e Agrotecnologia 31: 1114-1121.
Moraghan JT and Etchevers JD (2006) Contrasting accumulations of calcium and magnesium in seed coats and embryos of common bean and soybean. Food Chemistry 95: 554-561.
Moraghan JT, Padilla J, Etchevers JD, Grafton K and Acosta-Gallegos JA (2002) Iron accumulation in seed of common bean. Plant and Soil 246: 175-183.
Moreira MA, Barros EG, Carneiro JES, Faleiro FG, Faria LC, Carneiro GES, Peloso MJ, Paula Júnior TJ, Abreu AFB, Ramalho MAP, Melo LC, Santos JB, Rava CA and Costa JGC (2006) BRSMG Pioneiro: new carioca common bean cultivar resistant to anthracnose and rust, for the South of Brazil. Annual Report of common bean Improvement
Cooperative 49: 279-280.
Osborn TC (1988) Genetic control of bean seed protein. Critical Reviews in Plant Science 7: 93-116.
Pires CV, Oliveira MGA, Rosa JC and Costa NMB (2006) Qualidade nutricional e escore químico de aminoácidos de diferentes fontes proteicas. Ciência e Tecnologia dos Alimentos 26: 179-187.
Resende MDV and Duarte JB (2007) Precisão e controle de qualidade em experimentos de avaliação de cultivares. Pesquisa Agropecuária Tropical 37: 182-194.
Ribeiro ND, Jost E, Cerutti T, Maziero SM and Poersch NL (2008) Composição de microminerais em cultivares de feijão e aplicações para o melhoramento genético. Bragantia 67: 267-273.
Ribeiro ND, Londero PMG, Cargnelutti Filho A, Jost E, Poersch NL and Mallmann CA (2007) Composição de aminoácidos de cultivares de feijão e aplicações para o melhoramento genético. Pesquisa
Agropecuária Brasileira 42: 1393-1399.
SAS Institute (2008) SAS/STAT 9.2 User’s guide. SAS Institute, Cary,
584p.
Scott AJ and Knott MA (1974) Cluster analysis method for grouping means in the analysis of variance. Biometrics 30: 507-512.
Silva OF (2010) Consumo per capita de feijão no Brasil, 2010. Available at <http://www.cnpaf.embrapa.br/apps/socioeconomia/docs/arroz/ consumopercapita.htm> Assessed on Jan. 10, 2011.
Vencovsky R and Barriga P (1992) Genética biométrica no
fitomelhoramento. Revista Brasileira de Genética, Ribeirão Preto,