Engineering
ISSN: 1809-4430 (on-line)
_________________________
2 Universidade Federal de Alagoas/ Maceió - AL, Brasil.
3 Universidade Federal de Campina Grande/ Campina Grande - PB, Brasil. Received in: 11-8-2016
IDENTIFICATION OF DESERTIFICATION- SENSITIVE AREAS IN THE BRAZILIAN NORTHEAST THROUGH VEGETATION INDICES
Doi:http://dx.doi.org/10.1590/1809-4430-Eng.Agric.v37n6p1190-1202/2017
THOMÁS R. FERREIRA1*, FREDERICO T. DI PACE2, BERNARDO B. DA SILVA3,
JÉSSICA R. DELGADO3
1*Corresponding author. Universidade Federal de Campina Grande/ Campina Grande - PB, Brasil. E-mail: [email protected]
ABSTRACT: The aim of this study was to identify areas susceptible to drought and under desertification in the Brazilian Northeast, more specifically in the states of Alagoas, Pernambuco, and Sergipe. The study was based on the 2000-2014 time period, relative frequency, Vegetation Condition Index (VCI) dataset derived from MOD13Q1 products (vegetation indices derived from the Moderate Resolution Imaging Spectroradiometer sensor). The areas located within the desertification nucleus of Cabrobó, in the southwestern of Pernambuco and surrounding the Águas Belas municipality were considered susceptible to drought and desertification. Some municipalities
in the countryside of Alagoas showed a very low relative frequency of VCI data (45-50%), and
occurrence of areas between 55-60%.Tthe Sergipe state presented a relative frequency VCI data around 50% only in the Poço Verde municipality. Among the areas with low rates of VCI and the most frequently identified in this research, therefore, with greater frequency of droughts, the Southwestern and the Southern Pernambuco hinterlands were not considered as pilot areas by MMA (Brazilian Environment Ministry) in its desertification studies and were included as susceptible for desertification in this study. The results suggest the use of this methodology to subsidize formulations of public policies with application in land use and land cover studies or sustainable development and environmental risk analysis.
KEYWORDS:degradation, vegetation, remote sensing.
INTRODUCTION
Droughts in semi-arid and sub-humid areas are recognized to limit human activities in the ecosystems, restricting, for example, the family agriculture and rainfed agriculture, consequently affecting economy and basic necessities of life. Therefore, their persistence and intensity, as well as indifference regarding public policies, can lead to desertification.
According to Molion & Bernardo (2002), Reboita et al. (2012) and Reboita & Santos (2014), the semiarid Brazilian Northeast (NEB) (states of Alagoas, Pernambuco and Sergipe) presents low levels of rainfall, mostly concentrated within the first half of the year, which is a result of combined influence of several factors such as the Intertropical Convergence Zone (ITCZ) positioning, the descending branch of the Walker cell, the anomalies of sea surface temperature in the tropical Atlantic Ocean, the El Niño phenomenon and the Borborema plateau. This last feature acts as a topographic barrier against the atmospheric flow (Reboita et al., 2012; Reboita & Santos, 2014). Besides being located in an area of high vulnerability to drought, in certain regions of the NEB, such sensitivity might be increased by the desertification process, given the differences in geographical location, soil type, water body distribution, wind circulation pattern and even, in some cases, public policies.
Condition Index), PCI (Precipitation Condition Index) and the SMCI (Soil Moisture Condition Index) indices with the purpose of monitoring and quantifying weather and edaphic droughts (soils lacking moisture) in southern China. They concluded that drought monitoring could be performed on a seasonal scale in the study area without losing accuracy. More recently, Kogan et al. (2015) tested the Vegetation Health Index (VH), which incorporates TCI and VCI into the formulation of a drought alert model, to minimize farming losses in Saratov Oblast, Russia. These authors concluded that cereal production losses by droughts could be predicted three months prior to harvest.
In order to monitor droughts in agricultural areas in Rajasthan, India, Dutta et al. (2015) used Advanced Very High Resolution Radiometer images (AVHRR) from National Oceanic and Atmospheric Administration (NOAA) satellites. Gebrehiwot et al. (2011) applied SPOT Vegetation images to evaluate weather and edaphic droughts in Tigray, northern Ethiopia, finding a good correlation between VCI and SPI (Standardized Precipitation Index).
The objective of this study was to identify areas susceptible to drought in the process of desertification in the Brazilian Northeast, more specifically, in the states of Alagoas, Pernambuco, and Sergipe using VCI frequency analysis technique.
MATERIAL AND METHODS
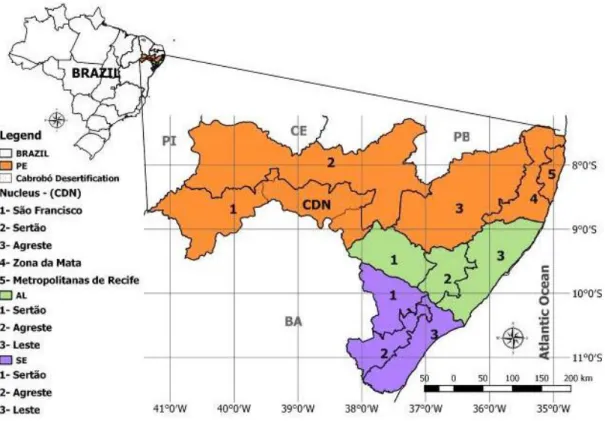
The study area covers the states of Alagoas (AL), Pernambuco (PE), and Sergipe (SE), as well as all the coastline of the NEB (Figure 1). According to the National Program of Action to Combat
Desertification and Mitigate the Effects of Drought (Programa de Ação Nacional de Combate à
Desertificação e Mitigação dos Efeitos da Seca – PAN-Brasil) (PAN BRASIL, 2005), the three
aforementioned states have a great part of their territory covered by areas susceptible to desertification, with aridity index between 0.05 to 0.65. Pernambuco already presents zones under clear desertification process, especially the Cabrobó Desertification Nucleus (CDN).
Index, Equation 1), considering that plant green foliage absorbs radiation in the visible part of wavelengths. Plants use energy for photosynthesis and reflect strongly in the near-infrared region because of healthy leaf swelling, which is due to leaf cellular structure. Then, differences of reflectance were proposed for these bands, being normalized by the sum of the values:
R R R R ρ ρ ρ ρ NDVI I I
(1)
where,
NDVI is the Normalized Difference Vegetation Index;
IR is the reflectance in the near-infrared band, and
R is the reflectance in the red band.
The NDVI is expressed on a scale from -1 to +1. Negative values correspond to water bodies or wetlands in which reflectances in the near infrared region are lower than those in the visible region. For other targets, NDVI varies from 0 to 1. The highest values are linked to denser green vegetation canopy because of the large difference in the reflectances in both spectral regions. In contrast, values close to zero indicate either the lack of vegetation or senescent vegetation which leads to smaller difference reflectance values in both red and near infrared spectra (Di Pace et al., 2008). NDVI can be used as an estimator of seasonal and inter-annual variations of plants.
The maximum and minimum values of NDVI calculated for a certain period and geographical location, under an extreme climate change scenario, could be used as a criterion for measuring the amount of ecosystem resources, i.e. local ecosystem potential or reloading capacity (Kogan et al., 2012).
With the emergence of indices such as VCI (Eq. 2) and TCI, drought intensity and impacts of climate changes on vegetation could be estimated. The VCI has been recognized as an index that also quantifies the weather component, being closely related to moisture level (Kogan & Guo, 2014). This index stands for the ratio between the NDVI and its maximum amplitude in each pixel. Values near zero point out vegetation under extreme stress condition; conversely, values close to 100 express great conditions for vegetation. This index was calculated from the difference between the maximum and the minimum NDVI (Kogan et al., 2013):
100 NDVImin NDVImax NDVImin NDVIj VCI x
(2)
where,
VCI is the Vegetation Condition Index at a moment j; NDVIj is the NDVI at a moment j;
NDVImax are the historical values of maximum NDVI, and NDVImin are the historical values of minimum NDVI.
The MOD13Q1 product comprises two vegetation indices, NDVI and EVI (Enhanced Vegetation Index) with a spatial resolution of 250 m, consisting of a mosaic of images composed of 16 daily reflectance data. These observations coincide with the beginning of the monthly calendar, being plotted in a sinusoidal projection.
EMBRAPA (Brazilian Agricultural Research Organization) makes available the entire database of NDVI and EVI of the MOD13Q1 product of platforms TERRA and AQUA (http://www.modis.cnptia.embrapa.br/geonetwork/srv/pt/main.home). It is updated every 16 days for UTM (Universal Transverse of Mercator) projection, WGS-84 datum and, GeoTIFF format. Images representing the states of Alagoas, Pernambuco, and Sergipe were gathered for the period between 2000 (beginning of the MODIS data series) and 2014.
This data set was used to calculate the minimum and maximum NDVIs for each pixel. Then, using [eq. (2)], the VCI was computed for each NDVI image. Lastly, the frequency was calculated for cases whose pixels displayed a very low score (0-20%), which made it possible to show intensely degraded areas. Relative frequency was calculated by means of the following expression:
100 * n VCI F 0-20
rel
(3)where,
Frel is relative frequency (in percentage) of pixels with value between 0 to 20%, and
VCI0-20 is the number of pixels with VCI value between 0 and 20%, within the series of
images and n is the total number of images used.
According to [eq. (3)] those pixels which, for example, presented 50% relative frequency means that among the 15 years analyzed, 50% of that period have accused VCI in an extremely dry condition, very close to or exactly at the minimum ecosystem potential. The areas susceptible to
drought and in the course of desertification were those that presented Frel greater than 30%.
In order to investigate the seasonal variability of the NDVI (which is directly linked to the VCI and consequently the relative frequency of the VCI itself), rainfall data were collected from the BDMEP (Meteorological Database for Teaching and Research) of INMET (2017) (National
Institute of Meteorology) for the automatic station of Petrolina- PE (latitude 9º 22’48”S, longitude
40º 28’48”W and altitude 370.46m). It was intended to relate this variability to rainfall, in order to elucidate the sensitivity of the NDVI to the phenomenon from a meteorological and climatological point of view. That weather station is located in the Caatinga biome, within the Brazilian semi-arid region and in a region designated by Santana (2007) as intensely affected by the desertification process.
The areas most susceptible to desertification are coincident with high agricultural potential
and high land use, according to the IBGE Mapas database.
(http://mapas.ibge.gov.br/interativos/servicos/wms-do-arcgis.html). The agricultural potential of soils takes into account factors such as soil fertility, soil physical and morphological characteristics and topography. The survey of land use and land cover indicates the geographic distribution of the different types of land use, identified through homogeneous land cover patterns (IBGE, 2013). The correlation of these two fields, together with the relative frequency maps of the VCI, better characterizes the areas vulnerable to the desertification process.
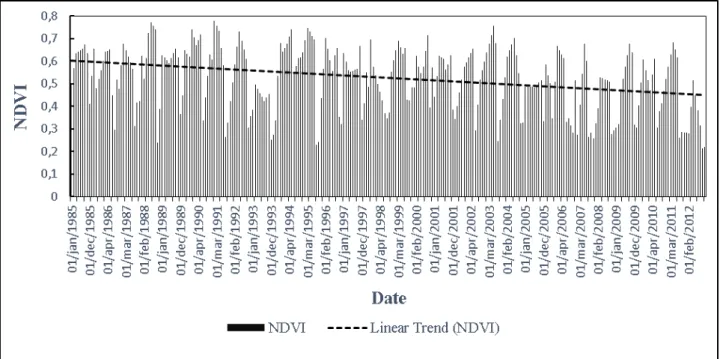
We also acquired images of the VIP (Vegetation Index and Phenology) product (Didan, 2016) corresponding to the historical series of 1985-2012, for analysis of NDVI from the rainy season. In this study, the rainy season comprised the months whose total rainfall was equal or higher than 80% of the normal climatological, annual precipitation registered by the closest weather station.
Therefore, we selected pixels with higher Frel to verify the tendency of NDVI, based on the
The Mann-Kendall test is based on H0 null hypothesis that a data series is a sample of n random and independent variables identically distributed. More details about the statistical test are described in Sousa et al. (2011).
All the procedures carried out using the images were performed through the Erdas Imagine 9.2 and Qgis 2.10.1 software.
RESULTS AND DISCUSSION
Figure 2 shows the frequencies of pixels with values between 0 and 20% (a ‘very low’ VCI).
These cases consist of areas showing the lowest ecosystem potential and/ or lower soil water availability.
Kogan et al. (2013) considered VCI values around 50% as indicators of normal conditions for vegetation cover. Here, we used values below 20% for identifying areas where conditions are quite critical and their frequencies are observed for a long-term period (15 years).
For the coastline of the three studied states, the results of the very low VCI frequency are expressed in Figure 2 as shades of blue, mostly below 15%. The results are in accordance with the expected for the regional climatic conditions since eastern climate systems supply satisfactorily the coastal region of the NEB. Fewer droughts are expected in this region, since, on average, rainfall levels do not cause significant threatening to vegetation cover development in this coastal zone.
In CDN, the frequency of very low VCI values was between 40-60% (shades of yellow), displaying a predominance of pixels with values between 40-45% (shades of green) and a few with values of 60%.
FIGURE 2. Relative Frequency on pixels between 0 and 20% of VCI images (%).
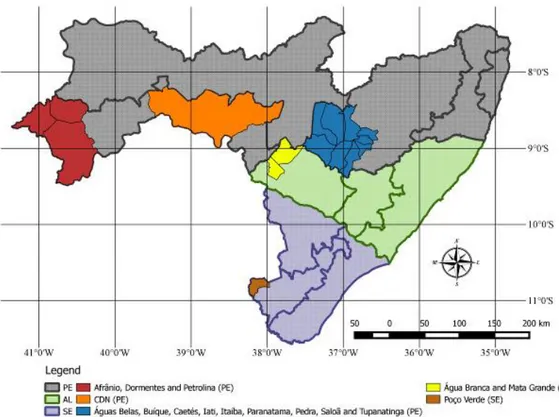
Similar scenario of CDN is highlighted in Figure 3 for the municipalities of Afrânio, Dormentes, and Petrolina in the Southwestern São Francisco mesoregion, state of Pernambuco. This area was pointed out by Santana (2007) as severely affected by desertification. Another region
and the east coast) of Pernambuco, more precisely in the southwest of this mesoregion. This nucleus is located between the Vale do Ipanema and Garanhuns microregions, formed by the North of Águas Belas (the largest area) and municipalities of Buíque, Caetés, Iati, Itaíba, Paranatama, Pedra, Saloã, and Tupanatinga.
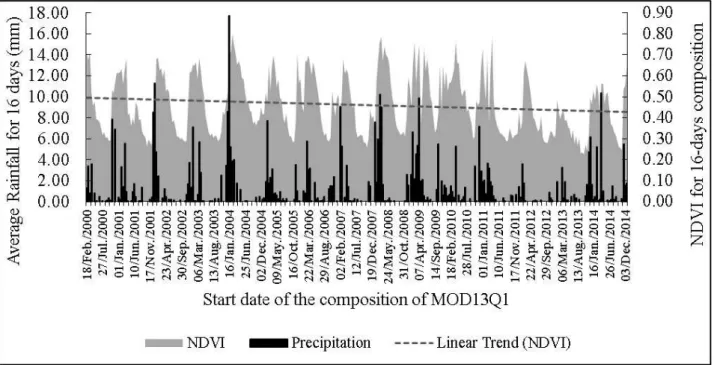
Figure 4 shows the NDVI values as a function of time (2000 - 2014) and the mean rainfall in the 16-day imaging period of each MOD13Q1 scene.
The rainfall is concentrated in the period between November to April, with a visible contrast with the other six months. Although the logic of the rainfall increasing (decreasing) contributes to a positive (negative) NDVI response, correlating it with rainfall is not an easy task. Since a range of biophysical variables act simultaneously and together in the absorption process of water by the plant, and it has a certain time interval (that usually occurs following the next 16-day composition or even in the composition itself) until it presents the greenness identified by the orbital images.
FIGURE 3. Highlights of municipalities comprising meaningful results on frequency analysis of pixels between 0 and 20% VCI.
FIGURE 4. Temporal arrangement of NDVI and rainfall for Petrolina-PE.
It was believed that the droughts at the end of the period have influenced the slight decreasing trend in NDVI estimates. The mean annual rainfall of the study period (410.9 mm) differs by 28.83% from the climatological data from 1961-1990 presented by INMET (2017) for Petrolina-PE (577.4 mm).
Agreste is as area of transition between the wet forest zone and to the dry Sertão backwoods,
being able to present characteristics of the two regions. For the most western region of the agreste
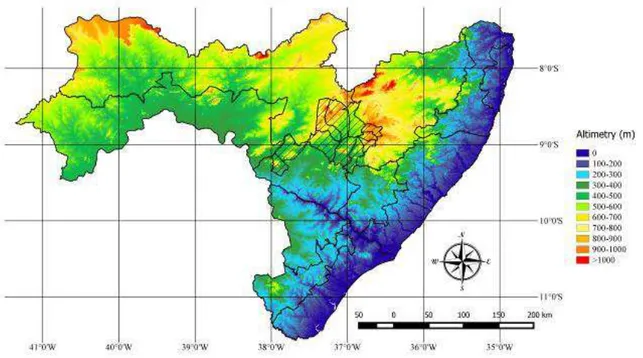
(the case of Águas Belas), eastern climate systems have less importance than ITCZ (Molion & Bernardo, 2002; Reboita et al., 2012), which is believed to be due to the elevation conditions of the state of Pernambuco (Figure 5). The eastern portion with high altitudes provides conditions for an orographic rainfall, which is generated by the southeast trade winds, within the windward, besides dry winds in Águas Belas city (Reboita et al., 2012).
FIGURE 5. Altimetry of the states of Alagoas, Pernambuco, and Sergipe. Hatched area corresponds
to the core area of agreste of Pernambuco, Água Branca, and Mata Grande.
Lower VCI frequencies were found in backwoods of Alagoas, more specifically in the municipalities of Mata Grande and Água Branca (Figure 2). This fact occurs due to the
configuration of the local rainfall regime, more similar to the Agreste than to the Sertão
(backwoods) of Alagoas. The local elevation promotes the development of clouds (topographically induced convective systems) over the area.
A few municipalities in the hinterland of Alagoas showed frequencies between 45-50%, and occurrence of (few) areas between 55-60%. This pattern was observed in areas of the municipalities of Canapi, Maravilha, Ouro Branco, Poço das Trincheiras, São José da Tapera, Senador Rui Palmeira, and North of Piranhas.
In Sergipe, a few pixels with frequency around 50% occurred on the northern side of Poço
Verde (located in the agreste of Sergipe), and pixels between 40 and 50% are few and well
distributed throughout the municipalities of Canindé do São Francisco, Poço Redondo, and Porto da Folha.
The analysis of the soil potential for agriculture (Figure 6) and the land use map (Figure 7) in
the areas with the highest frequency of ICV0-20%, makes it possible to determine what the surface
FIGURE 6. Soil potential for agriculture of the study area.
Source: IBGE, 2010b, adapted by the author.
FIGURE 7. Land use map of the study area.
Source: IBGE, 2010a, adapted by the author.
The CDN, despite the high relative frequency of the VCI, presented medium to high soil fertility and regular soil physical and morphological characteristics, justifying the predominance of agricultural activity in the region (Figure 7).
Although the core region of the agreste of Pernambuco presented low soil fertility and regular
soil morphology, some crop activities still found in this region.
In addition, in the backwoods of Alagoas and Agreste of Sergipe, where the frequency of
ICV0-20% was more pronounced, soil conditions made agricultural practice unfeasible in the region.
Table 1 shows the agricultural potential and land use in the most frequently highlighted areas of ICV0-20% for each state.
TABLE 1. Soil potential for agriculture and dominant land use type in areas most susceptible to desertification.
Area (km²) Municipality/ region State Soil potential for agriculture Fertility Morphology Dominant Land use type
1,449.69 CDN PE Medium to high Regular
Predominance of agricultural activity, with woods and / or natural forests
3,350.62 Afrânio, Petrolina and Dormentes PE Medium to high Regular to good
Predominance of agricultural activity, diversified uses, woods and / or forests, pastures and crops,
760.06 Agreste PE Low Regular Agricultural pastures + crops activity,
470.69 Sertão AL unfavorable Low and unfavorable Regular to Pastures + crops, natural pastures
45.31 Agreste SE Unfavorable Unfavorable
Urbanized area,
permanent crops, pastures + crops
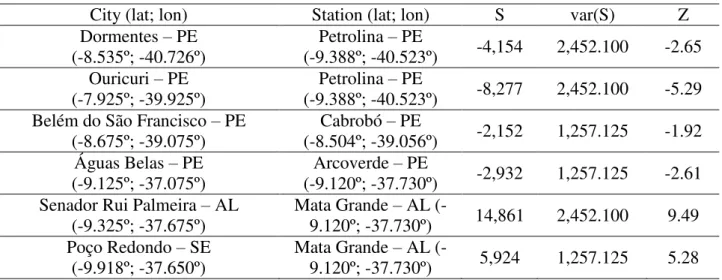
The results of Mann-Kendall test for six selected sites are shown in table 2. Figure 8 displays the layout of NDVI with respect to time, to the rainy season of Ouricuri-PE (7.925º S; 39,925° W) in southwestern of Pernambuco.
TABLE 2. Mann-Kendall test applied to the series of NDVI VIP product. S is the test statistic; var (S) is the variance of S and Z is the standard normal variable associated with S.
City (lat; lon) Station (lat; lon) S var(S) Z
Dormentes – PE
(-8.535º; -40.726º) (-9.388º; -40.523º) Petrolina – PE -4,154 2,452.100 -2.65
Ouricuri – PE
(-7.925º; -39.925º)
Petrolina – PE
(-9.388º; -40.523º) -8,277 2,452.100 -5.29
Belém do São Francisco – PE
(-8.675º; -39.075º)
Cabrobó – PE
(-8.504º; -39.056º) -2,152 1,257.125 -1.92
Águas Belas – PE
(-9.125º; -37.075º)
Arcoverde – PE
(-9.120º; -37.730º) -2,932 1,257.125 -2.61
Senador Rui Palmeira – AL
(-9.325º; -37.675º)
Mata Grande – AL
(-9.120º; -37.730º) 14,861 2,452.100 9.49
Poço Redondo – SE
(-9.918º; -37.650º)
Mata Grande – AL
According to the Mann-Kendall test, NDVI trends were identified for the six selected sites and they were statistically significant at the 5% confidence level. The trend was negative for Dormentes, Ouricuri, Belém do São Francisco and Águas Belas municipalities, located in the state
of Pernambuco. For the municipalities of Senador Rui Palmeira - AL and Poço Redondo – SE, the
trend was positive. Therefore, high Frel in Senador Rui Palmeira and Poço Redondo was due to the
last drought verified by the VCI data, making the tendency to desertification found in these areas unfeasible.
According with the maps showed by Santana (2007), the southwestern side of São Francisco mesoregion (PE) and the south of the nucleus around the Águas Belas municipality, areas indicated as susceptible to desertification by this research, were disregarded as pilot areas for desertification studies by the MMA
FIGURE 8. NDVI trend for the wet period of Ouricuri-PE municipality.
CONCLUSIONS
The application of VCI based on MOD13Q1 product proved to be effective in characterizing the frequency of droughts and their special heterogeneity in the three states, both with respect to physiography and climatology.
The areas included in the Cabrobó Desertification Nucleus, in the Southwestern Pernambuco state, and around the Águas Belas municipality were classified as susceptible to drought and desertification.
A few municipalities in the backwoods of Alagoas showed a frequency of very low VCI – i.e.
below 20% (between 45-50%) as well as the occurrence of areas between 55-60%.
In Sergipe, (few) areas with frequency around 50% were reported on the north side of Poço
Verde (located in the agreste of Sergipe) and pixels between 40 and 50% were few and well
distributed throughout the municipalities of Canindé do São Francisco, Poço Redondo, and Porto da Folha.
Among the areas identified with a higher frequency of low rates, i.e. with greater frequency of
droughts, solely the southwestern side of São Francisco mesoregion and the south of the Agreste of
Incorporating surface temperature data into vegetation condition estimation can improve the accuracy of the method against thermal stress (to which tropical vegetation cover is subjected).
ACKNOWLEDGEMENTS
To the National Council for Scientific and Technological Development (Conselho Nacional de Desenvolvimento Científico e Tecnológico - CNPq) for the financial support which enabled the execution of this research.
REFERENCES
Di Pace FT, Silva BB, Silva VPR, Silva STA (2008) Mapeamento do saldo de radiação com imagens Landsat 5 e modelo de elevação digital. Revista Brasileira de Engenharia Agrícola e Ambiental 12(4):385-392. DOI: http://dx.doi.org/10.1590/S1415-43662008000400009
Didan KAB (2016) NASA MEaSUREs Vegetation Index and Phenology (VIP) Vegetation Indices 15 Days Global 0.05Deg CMG [Data set]. NASA EOSDIS Land Processes DAAC. DOI:
https://doi.org/10.5067/measures/vip/vip15.004
Dutta D, Kundu A, Patel NR, Saha SK, Siddiqui AR (2015) Assessment of agricultural drought in Rajasthan (India) using remote sensing derived Vegetation Condition Index (VCI) and Standardized Precipitation Index (SPI). The Egyptian Journal of Remote Sensing and Space Science 18(1):53-63. DOI: http://dx.doi.org/10.1016/j.ejrs.2015.03.006
Gebrehiwot T, Van Der Veen A, Maathuis B (2011) Spatial and temporal assessment of drought in the Northern highlands of Ethiopia. International Journal of Applied Earth Observation and
Geoinformation 13(3):309-321. DOI: https://doi.org/10.1016/j.jag.2010.12.002
Hao C, Zhang J, Yao F (2015) Combination of multi-sensor remote sensing data for drought monitoring over southwest China. International Journal of Applied Earth Observation and Geoinformation 35:270-283. DOI: http://dx.doi.org/10.1016/j.jag.2014.09.011
Huete AR, Justice CO, Van Leeuwen W (1999) MODIS vegetation index (MOD13) algorithm theoretical basis document 3:213. Available: https://modis.gsfc.nasa.gov/data/atbd/atbd_mod13.pdf. Accessed: Feb 12, 2016.
IBGE - Instituto Brasileiro de Geografia e Estatística (2010a) Geociências: Cobertura e uso da terra. Available: http://downloads.ibge.gov.br/downloads_geociencias.htm. Accessed: Feb 8, 2017. IBGE - Instituto Brasileiro de Geografia e Estatística (2013) Recursos Naturais e Estudos Ambientais. Manual técnico de uso da terra. Available:
http://www.ibge.gov.br/home/geociencias/recursosnaturais/usodaterra/manual_usodaterra.shtm. Accessed: Feb 8, 2017.
IBGE - Instituto Brasileiro de Geografia e Estatística (2010b) Mapas do Brasil: potencial agrícola. Available: http://mapas.ibge.gov.br/interativos/servicos/wms-do-arcgis.html. Accessed: Feb 8, 2017.
IBGE. Mapa de Clima do Brasil. Escala 1:5.000.000. Rio de Janeiro: IBGE, 2002. Available: ftp://geoftp.ibge.gov.br/informacoes_ambientais/climatologia/mapas/brasil/clima.pdf. Accessed: Feb 8, 2017.
INMET - Instituto Nacional de Meteorologia (2017). Banco de dados meteorológicos para ensino e pesquisa. BDMEP. Available: http://www.inmet.gov.br/projetos/rede/pesquisa/. Accessed: Feb 9, 2017.
Kogan FN, Adamenko T, Guo W (2013) Global and regional drought dynamics in the climate warming era. Remote Sensing Letters 4(4):364-372. DOI:
Kogan FN, Guo W (2014) Early twenty-first-century droughts during the warmest climate. Geomatics, Natural Hazards and Risk 7(1):1-11. DOI:
http://dx.doi.org/10.1080/19475705.2013.878399
Kogan FN, Guo W, Strashnaia A, Kleshenko A, Chub O, Virchenko O (2015) Modelling and prediction of crop losses from NOAA polar-orbiting operational satélites. Geomatics, Natural Hazards and Risk 7(3):1-16. DOI: http://dx.doi.org/10.1080/19475705.2015.1009178
Kogan FN, Salazar L, Roytman L (2012) Forecasting crop production using satellite-based vegetation health indices in Kansas, USA. International Journal of Remote Sensing 33(9):2798-2814. DOI: http://dx.doi.org/10.1080/01431161.2011.621464
Marengo JA, Alves LM, Soares WR, Rodriguez DA (2013) Two contrasting severe seasonal extremes in Tropical South America in 2012: Flood in Amazonia and drought in Northeast Brazil. American Meteorological Society 26:9137-9154. DOI: http://dx.doi.org/10.1175/JCLI-D-12-00642.1
Molion LCB, Bernardo SDO (2002) Uma revisão da dinâmica das chuvas no nordeste brasileiro. Revista Brasileira de Meteorologia 17(1):1-10. Available:
http://www.rbmet.org.br/port/revista/revista_artigo.php?id_artigo=548. Accessed: Nov 23, 2015. PAN BRASIL (2005) Programa de Ação Nacional de Combate à Desertificação e Mitigação dos Efeitos da Seca. Ministério do Meio Ambiente. PAN BRASIL. p213. Available:
http://www.mma.gov.br/gestao-territorial/combate-a-desertificacao/programa-nacional. Accessed: Nov 23, 2015.
Reboita MS, Krusche N, Ambrizzi T, Rocha RP (2012) Entendendo o tempo e o clima na América do Sul. Terrae Didatica 8:34-50. DOI: http://dx.doi.org/10.20396/td.v8i1.8637425
Reboita MS, Santos IA (2014) Influência de alguns padrões de teleconexão na precipitação no norte e nordeste do Brasil. Revista Brasileira de Climatologia 15:28-48. DOI:
http://dx.doi.org/10.5380/abclima.v15i0.37686
Rouse JW, Haas Jr RH, Deering DW, Schell JA, Harlan JC (1974) Monitoring the vernal
advancement and retrogradation (green wave effect) of natural vegetation, NASA/GSFC type III final report: Greenbelt, NASA. 371p. Available: https://ntrs.nasa.gov/search.jsp?R=19740022555. Accessed: Jan 12, 2016.
Santana MO (org) (2007) Atlas das áreas suscetíveis a desertificação do Brasil /MMA. Secretaria de Recursos Hídricos. MMA. Available:
http://www.mma.gov.br/estruturas/sedr_desertif/_arquivos/129_08122008042625.pdf. Accessed: Mar 10, 2016.
Sousa FAZ, Morais HF, Silva VPR (2011) Influência da urbanização no clima da cidade de Campina Grande-PB. Revista Brasileira de Geografia Física 4(1):134-145. Available: