FINISHING PIG (30-90 KG) FEEDING
Farelo da semente de maracujá na alimentação de suínos em crescimento e terminação (30-90 kg)
Dani Perondi1, Ivan Moreira2, Paulo Cesar Pozza2, Paulo Levi de Oliveira Carvalho2, Tiago Junior Pasquetti2, Laura Marcela Diaz Huepa2
ABSTRACT
The passion fruit seed is a byproduct of the extraction of the passion fruit pulp and can be used for feeding to pigs. Two experiments were conducted (digestibility and performance) to evaluate the use of the passion fruit seed meal in feed for growing
and finishing pigs. A digestibility trial was conducted with growing and finishing pigs, in which the passion fruit seed meal (PSM) replaced the reference diet (0% PSM) in levels of 4, 8, 12 and 16%. Thirty barrows were used with average weight of 36.85±4.19. The PSF showed DE and ME of 3.244 and 3.223 Mcal/kg, respectively. In the performance trial, were used 150 pigs, which 75 in the growing phase and 75 pigs in the finishing, with initial body weight of 30.63±1.49 and final of 60.38±4.75 kg and 60.40±1.50 and 90.02±4.84 kg, respectively. Five diets were used, with four inclusion levels of PSM (4, 8, 12 e 16%) and one control diet (0% of PSM). The PSM levels did not influence (P>0.05) the performance variables. In the growing pigs, serum levels of cholesterol increased linearly with (P<0.05) inclusion levels of PSM. Quantitative of carcass traits and meat quality were not affected (P>0.05) by increasing levels of PSM in the diets. We conclude that the PSM can be used up to 16% in growing and finishing pigs diets.
Index terms: Co-product, digestibility, nutritional value, carcass.
RESUMO
A semente do maracujá é um subproduto da extração da polpa do maracujá, podendo ser utilizado na alimentação dos suínos. Foram conduzidos dois experimentos (digestibilidade e desempenho), objetivando avaliar a utilização do farelo da semente de maracujá na alimentação de suínos em crescimento e terminação. Inicialmente foi realizado um ensaio de digestibilidade com suínos em crescimento e terminação, em que o farelo da semente de maracujá (FSM) substituiu a ração referência (0% FSM) em níveis de 4, 8, 12 e 16%. Foram utilizados 30 suínos, machos castrados, com peso vivo médio inicial de 36,85±4,19. O FSM apresentou ED e EM de 3.244 e 3.223 Mcal/kg, respectivamente. No ensaio de desempenho, foram utilizados 150 suínos, sendo 75 na fase de crescimento e 75 na fase de terminação, com peso vivo inicial de 30,63±1,49 e final de 60,38±4,75 kg e 60,40±1,50 e 90,02±4,84 kg, respectivamente. Foram utilizadas cinco dietas, sendo quatro níveis de inclusão do FSM (4, 8, 12 e 16%) e uma ração testemunha (0% do FSM). Os níveis do FSM não influenciaram (P>0,05) as variáveis de desempenho. Na fase de crescimento, os níveis séricos de colesterol aumentaram linearmente (P<0,05) com os níveis de inclusão do FSM. As variáveis quantitativas de carcaça e qualitativas da carne não foram influenciadas (P>0,05) pelos níveis crescentes do FSM nas dietas. Conclui-se que o FSM pode ser utilizado em até 16% em dietas de suínos em crescimento e terminação.
Termos para indexação: Subproduto, digestibilidade, valor nutricional, carcaça.
1Universidade Estadual Paulista/UNESP – Faculdade de Ciências Agrárias e Veterinárias/FCAV – Via de Acesso Paulo Donato Castellane – s/n –
14884.900 – Jaboticabal – SP – Brasil – daniel.prd@zootecnista.com.br
2Universidade Estadual de Maringá/UEM – Departamento de Zootecnia – Maringá – PR – Brasil
Received in november 29, 2013 and approved in april 19, 2014
INTRODUCTION
World production of pork meat reached, in 2011, the total of 101.127 million metric tons, in which China was the largest producer (49.500), followed by the European Union (22.530), the United States (10.278) and the Brazil (3.227) in fourth position (ABIPECS, 2012).
The pig production can be impaired by high
production costs, mainly corn and soybean meal. These two ingredients, due its composition and nutritional value, are the base for feed of monogastric animals, in especially pigs. Thus, there is a need to search new sources
of alternative food and quantify the animal responses, in performance and economic terms. One alternative is the introduction of co-products industry fruits (juice and pulp) in the diet, however, some of these co-products still lack studies about its adequate nutritional composition, as well
as its economic viability.
According to Ferrari, Colussi and Ayub (2004) only 23.20% of passion fruit is availed during the juice production, and the remainder (76.80%) is residues, in which the seed represents 6 to 12% of the total weight of the fruit.
Chau and Huang (2004) observed that the seed
of passion fruit showed high levels of ether extract
(24.50%) and crude protein (8.25%), which is similar to corn. Ariki et al. (1977) found value of 1.635 Mcal/kg of metabolizable energy in passion fruit seed meal for broiler chickens. Using passion fruit seed meal in diets for broilers Togashi et al. (2008) found that the inclusion of up 8% did not impair the performance and carcass traits of birds. Likewise Ariki et al. (1977) found no loss in the
performance of the broilers.
Thus, because of the scarcity of scientific
information about the passion fruit seed meal in feed for
pigs, this work was conducted to determine the nutritional value and verify the performance, blood biochemical variables, quantitative carcass traits, meat quality and economic viability in growing and finishing pigs.
MATERIAL AND METHODS
The experiments were conducted in the pig sector
of Iguatemi Experimental Farm, owned by the Center for Agricultural Sciences of Maringá State University. The co-product of passion fruit, (Passiflora edulis) was
ceded by the fruit industry - Fruteza - Ltda. The material
studied was obtained from the extraction of the pulp and
passion fruit peel, and stored in cold chambers (-18°C). The co-product had 60% of moisture and was subjected to dehydration. The dehydration was done in the sun, in a cemented area, until the material reaches ideal humidity for
storage. The material was ground in a hammer mill (with
sieve containing holes of 2.5 mm of diameter), and thus obtaining the PSM (passion fruit seed meal).
Analyses of dry matter, organic matter, ash, crude protein, neutral detergent fiber, acid detergent fiber, pH, crude fat and gross energy were carried out according to the procedures described by Silva and Queiroz (2005).
In the digestibility trial, 30 barrows of commercial line, average 36.85±4.19 kg of body weight, were allotted in a randomized block design with five treatments and six replications, and were individually housed in metabolism cages type “Pekas”. The PSM replaced (based on dry matter) the basal diet at levels of 4, 8, 12 and 16%, resulting in four test diets and one reference diet (0% of PSM). The reference diet, based on corn and soybean meal, was calculated to meet the requirements proposed by Rostagno
et al. (2011).
The experimental period consisted of 15 days (ten days of adaptation and five days of total collection
of feces and urine). The feeding and collection of feces and urine were performed according to the procedures
described by Sakomura and Rostagno (2007). In the collection period, the amount of feed provided per animal
was calculated on the basis of metabolic body weight (0.75kg) and the average consumption recorded in the adaptation period.
The digestibility of dry matter, gross energy and
metabolization coefficient of organic matter, crude protein, neutral detergent fiber, acid detergent fiber and crude fat were calculated according to Matterson, Potter and Stutz (1965). The digestible energy (DE) and metabolizable (ME) were estimated by regression analysis (Adeola; Ileleji, 2009).
In the growing pigs performance trial, 75 crossbred pigs from a commercial line were used, with average initial body weight of 30.63±1.49 and final of 60.38±4.75 kg, and 75 pigs in the finishing with average initial body weight of 60.40±1.50 and final of 90.02±4.84 kg.
The treatments consisted of five diets with
four inclusion levels of PSM (4, 8, 12 and 16%) and a control diet (0% to PSM). The diets, based on corn and soybean meal (Table 1 and 2), were formulated to meet the requirements proposed by Rostagno et al. (2011) for pigs during the growing (30-60 kg) and finishing (60-90 kg) pigs.
The pigs were allotted in a randomized block design, with 15 replications in the time and one pig
per experimental unit. The treatments consisted of four
inclusion levels (4, 8, 12 and 16%) of PSM and a control diet (0% of PSM). The animals were housed in facilities, covered with fiber cement tiles, consisting of 40 pens. The
animals were weighed at the beginning and at the end of
the experiment, and the total feed intake was computed, in order to calculate the daily feed intake, daily weight gain and feed conversion for each experimental unit. At the end of the growing and finishing pigs, backfat thickness and loin depth were measured at the position P2, using the apparatus Sono-Grader (Renco®).
At the beginning of the trial, in the growing and finishing pigs, blood samples were harvest for analysis of plasma urea nitrogen (PUN). The results obtained in the beginning were used as a “covariate” for the statistical analysis of PUN at the end of the trial. For glucose, triglycerides and cholesterol the procedures were performed as Moreno et al. (1997).
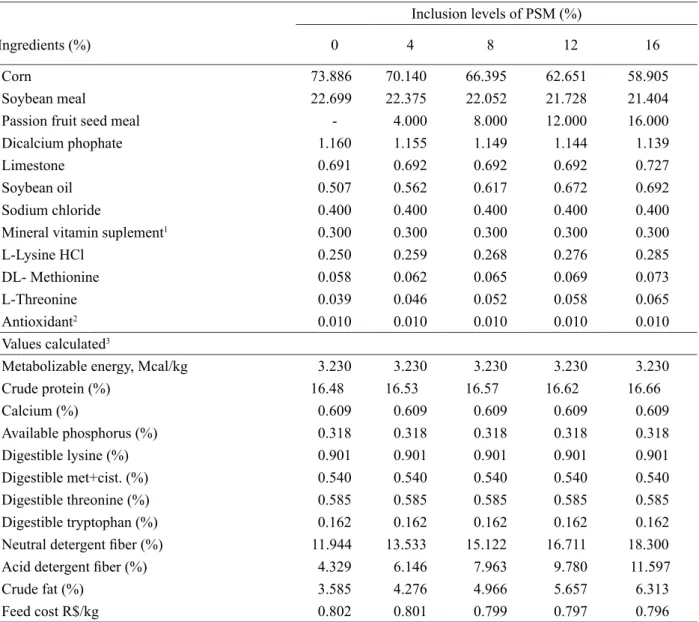
Table 1 – Centesimal and chemical composition of diets containing increasing levels of passion fruit seed meal (PSM)
for pigs, during the growing (30-60 kg).
Inclusion levels of PSM (%)
Ingredients (%) 0 4 8 12 16
Corn 73.886 70.140 66.395 62.651 58.905
Soybean meal 22.699 22.375 22.052 21.728 21.404
Passion fruit seed meal - 4.000 8.000 12.000 16.000
Dicalcium phophate 1.160 1.155 1.149 1.144 1.139
Limestone 0.691 0.692 0.692 0.692 0.727
Soybean oil 0.507 0.562 0.617 0.672 0.692
Sodium chloride 0.400 0.400 0.400 0.400 0.400
Mineral vitamin suplement1 0.300 0.300 0.300 0.300 0.300
L-Lysine HCl 0.250 0.259 0.268 0.276 0.285
DL- Methionine 0.058 0.062 0.065 0.069 0.073
L-Threonine 0.039 0.046 0.052 0.058 0.065
Antioxidant2 0.010 0.010 0.010 0.010 0.010
Values calculated3
Metabolizable energy, Mcal/kg 3.230 3.230 3.230 3.230 3.230
Crude protein (%) 16.48 16.53 16.57 16.62 16.66
Calcium (%) 0.609 0.609 0.609 0.609 0.609
Available phosphorus (%) 0.318 0.318 0.318 0.318 0.318
Digestible lysine (%) 0.901 0.901 0.901 0.901 0.901
Digestible met+cist. (%) 0.540 0.540 0.540 0.540 0.540
Digestible threonine (%) 0.585 0.585 0.585 0.585 0.585
Digestible tryptophan (%) 0.162 0.162 0.162 0.162 0.162
Neutral detergent fiber (%) 11.944 13.533 15.122 16.711 18.300
Acid detergent fiber (%) 4.329 6.146 7.963 9.780 11.597
Crude fat (%) 3.585 4.276 4.966 5.657 6.313
Feed cost R$/kg 0.802 0.801 0.799 0.797 0.796
1Vitamin and mineral premix for growing pigs (Vit A, 2,300,000 IU; Vit D3, 466,667 IU; Vit E – 5,000 IU; Vit K3, 667 mg ; Vit B1, 333 mg ; Vit B2, 1,000 mg ;Vit B6, 400 mg ; Vit B12, 4,000 µg ; Pholic Acid, 67 mg; Niacin, 6,660 mg; Ac. Pantothenic, 4,000 mg; Biotin,17 mg; Choline ,43 g; Iron 26,667 mg; Copper, 41,667 mg; Cobalt, 183 mg; Manganese, 16,667 mg; Zinc, 26,667 mg; Selenium, 67 mg; Iodine, 267 mg; Antioxidant 27 g; Vehicle q.s.p., 1,000 g); 2BHT; 3Calculated based on Rostagno et al. (2011) and/or determined. Source: Elaboration of the authors
Carcasses were chilled (1 to 2°C) for 24 hours and then, were subjected to quantitative evaluation, according to the Brazilian Method of Carcass Classification Swine MBCC (Bridi; Silva, 2009).
The economic viability of PSM was done with basis
on prices of raw material that were obtained in the local
market, and then, the costs of feed per Kg of live weight
gain were calculated according to Bellaver et al. (1985). It was also calculated the Economic Efficiency Index (EEI) and the Cost Index (CI), according to the methodology proposed by Gomes et al. (1991). The values obtained were
the inclusion level of k, M = constant associated with all observations, Bi = effect of block, where i = 1, 2, 3.... 15, Sj = effect of sex j (1 = female 2 = male); Nk = effect of the levels the PSM, where k = 0, 4, 8, 12, 16%; eijkm =
random error associated with the observation. The degrees
of freedom, related to the inclusion levels of PSM, were broken down into orthogonal polynomials to obtain the regression equations. To analyse data, the initial weight
of the pigs was used as a covariate.
RESULTS AND DISCUSSION
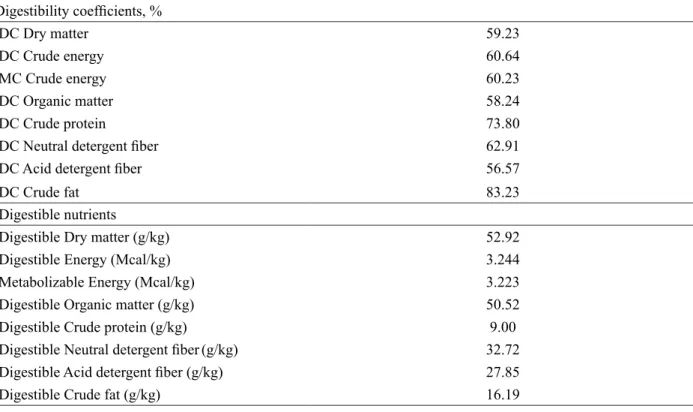
The digestibility coefficients of ether extract of PSM (Table 3) showed intermediate values compared to indicated by Rostagno et al. (2011), for corn (90%) and sorghum (80%).
The digestible coefficient of organic matter of
PSM (58.24%) showed lower value than those described by Rostagno et al. (2011), for corn (90%) and sorghum
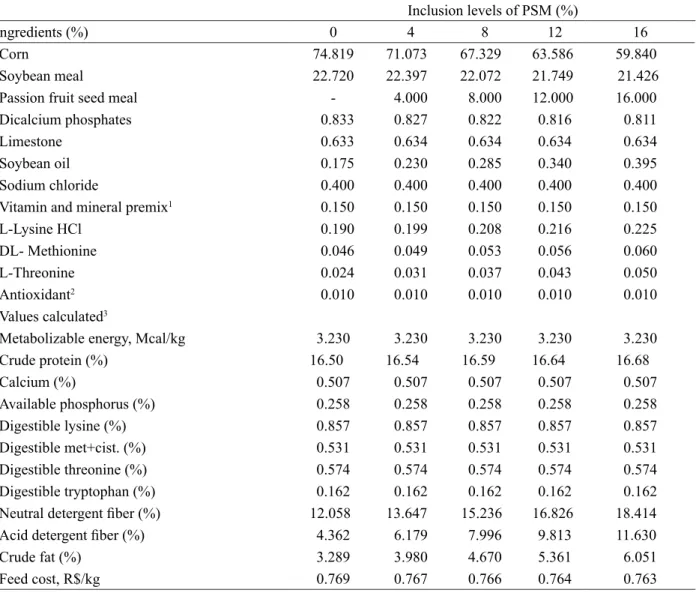
Inclusion levels of PSM (%)
Ingredients (%) 0 4 8 12 16
Corn 74.819 71.073 67.329 63.586 59.840
Soybean meal 22.720 22.397 22.072 21.749 21.426
Passion fruit seed meal - 4.000 8.000 12.000 16.000
Dicalcium phosphates 0.833 0.827 0.822 0.816 0.811
Limestone 0.633 0.634 0.634 0.634 0.634
Soybean oil 0.175 0.230 0.285 0.340 0.395
Sodium chloride 0.400 0.400 0.400 0.400 0.400
Vitamin and mineral premix1 0.150 0.150 0.150 0.150 0.150
L-Lysine HCl 0.190 0.199 0.208 0.216 0.225
DL- Methionine 0.046 0.049 0.053 0.056 0.060
L-Threonine 0.024 0.031 0.037 0.043 0.050
Antioxidant2 0.010 0.010 0.010 0.010 0.010
Values calculated3
Metabolizable energy, Mcal/kg 3.230 3.230 3.230 3.230 3.230
Crude protein (%) 16.50 16.54 16.59 16.64 16.68
Calcium (%) 0.507 0.507 0.507 0.507 0.507
Available phosphorus (%) 0.258 0.258 0.258 0.258 0.258
Digestible lysine (%) 0.857 0.857 0.857 0.857 0.857
Digestible met+cist. (%) 0.531 0.531 0.531 0.531 0.531
Digestible threonine (%) 0.574 0.574 0.574 0.574 0.574
Digestible tryptophan (%) 0.162 0.162 0.162 0.162 0.162
Neutral detergent fiber (%) 12.058 13.647 15.236 16.826 18.414
Acid detergent fiber (%) 4.362 6.179 7.996 9.813 11.630
Crude fat (%) 3.289 3.980 4.670 5.361 6.051
Feed cost, R$/kg 0.769 0.767 0.766 0.764 0.763
1Vitamin and mineral premix for fishing pigs (Vit A, 2,666,660 IU; Vit D3, 533,300 IU ; Vit E, 4,667 IU ; Vit K3, 1,200 mg ; Vit B1, 200 mg ; Vit B2, 13.336 mg; Vit B6, 133 mg ; Vit B12, 6,667 µg; Pholic Acid, 34 mg; Niacin, 10,000 mg; Pantothenic, 666,666 mg; Biotin, 20 mg; Choline, 62 g; Iron, 40 mg; Copper, 86,805 mg; Cobalt, 334 mg; Manganese, 30,000 mg; Zinc, 46,666 mg; Selenium, 67 mg; Iodine, 400 mg; Antioxidant, 40 g; Vehicle q.s.p., 1,000 g); 2BHT; 3Calculate based on Rostagno et al. (2011) and/ or determined. Source: Elaboration of the authors.
(75.53%), respectively. These differences observed in the nutrients digestibility of PSM, compared to corn and sorghum, could be due to the elevated amount of NDF. According to Bertechini (2012) the fraction of fiber, when presents in the diets for monogastric, impair the nutrient digestibility, due to increasing the speed of intestinal transit, which reduce the
use of nutrients.
The DC and MC of gross energy for PSM (Table 3) were lower than those reported by Rostagno et al. (2011), for corn and sorghum, (87.88 and 84.77%, respectively). Probably, the high content of NDF for PSM decreased the gross energy digestibility and metabolization. According to Noblet and Perez (1993) the fiber reduces the nutrients
digestibility of ingredients in pig diets.
The highest DC was obtained for fat crude, showing that the PSM can be a good energetic source. This fact is particularly interesting, since our study aims to use the PSM as an alternative ingredient, replacing part of corn
in pig diets.
The PSM presented metabolizable energy of 3.223 Mcal/kg (Table 3), based in natural matter. This ME value
is higher than those observed for passion fruit seed meal
(1.635 Mcal/kg), found by Ariki et al. (1977). Possibly,
the lowest crude fat content verified by this author was the responsible for lower ME value for passion fruit seed meal, compared to the value obtained in our study, for PSM.
According to nutrients digestibility and metabolizable energy for PSM, is possible to use this ingredient as a substitute of part of corn in pig diets, in growing and finishing pigs, because the ME value is
similar to corn.
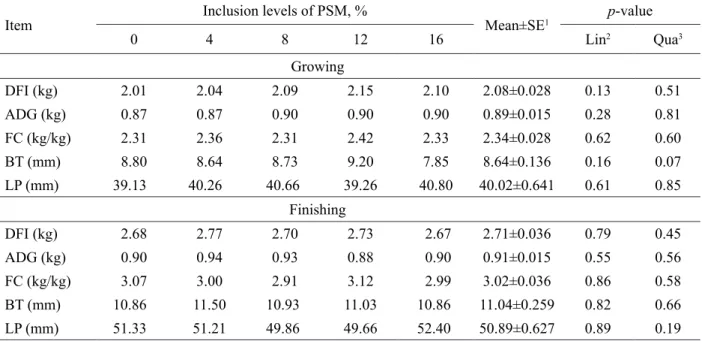
For the growing and finishing pigs, there was no effect (P>0.05) of inclusion levels of PSM on daily feed intake, average daily gain, feed conversion, backfat thickness and loin depth (Table 4). This means that, regardless of the inclusion levels of PSM (until 16%), the pig performance is not impaired, in which together with nutrients digestibility obtained for PSM, suggest
that this feedstuffs can be energy source for growing and
finishing pigs.
Additionally, the use of soybean oil in the diet, in order to adjust the diet to be isocaloric, may have helped to maintain constant performance of the animals, because according to Bertechini (2012), the use of fats and oils in pig diets has a number benefits, known as “specific dynamic
Digestibility coefficients, %
DC Dry matter 59.23
DC Crude energy 60.64
MC Crude energy 60.23
DC Organic matter 58.24
DC Crude protein 73.80
DC Neutral detergent fiber 62.91
DC Acid detergent fiber 56.57
DC Crude fat 83.23
Digestible nutrients
Digestible Dry matter (g/kg) 52.92
Digestible Energy (Mcal/kg) 3.244
Metabolizable Energy (Mcal/kg) 3.223
Digestible Organic matter (g/kg) 50.52
Digestible Crude protein (g/kg) 9.00
Digestible Neutral detergent fiber(g/kg) 32.72
Digestible Acid detergent fiber (g/kg) 27.85
Digestible Crude fat (g/kg) 16.19
action of fat.” Results to this study were similar to observed previously by Togashi et al. (2008) and Ariki et al. (1977), who using the passion fruit seed meal up to 8% in diets of broiler chicken, found no effect on animal performance.
Considering the blood biochemical variables, in growing pigs (Table 5), no effect of PSM were observed (P>0.05) on glucose, triglycerides and plasma urea nitrogen (PUN) levels. On the other hand, the cholesterol increased linearly (P<0.05). In the finishing pigs, there was no effect (P>0.05) of PSM levels on blood biochemical
variables.
Plasma levels of glucose, triglycerides, cholesterol and NUP, are within the range considered normal for the growing and finishing pigs (Moreno et al., 1997). The
increase of cholesterol during growing pigs may have been caused by increasing crude fat in the diet (Table
1). According to Nelson and Cox (2011) the dietetic conditions, such as the excessive crude fat may increase the circulating levels of plasma cholesterol. In this study,
the cholesterol values were different than those found by
Togashi et al. (2008), who using inclusion levels of up to 8% of PSM, in diets for broilers chickens, observed no change in plasma cholesterol. However, were used lower levels of inclusion (4 and 8%) and furthermore, the PSM showed lower value of crude fat (4.62%).
The results obtained for PUN, in our study, suggest that the PSM not impair the protein metabolism, maintaining the quality of protein in the diets. This reflects the adequate supply of amino acids, in quantity and quality in the diets (Coma; Carrion; Zimmerman, 1995).
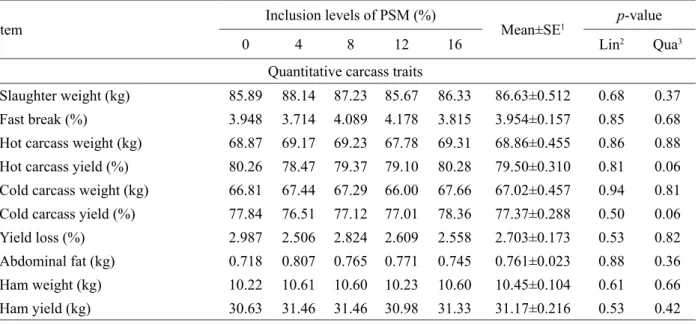
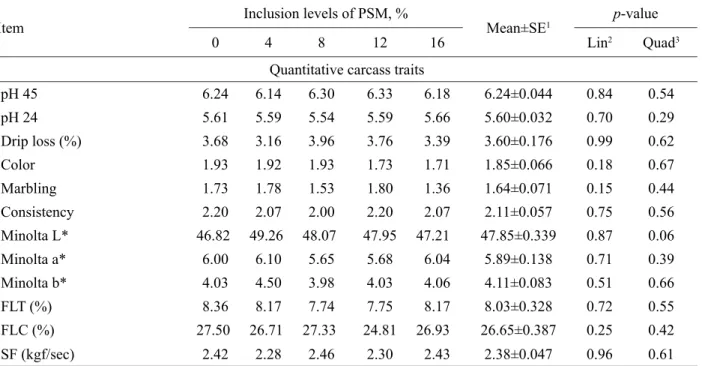
The utilization of increasing levels of PSM in the diets did not affect (P>0.05) the quantitative carcass traits and qualitative characteristics of pork meat, for finishing pigs (Tables 6 and 7).
It was verified that the PSM increased the NDF content of the diets for approximately 18% (Tables 1 and 2), in the highest level of inclusion, however, caused no changes in carcass traits of pigs. Likewase, Gomes et al. (2007) found that the increase in NDF content of pig diets did not impair the carcass traits, corroborating the findings in our study. Similar results to this study, for carcass traits, were found by Togashi et al. (2008) using passion fruit seed meal up to 8% in diets for broiler chickens.
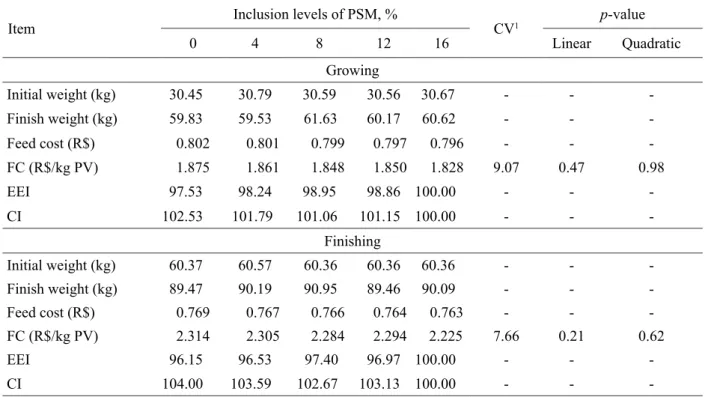
Concerning the economic analysis (Table 8) there was no effect (P>0.05) of inclusion levels of PSM, during the growing and finishing pigs, on feed cost per kilogram of live weight gain. Although no statistical analysis was performed for the EEI and IC, its best values were observed in the inclusion level of 16% of PSM. This result suggests that the PSM can be used up to 16% in diets for pigs, in growing and finishing pigs.
Table 4 – Daily feed intake (DFI), average daily gain (ADG), feed conversion (FC), backfat thickness (BT) and loin depth (LP) of growing and finishing (30-90 kg) pigs fed on diets contain different inclusion levels of passion fruit seed meal (PSM).
Item Inclusion levels of PSM, % Mean±SE1 p-value
0 4 8 12 16 Lin2 Qua3
Growing
DFI (kg) 2.01 2.04 2.09 2.15 2.10 2.08±0.028 0.13 0.51
ADG (kg) 0.87 0.87 0.90 0.90 0.90 0.89±0.015 0.28 0.81
FC (kg/kg) 2.31 2.36 2.31 2.42 2.33 2.34±0.028 0.62 0.60
BT (mm) 8.80 8.64 8.73 9.20 7.85 8.64±0.136 0.16 0.07
LP (mm) 39.13 40.26 40.66 39.26 40.80 40.02±0.641 0.61 0.85
Finishing
DFI (kg) 2.68 2.77 2.70 2.73 2.67 2.71±0.036 0.79 0.45
ADG (kg) 0.90 0.94 0.93 0.88 0.90 0.91±0.015 0.55 0.56
FC (kg/kg) 3.07 3.00 2.91 3.12 2.99 3.02±0.036 0.86 0.58
BT (mm) 10.86 11.50 10.93 11.03 10.86 11.04±0.259 0.82 0.66
LP (mm) 51.33 51.21 49.86 49.66 52.40 50.89±0.627 0.89 0.19
The increase of soybean oil and some synthetic
amino acids in the diets, contributed to increases the cost of diets. Thus, the viability of using the passion fruit seed meal, in pig diets, will also depend on the price of these
ingredients. These results suggest that the passion fruit
seed meal, with its price of 0.90 or less in relation to the price of corn, it becomes economically viable for pigs, in the growing and finishing.
Table 5 – Blood biochemical variables (mg/dl) of glucose, triglycerides, cholesterol and plasma urea nitrogen (PUN) of growing (30-60 kg) and finishing (60-90 kg) pigs feed on diets contain different inclusion levels of passion fruit seed meal (PSM).
Item Inclusion levels of PSM (%) Mean±SE1 p-value
0 4 8 12 16 Linear Quadratic
Growing
Glucose 82.10 78.00 81.15 79.57 85.14 81.22±1.409 0.40 0.17
Triglycerides 40.04 42.88 37.30 43.53 39.58 40.74±1.522 0.97 0.87
Cholesterol 64.14 69.03 79.79 71.78 72.25 69.53±1.449 0.04 0.49
NUP 11.08 12.14 11.44 11.79 13.07 11.90±0.320 0.10 0.57
Finishing
Glucose 84.50 78.86 84.60 84.25 82.46 82.93±1.424 0.89 0.89
Triglycerides 38.66 38.00 35.46 32.26 36.23 36.12±1.266 0.23 0.41
Cholesterol 71.77 72.83 69.46 71.83 71.50 71.48±1.203 0.85 0.77
NUP 15.53 15.91 15.37 16.87 14.66 15.67±0.423 0.79 0.38
Table 6 – Effect of diets contain different inclusion levels of passion fruit seed meal (PSM), on quantitative carcass traits and organs of pigs in finishing (60-90 kg).
Item Inclusion levels of PSM (%) Mean±SE1 p-value
0 4 8 12 16 Lin2 Qua3
Quantitative carcass traits
Slaughter weight (kg) 85.89 88.14 87.23 85.67 86.33 86.63±0.512 0.68 0.37
Fast break (%) 3.948 3.714 4.089 4.178 3.815 3.954±0.157 0.85 0.68
Hot carcass weight (kg) 68.87 69.17 69.23 67.78 69.31 68.86±0.455 0.86 0.88
Hot carcass yield (%) 80.26 78.47 79.37 79.10 80.28 79.50±0.310 0.81 0.06
Cold carcass weight (kg) 66.81 67.44 67.29 66.00 67.66 67.02±0.457 0.94 0.81
Cold carcass yield (%) 77.84 76.51 77.12 77.01 78.36 77.37±0.288 0.50 0.06
Yield loss (%) 2.987 2.506 2.824 2.609 2.558 2.703±0.173 0.53 0.82
Abdominal fat (kg) 0.718 0.807 0.765 0.771 0.745 0.761±0.023 0.88 0.36
Ham weight (kg) 10.22 10.61 10.60 10.23 10.60 10.45±0.104 0.61 0.66
Ham yield (kg) 30.63 31.46 31.46 30.98 31.33 31.17±0.216 0.53 0.42
Item Inclusion levels of PSM (%) Mean±SE1 p-value
0 4 8 12 16 Lin2 Qua3
Carcass length (cm) 89.46 88.99 88.56 89.98 88.28 89.03±0.336 0.51 0.86
Loin eye area (cm²) 33.64 34.74 35.69 33.78 34.84 34.54±0.480 0.67 0.46
Fat area (cm²) 13.81 15.22 14.83 15.75 13.89 14.70±0.405 0.81 0.12
Lean meat (kg) 50.96 53.33 53.98 51.90 54.16 52.84±0.599 0.24 0.55
Percentage of lean meat (%) 74.11 77.08 77.90 76.68 78.19 76.77±0.749 0.14 0.42
Meat: fat ratio 0.417 0.440 0.422 0.469 0.405 0.431±0.013 0.92 0.34
Relative liver (g/kg) 1.682 1.638 1.600 1.665 1.586 1.635±0.026 0.39 0.87
Relative kidney (g/kg) 0.381 0.383 0.370 0.384 0.399 0.383±0.004 0.31 0.21
1Standard error; 2Linear effect of levels of PSM; 3 Quadratic effect of levels of PSM.
Table 6 – Continued.
Table 7 – Effect of diets contain different inclusion levels of passion fruit seed meal (PSM) on the qualitative characteristics of pork meat, of pigs in finishing (60-90 kg)b.
Item Inclusion levels of PSM, % Mean±SE1 p-value
0 4 8 12 16 Lin2 Quad3
Quantitative carcass traits
pH 45 6.24 6.14 6.30 6.33 6.18 6.24±0.044 0.84 0.54
pH 24 5.61 5.59 5.54 5.59 5.66 5.60±0.032 0.70 0.29
Drip loss (%) 3.68 3.16 3.96 3.76 3.39 3.60±0.176 0.99 0.62
Color 1.93 1.92 1.93 1.73 1.71 1.85±0.066 0.18 0.67
Marbling 1.73 1.78 1.53 1.80 1.36 1.64±0.071 0.15 0.44
Consistency 2.20 2.07 2.00 2.20 2.07 2.11±0.057 0.75 0.56
Minolta L* 46.82 49.26 48.07 47.95 47.21 47.85±0.339 0.87 0.06
Minolta a* 6.00 6.10 5.65 5.68 6.04 5.89±0.138 0.71 0.39
Minolta b* 4.03 4.50 3.98 4.03 4.06 4.11±0.083 0.51 0.66
FLT (%) 8.36 8.17 7.74 7.75 8.17 8.03±0.328 0.72 0.55
FLC (%) 27.50 26.71 27.33 24.81 26.93 26.65±0.387 0.25 0.42
SF (kgf/sec) 2.42 2.28 2.46 2.30 2.43 2.38±0.047 0.96 0.61
b Fluid loss from thawing (FLT), fluid loss from cooking (FLC), a* indicates the coloration of meat ranging from red to green (high
Table 8 –Cost per kilograms of feed, feed cost per kilogram of live weight gain (FC), economic efficiency index (EEI) and cost index (CI) of pigs, during the growing and finishing, fed diets contain different levels of passion fruit seed meal (PSM).
Item Inclusion levels of PSM, % CV1
p-value
0 4 8 12 16 Linear Quadratic
Growing
Initial weight (kg) 30.45 30.79 30.59 30.56 30.67 - -
-Finish weight (kg) 59.83 59.53 61.63 60.17 60.62 - -
-Feed cost (R$) 0.802 0.801 0.799 0.797 0.796 - -
-FC (R$/kg PV) 1.875 1.861 1.848 1.850 1.828 9.07 0.47 0.98
EEI 97.53 98.24 98.95 98.86 100.00 - -
-CI 102.53 101.79 101.06 101.15 100.00 - -
-Finishing
Initial weight (kg) 60.37 60.57 60.36 60.36 60.36 - -
-Finish weight (kg) 89.47 90.19 90.95 89.46 90.09 - -
-Feed cost (R$) 0.769 0.767 0.766 0.764 0.763 - -
-FC (R$/kg PV) 2.314 2.305 2.284 2.294 2.225 7.66 0.21 0.62
EEI 96.15 96.53 97.40 96.97 100.00 - -
-CI 104.00 103.59 102.67 103.13 100.00 - -
-1Coefficient of variation.
CONCLUSION
The passion fruit seed meal shows 3.244 and 3.223 Mcal/kg of digestible and metabolizable energy, respectively, and can be added up to 16% in diets for growing and finishing pigs (30-90 kg), with possibility of
reducing on feed costs.
ACKNOWLEDGEMENTS
Fruteza-Ltda, for providing the passion fruit seed and to CAPES and CNPq, for the scholarship and research
grant.
REFERENCES
ABIPECS. ASSOCIAÇÃO BRASILEIRA DA INDÚSTRIA PRODUTORA E EXPORTADORA DE CARNE SUÍNA. Estatística de produção. Available
at: <http://www.abipecs.org.br/pt/estatisticas/mundial/ producao-2.html> Accessed on: Dez. 01, 2012.
ADEOLA, O.; ILELEJI, K. E. Comparison of two diet types in the determination of metabolizable energy
content of corn distillers dried grains with soluble for
broiler chickens by the regression method. Poultry Science. 88:579-585, 2009.
ARIKI, J. et al. Aproveitamento de cascas desidratadas e sementes de maracujá (Passiflora edulie f. flavicarpa
DEG.) na alimentação de frangos de corte. Científica.
5:340-343, 1977.
BELLAVER, C. et al. Radícula de malte na alimentação de suínos em crescimento e terminação. Pesquisa Agropecuária Brasileira. 20(8):969-74, 1985.
BERTECHINI, A. G. Nutrição de monogástricos.
Lavras: UFLA, 2012.
BRIDI, A.M.; SILVA, C.A. Métodos de Avaliação de Carcaça e da Carne Suína. Londrina, 120p. 2009.
COMA, J.; CARRION, D.; ZIMMERMAN, D.R. Use
of plasma urea nitrogen as a rapid response criterion to
determine the lysine requirement of pigs. Journal of Animal Science.73:472-481, 1995.
FERRARI, R. A.; COLUSSI, F.; AYUB, R.A. Caracterização de subprodutos da industrialização do maracujá:Aproveitamento das sementes. Revista Brasileira de Fruticultura. 26(1):101-102, 2004.
GOMES J.D.F. et al. Efeito do incremento de fibra dietética sobre a digestibilidade, desempenho e características de carcaça: Suínos em crescimento e terminação. Semina: Ciências Agrárias. 28(3):483-492, 2007.
GOMES, M.F.M. et al. Análise econômica da utilização
de triguilho para suínos. Concórdia:
EMBRAPA-CNPSA, p.1-2, 1991, (Comunicado Técnico, 179).
IBGE. Instituto Brasileiro de Geografia e
Estatística-Produção Agrícola Municipal. 2011.
MATTERSON, L.D.; POTTER, L.M.; STUTZ, M.W. The metabolizable energy of feed ingredients for chickens. Storrs, Connecticut University of Connecticut, Agricultural Experiment Station, Research Report.
7(1):11-14, 1965.
MORENO, A. M. et al. Colheita e processamento de sangue em suínos para fins de diagnóstico. EMBRAPA-CNPSA, 1997, 30p. (Documentos, 41).
NELSON, D. L.; MICHAEL, M. C. Princípios de Bioquímica de Lehninger. Porto Alegre, eDITORA
aRTMED, 1304P. 2011.
NOBLET, J.; PEREZ, J.M. Prediction of digestibility of
nutrients and energy values of pigs diets from chemical analysis. Journal of Animal Science. 71:3389-3398, 1993.
ROSTAGNO, H.S. et al. Tabelas brasileiras para aves e suínos: composição de alimentos e exigências nutricionais. 3.ed. Viçosa: UFV, 2011. 205p.
SAKOMURA, N.K.; ROSTAGNO, H.S. Métodos de pesquisa em nutrição de monogástricos. Jaboticabal:
Funep, 2007. 283p.
SILVA, D.J.; QUEIROZ, A.C. Análise de alimentos - métodos químicos e biológicos.3.ed. Viçosa,
Universidade Federal de Viçosa, 2005. 235p.
TOGASHI, C. K. et al. Subprodutos do maracujá em