Rev. Caatinga
EFFECT OF BIOFERTILIZATION ON YELLOW PASSION FRUIT PRODUCTION
AND FRUIT QUALITY
1ANA VERÔNICA MENEZES DE AGUIAR2*, LOURIVAL FERREIRA CAVALCANTE3, ROSEANO MEDEIROS DA SILVA2, TONY ANDRESON GUEDES DANTAS4, ELIZANGELA CABRAL DOS SANTOS2
ABSTRACT- This study aimed at evaluating the effects of bovine biofertilizer on passion fruit production and
fruit quality. We carried out an experiment in the city of Nova Floresta, Paraíba State, Brazil. It was carried out in a randomized block design with three replications and three plants per plot. We adopted a 3 x 5 factorial scheme, which evaluated three passion fruit genotypes and five cattle biofertilizer doses. The assessed genotypes consisted of a local one (Guinezinho - LG) and two hybrids (BRS Gigante Amarelo - GA and BRS
Sol do Cerrado - SC). We applied five rates of cattle biofertilizer (B) monthly at a constant volume of
5 L plant-1, after diluting in irrigation water (W) at an electrical conductivity of 1.4 dS m-1. The evaluated rates were 0% (100% irrigation water - 0B + 5W), 10% (1B + 9W), 20% (2B + 8W), 30% (3B + 7W) and 40%
(4B + 6W). Every week, we sampled, counted and weighed fruit to gather data on fruit number per plant, pant production, and yield. At peak production, we also sampled two fruit randomly from each plot floor area. These fruits were used for determinations of the average mass in fruit, peel and pulp (seeds + juice), peel thickness, fruit diameter and length, pulp yield, soluble solid content, titratable acidity, vitamin C, pH and pulp electrical conductivity. As a result, we observed that the biofertilizer did not compromise both LG and GA production capacity. Overall, the biofertilizer doses provided quality characteristics superior to those required by the fruit market.
Keywords: Passiflora edulis Sims. Organic input. Productivity. Post-harvest.
EFEITO DA BIOFERTILIZAÇÃO NA PRODUÇÃO E QUALIDADE DE FRUTOS DO MARACUJAZEIRO AMARELO
RESUMO - Com o objetivo de avaliar os efeitos de doses de biofertilizante bovino na produção e qualidade e frutos um experimento foi conduzido no município de Nova Floresta, PB, em delineamento de blocos ao acaso, com três repetições e três plantas por parcela, adotando o esquema fatorial 3G x 5B, referente a três genótipos: Genótipo Local (Guinezinho) e dois híbridos, o BRS Sol do Cerrado e BRS Gigante Amarelo e cinco doses de biofertilizante bovino (B) aplicados mensalmente em volume constante de 5 L planta-1,após diluído em água de irrigação (A) de condutividade elétrica 1,4 dS m-1 nos níveis percentuais de 0% (água de irrigação
- 0B + 5A),
10% (1B + 9A), 20% (2B + 8A), 30% (3B + 7A) e 40% (4B + 6A). Semanalmente os frutos foram colhidos,
contados e pesados para obtenção do número de frutos por planta, produção por planta, e produtividade. No pico da produção, foram colhidos ao acaso, dois frutos por parcela da área útil, para determinação da massa média do fruto, casca e polpa (sementes + suco), espessura da casca, diâmetro e comprimento dos frutos. Além
do rendimento em polpa, teor de sólidos solúveis, acidez titulável, vitamina C, valores de pH e da condutividade elétrica da polpa. A aplicação do biofertilizante não comprometeu a capacidade produtiva dos
genótipos Guinezinho e Gigante Amarelo. As doses de biofertilizante proporcionaram características de qualidade aos frutos superiores às exigidas pelo mercado.
Palavras chave: Passiflora edulis Sims. Insumo orgânico. Produtividade. Pós-colheita.
____________________
*Corresponding author
1Received for publication in 03/09/2016; accepted in 07/29/2016.
Paper extracted from the master dissertation of the first author, funded by CAPES/CNPq.
2Departament of Plant Sciences, Universidade Federal Rural do Semi-Árido, Mossoró, RN, Brazil; ana_aguiar_@live.com,
roseanomedeiros@gmail.com, elizangelacabral@ufersa.edu.br.
Rev. Caatinga
INTRODUCTION
Fruit farming has been highlighted in Brazil.
In this sector, the country has been the largest producer and consumer of yellow passion fruit
(Passiflora edulis Sims), harvesting around 823,284 ton in 2014. From that, nearly 71% is assigned to the northeast of the country (583,636 ton). Paraíba is the fifteenth producer state, with an output of 7,784 ton, however, having greater growth potential.
Brazilian passion fruit is grown for juice and fresh fruit production. Fruit selection is based on aesthetics, as consumers' criterion choice (ABREU et al., 2009). For industrial processing, pulp acidity should be between 3.2 and 4.5%, total soluble solids
(ºBrix) from 15 to 16%, and yield in juice above 40% (FOLEGATTI; MATSUURA, 2002).
Field management is extremely important to obtain fruit of good quality. In semi-arid regions of
the Brazilian Northeast, irrigation is widely used; however, in most cases, the water used has a high salt content, which may limit agricultural production and reduce crop profitability to sub-economic levels
(DIAS; BLANCO, 2010).
In addition, biofertilization is one of the farming alternatives to enhance crop yield using natural resources. Biofertilizers are effluents from aerobic or anaerobic fermentation of pure organic products, sometimes supplemented with minerals, being able to be used in agriculture for various purposes (LACERDA et al., 2010). Besides acting on physical and biological soil mechanisms, these products attenuate salinity effects during seedling production, plant growth and development, playing a
crucial role on fruit physical and chemical characteristics of yellow passion fruit, as reported by
Freire et al. (2010).
Owing to its great potential, passion fruit breeding program is an important tool to meet consumer market demands. Among the bred cultivars, the BRS Sol do Cerrado (SC) and BRS
Gigante Amarelo (GA) hybrids may reach an average productivity of 40 t ha-1. Moreover, these cultivars are suitable for both table and industry since their soluble solid content ranges from 13 to 14 °Brix (BORGES et al., 2008).
Against this background, this study aimed at evaluating yellow passion fruit production and fruit quality, analyzing different genotypes grown under irrigation with water moderately saline and varying biofertilizer doses.
MATERIAL AND METHODS
The experiment was carried out in the city of Nova Floresta, Paraíba State, Brazil (60° 25' 33" S, 36° 12' 18" W, 661 m altitude), from February 2012 to March 2013. The local climate is warm and dry, with a rainy season between March and August.
Annual averages of rainfall, temperature and relative humidity are of around 800 mm, 24.5 °C and 68%,
respectively. The soil is classified as a dystrophic Yellow Latosol (Oxisol), non saline, and is found on a mildly flat relief (SANTOS et al., 2006). Table 1 expresses the soil analyzes regarding initial fertility, salinity and physical characteristics.
Table 1. Chemical and soil salinity of the experimental area.
SB = sum of exchangeable bases; CEC = cation exchange capacity; V = saturation by exchangeable bases; m= aluminum saturation; OM= organic matter; EC = electrical conductivity; ESP =Echangeable sodium percentage.
The used liquid bovine biofertilizer was obtained according to methodology proposed by Silva et al. (2007). Once it was applied in liquid form, the biofertilizer doses were composed of
fertilizer and irrigation water (RICHARDS, 1954). Concerning the applied nutrient content, in dry matter, we used the methodology suggested by EMBRAPA (2011) and the results are shown in
Chemical attributes Values Salinity attributes Values
pH (1:2,5) 5.48 pH (1:2,5) 5.51
OM (g dm-3) 9.20 EC (dS m-1) 2.60
P (mg dm-3) 64.22 Ca2++Mg2+ (mmolc L-1) 0.45
K+ (mg dm-3) 72.70 Ca2+ (mmol
c L-1) 0.21
Na+ (cmol
c dm-3) 0.39 Mg2+ (mmolc L-1) 0.24
Ca2+ (cmol
c dm-3) 1.65 Na+ (mmolc L-1) 11.77
Mg2+ (cmol
c dm-3) 1.20 K+ (mmolc L-1) 1.14
SB (cmolc dm-3) 3.43 SO42- (mmolc L-1) 1.15
H++Al3+ (cmol
c dm-3) 215 CO32- (mmolc L-1) --
Al3+ (cmolc dm -3
) -- HCO3
(mmolc L -1
) 3.33
CEC (cmolc dm -3
) 5.58 Cl- (mmolc L
-1
) 20.67
V (%) 61.00 SAR (mmol L-1)1/2 24.90
Rev. Caatinga
Table 2. After being prepared, the biofertilizer was diluted with water, performing five different doses: 0% (100% irrigation water), 10%, 20%, 30% and 40% of product with irrigation water. The doses
were applied at a constant volume of 5 L per plant. All treatments were analyzed regarding electrical conductivity (EC, at 25 ºC), pH, cation content and sodium adsorption ratio - SAR (Table 3).
Table 2. Bovine biofertilizer for irrigation and nutrient content on the dry matter.
Table 3. Electrical conductivity (EC 25 ° C), pH, cation concentration and SAR in different doses of the biofertilizer in
water.
* = Irrigation water.
Due to low calcium and high magnesium contents (Table 1), we performed liming over the entire experimental area during soil preparation. We used a calcium-rich limestone (48.16% CaO and
4.3% MgO), being incorporated at 0 - 20 cm depth to
raise exchangeable cation saturation up to 70%. Then, the area was irrigated with moderately saline water (1.40 dS m-1) (Table 3) every two days, throughout 30 days.
At 30 days after liming, furrows were opened with dimensions of 40 cm x 40 cm x 40 cm, and filled with soil within the first 20 cm, being
supplemented with 10 L of cattle manure (C/N = 18:1) and a mineral supplementation with
100 g furrow-1, using single superphosphate (20% P2O5). Thirty days after furrow preparation,
biofertilizer was provided at the above-mentioned
doses and, the next day, seedlings were transplanted. Seedlings were grown in 1 L black polyethylene bags. These bags were filled with substrate, which is composed of a mixture of soil collected from the first 20 cm of the experimental area and mineralized cattle manure at a proportion of 3:1. We sow three seeds of each genotype of yellow passion fruit evaluated. We used the hybrids BRS Gigante Amarelo (GA) and BRS Sol do Cerrado (SC) and a local selection, known as Guinezinho (LG), which was obtained from ripe fruit sampled at a commercial plantation in Nova Floresta (PB). When seedlings reached 5 cm in height (8 days after emergence stabilizing), thinning was performed to strengthen plants, at planting time (60 days after sowing). Moreover, before planting, we carried out a standardization of seedlings regarding leaf number, height, and basal stem diameter, following the
morphological patterns of each genotype.
The irrigation was applied through microsprinkling based on the reference evapotranspiration (ETo) observed on the previous
day.
Plants were spaced at 2.5 m intervals in rows and 3.0 m apart, using espaliers of flat wire number 12 for plant support, which were set on top of stakes stuck between two plants at 2.0 m height.
Mineral fertilization was made based on the above-mentioned soil analysis and crop demands,
being made with urea (45% N) and potassium chloride (60% K2O), which are traditionally used in
yellow passion fruit producing areas, complementing crop nutritional requirements. The fertilization was carried out as follows: 5 g of N in the first month; 5 g of N and 5 g of K2O in the second month; 10 g of
N and 5 g of K2O from the third to the fifth month;
10 g of N K2O from the sixth to the tenth month; and
10 g N and 15 g K2O from the eleventh to the
fifteenth month, according to the suggestion of São José et al. (2000).
We also performed control of pests, diseases and weed, as well as raising and reduction pruning as needed.
The experiment was performed in randomized block design with three replications of three plants per plot. We adopted a 3 x 5 factorial scheme, composed of three plant genotypes LG, and the two hybrids SC and GA against five bovine biofertilizer doses corresponding to 0 (100% water), 10, 20, 30 and 40% of the product, applied at a volume of 5 liters per plant monthly, in a total of 15 treatments.
Fruit harvest was made daily throughout six months (October 2012 to March 2013), when fruit
pH EC Ca
2+
Mg2+ Na+ K+ SO42- CO32- HCO3- Cl- SAR
dS m-1 --- mmolc L-1 --- (mmol L-1)1/2
7.28 15.9 19.00 28.5 68.26 47.75 13.77 0.33 17.3 126.17 14.01
N K P Ca Mg S Fe Mn Zn Cu B Mo Na Cl
--- g kg-1 --- --- mg kg-1 --- -
16.2 3 23.5 12.8 49.6 - 257 129 345.4 14.1 - - 241.26 -
DOSE
pH EC Ca
2+
Mg2+ Na+ K+ SAR
% dS m-1 --- mmolc L
-1
--- (mmol L-1)1/2
0* 3.53 1.40 1.81 3.00 8.76 0.33 5.65
10 6.13 2.85 7.63 10.24 3.85 6.86 1.29
20 6.45 4.30 11.14 15.29 5.71 9.03 1.57
30 6.87 5.75 15.22 19.98 7.77 13.69 1.85
Rev. Caatinga
were at the beginning of ripening process, with 80% fruit of yellow coloration and few fruit fallen to the ground. The harvested fruit were weekly counted and weighed for quantification of fruit number per plant, production per plant (kg plant-1), and productivity per area (t ha-1).
At peak production, we collected two fruit by plot floor area, at random, in a total of six fruits per treatment, which were packed in K boxes and taken to the Laboratory of Post Harvest from the Universidade Federal Rural do Semi-Árido
-UFERSA, in Mossoró (RN), Brazil, in order to perform the fruit quality analyzes.
The following physical variables were assessed: fruit average weight (g); peel and pulp weight (seeds + juice) in g, with the aid of an analytical balance with two decimal place accuracy; peel thickness (mm); fruit diameter and length (mm), using a 0.1 mm precision digital caliper; and pulp yield (%) (IAL, 2008). In addition, we analyzed chemical variables as soluble solid content (SS) in percentage (%), by direct reading on a 0.2 ºBrix precision hand-held refractometer; total acidity (TA)
by titration with 0.1 M NaOH solution, as proposed by Adolfo Lutz Institute (2008) expressed in g 100 M-1 of citric acid or in %; ascorbic acid (Vitamin C) by titration as proposed by Strohecker and Henning (1967), in mg 100 mL-1 of ascorbic acid; pH through a digital potentiometer; and pulp electrical conductivity (dS m-1) using a conductivimeter.
Data were submitted to variance analysis for diagnosing significant effects and mean comparison with the help of the statistical software Sisvar (FERREIRA, 2014). When significant, quantitative data interactions underwent regression adjustment by Table Curve software (JANDEL SCIENTIFIC, 1991) for each independent variable.
RESULTS AND DISCUSSION
Most of the variables showed significant interactions between genotypes and biofertilizer doses, except for peel thickness. The genotypes LG and GA obtained the largest number of fruit per plant, being of 35.15 and 34.15 fruit plant-1 at the maximum fertilizer dose (40%), linearly responding to the doses of the biofertilizer. In contrast, this variable decreased for SC with increasing doses of
the input, reaching the highest number (26.34 fruit plant-1) at 15.24% biofertilizer (Figure
1A).
Diniz (2009) noted that without the application of nitrogen and organic matter in the soil, the largest fruit production per plant was of 89.5, using a maximum dose of 46.6% biofertilizer. Yet Ataíde et al. (2012), studying the same genotypes in Serra Talhada (PE) (Brazil), obtained an amount of 26.6 and 34.0 fruit per plant for GA and SC, respectively. Rodrigues Júnior et al. (2012),
assessing ten genotypes of yellow passion fruit under weather and soil conditions of Belém (PA) (Brazil), reported values superior to 67.37 and 116.44 fruit for GA and SC, respectively.
GL and GA produced, respectively, 11.24 and 9.41 kg plant-1 for the highest dose (40%). The greatest production of SC was of 4.91 kg plant-1 for the dose of 18.85% (Figure 1B). These results were inferior to those found by Rodolfo Júnior et al.
(2009), who observed a production of 16.15 kg plant-1 in soil without biofertilizer. The
same authors reported values of 15.56 and 14.45 kg plant-1 for soils treated with regular and
supermagro biofertilizers, respectively. Ataíde et al. (2012) reported low production levels for the
genotypes GA (5.8 kg plant-1) and SC (6.6 kg plant-1).
GA and LG showed a rising productivity response throughout the experiment, achieving production doses of 14.97 t ha-1 and 12.54 t ha-1, respectively, with application of 40% biofertilizer. Yet the genotype SC had the highest productivity (6.56 t ha-1) at 14.33% (Figure 2). Regarding the annual productivity, GA and SL showed a satisfactory potential, with values of 29.94 and 25.08 t ha-1 year-, exceeding values found for SC of 13.08 t ha-1 year-1.
Conversely, Rodolfo Júnior et al. (2009) observed a yellow passion fruit productivity of 25.95 t ha-1, in the first cultivation year, for soil treated with common biofertilizer. It is known that GA has a high productive potential, with records of 30 t ha-1 (MOREIRA; TEXEIRA; SOUSA et al., 2012) and 57.71 t ha-1 (CUNHA, 2013). In this study, SC productivity (6.56 t ha-1) was lower than that found by Rodrigues Júnior et al. (2012) (22.22 t ha-1), also being below the estimates for the crop (40 t ha-1) in the first year, and from 20 to 25 t ha-1 in the second (EMBRAPA, 2008).
The biofertilizer has increased average weights of fruit (326.24 g), peel (152.87 g) and pulp (173.37g) for GA, when using a dose of 40%. The SC reached the highest average weights for fruit (227.74 g), peel (97.49 g) and pulp (130.51 g) with the estimated doses of 36.08, 33.48 and 37.43 %, respectively. Conversely, the biofertilizer had no influence on fruit mass (225.88 g) and pulp mass (135.12 g), however, the dose of 40% influenced peel mass (117.26 g) (Figures 3 A, B and C).
Our findings for fruit and pulp weights were higher than those reported by Freire et al. (2010) were; they analyzed biofertilizer use with mulching for fruit irrigated with non-saline (193.70 g) and
saline water (176.33 g). The same authors also observed a greater pulp mass for plants grown with biofertilizer and mulch (89.82 g). Ataíde et al. (2012) evaluated GA and SC genotypes, reporting fruit and
Rev. Caatinga
Figure 1. Number of fruit per plant (A) e Production (B) for different genotypes of yellow passion fruit due of biofertilizer
doses.
We found that LG had larger peel thickness (8.37 mm), followed by GA (7.53 mm) and SC (5.59 mm), as shown in Figure 4. Ataíde et al. (2012)
found values of fruit thickness of 6.5 mm and 6.1 mm for GA and SC, respectively. According to
Cavichioli et al. (2008), yellow passion fruit with thinner peel have higher pulp yield.
Fruit length and width showed an increasing trend at maximum biofertilizer rate (40%) for all genotypes, reaching 101.1, 97.7 and 106.0 mm in length and 85.6, 79.3 and 92, 8 mm in diameter for LG, GA and SC respectively (Figure 5 A, B).
These results are superior to those obtained by Diniz (2009), who found fruit 91.3 mm long at the maximum biofertilizer dose (100%) with organic matter addition to the soil. Regarding the fruit
diameter, an estimated rate of 38.1%, in soil with organic matter, provided fruits of 8.51 cm in diameter. However, Santos (2011) found lower values passion fruit in the Northwest of the State of
Rio de Janeiro, reporting lengths of 92.6 and 93.8 mm and diameters of 74.9 and 75.1 mm for GA
and SC respectively.
Rev. Caatinga
Figure 2. Productivity of yellow passion fruit genotypes in biofertilizer doses function.
We also noticed that the increase of biofertilizer doses reduced fruit pulp mass for LG, so its highest yield was 58.31% in treatment without this input. Moreover, for GA genotype, the estimated dose of 9.37% promoted a yield of 63.78% (Figure 6).
The results meet the yields of yellow passion fruit pulp required for processing and in natura consumption, which should be above 50%, as stated by Meletti et al. (2002).
Diniz (2009) obtained pulp yields of 45.4 and 46.3% at estimated maximum doses of 75.3 and 51.3% in soil with and without nitrogen, respectively. Silva et al. (2010) obtained yields of 40.61% for the GA and 40.15% for SC, being lower than those found in this study were.
Generally, soluble solid contents (SS) tended to decrease with increasing biofertilizer doses, reaching maximum values between 18 and 26% of biofertilizer. The LG reached 14.49 °Brix, while GA and SC achieved values of 13.83 and 13.72, respectively (Figure 7A).
This parameter has been used as fruit quality indicator (CAVICHIOLI et al., 2008), and the values for hybrids are within optimal range of 13 to 15 ° Brix , as described by Meletti (2011) and Borges et al. (2008) for SC and GA.
Similar results were observed by Freire et al.
(2010), in which the largest sugar concentrations were found in fruit of plants grown with good quality water and without biofertilizer addition. Diniz (2009) also reported similar results, in which increasing input doses caused a reduction of °Brix, for treatments with and without nitrogen application to the soil.
The total acidity (TA) tended to decrease with increasing input doses for hybrids, reaching its highest values in the doses of 26.85 and 16.92% for SC and GA, respectively. The highest dose gave the highest fruit acidity for LG (Figure 7B). Citric acid is largely accumulated in fruits at the very beginning of fruit formation, reaching its greatest value quickly. Nutritional conditions and, particularly, the temperature play an important role on the accumulation of this acid (CAVICHIOLI et al., 2008).
Rev. Caatinga
Rev. Caatinga
Figure 4. Peel thickness (mm) of fruit of yellow passion fruit genotypes due to biofertilizer doses.
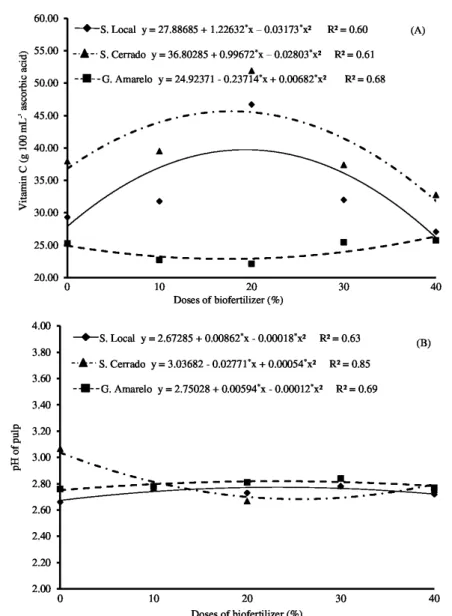
The vitamin C content of LG and SC fruits followed the same trend as soluble solids, i.e., decreased with increasing biofertilizer doses. These results corroborate findings of Dias et al. (2011), who observed vitamin decreases with soluble solid reduction. Different behavior was observed for fruit
pulp of GA, obtaining higher concentrations (26.36 mg 100 mL-1) at a dose of 40%, but less than
that achieved by LG (39.73 mg 100 mL-1) and SC (45 66 mg 100 mL-1) at the biofertilizer estimated doses of 19.32 and 17.78% (Figure 8A).
When evaluating fruit quality and harvest point of passion fruit cultivars, Santos (2011) found ascorbic acid contents of 17.31 mg 100 mL-1 and 15.20 mg 100mL-1 in ripe fruit of GA and SC respectively; such levels of vitamin C were inferior to those found in this study.
LG and GA fruit reached the highest pH values (2.77 and 2.82) at a dose of about 23% biofertilizer. The same behavior was not observed for SC, in which pH decreased with increasing doses of the input, reaching the maximum value (3.04) for treatments without biofertilizer (Figure 8B).
Silva et al. (2010) found pH values near 4.00 for fruit pulp of GA and SC. The results were lower than those found by Medeiros et al. (2009) stated that
pH may vary with environmental conditions or with plant factors; however, it is an important tool to evaluate fruit acidity. For Diniz (2009), maximum pulp pH was 3.05 and 3.08 for estimated biofertilizer doses of 50 and 42.5% in treatments with and without nitrogen application to the soil.
The electrical conductivity of LG and SC fruit pulp reached its highest values in treatments without biofertilizers, being of 4.96 and 6.47 dS m-1, respectively. This variable showed a decreasing trend with increasing input doses. The maximum dose of biofertilizer (40%) increased EC, reaching the highest value (4.81 dS m-1) in GA fruit (Figure 9). Dias et al. (2011) noted that the higher the frequency of biofertilizer applications, the greater the EC in fruit pulp, peaking at 4.89 dS m-1 with input supplied a week before and every 90 DAT.
Rev. Caatinga
Figure 5. Length (A) and fruit diameter (B) of yellow passion fruit genotypes due to biofertilizer doses.
Overall, the use of biofertilizer for water salinity mitigation favored the growth of genotypes, stimulating production and productivity, as well as contributing to fruit quality. GA and LG showed
Rev. Caatinga
Figure 6. Pulp yield (%) in fruits of passion fruit genotypes due to biofertilizer doses.
Rev. Caatinga
Figure 8. Vitamin C (A), pH (B) in fruits of passion fruit genotypes due to biofertilizer doses.
Rev. Caatinga
CONCLUSIONS
Except of SC genotype, increasing doses of bovine biofertilizer raised the number of fruits per plant, production per plant and productivity.
The decreasing orders of genotypes for fruit number per plant, average fruit weight and productivity were LG> GA> SC; GA> SC> LG; and GA> LG> SC, respectively.
Under the conditions in which this experiment was conducted, GA and LG showed superior characteristics for production and fruit quality when compared to the SC.
REFERENCES
ABREU, S. P. M. et al. Características físico-químicas de cinco genótipos de maracujazeiro
azedo cultivados no distrito federal. Revista Brasileira de Fruticultura, Jaboticabal, v. 31, n. 2,
p. 487-491, 2009.
ATAÍDE, E. M. et al. Parâmetros genéticos e características agronômicas de seis cultivares de maracujazeiro azedo no sertão pernambucano In:
CONGRESSO BRASILEIRO DE
FRUTICULTURA, 22., 2012, Bento Gonçalves.
Anais... Bento Gonçalves: SBF, 2012. p. 4784-4787.
BORGES, R. S. et al. Novas variedades: validação e transferência de tecnologia. In: FALEIRO, F. G.; JUNQUEIRA, N. T. V.; BRAGA, M. F. (Eds.).
Maracujá: germoplasma e melhoramento genético.
Planaltina: Embrapa Cerrados, 2008. v. 1, cap. 25, p.
619-640.
CAVICHIOLI, J. C.; RUGGIERO, C.; VOLPE, C. A. Caracterização física - química de frutos de
maracujazeiro - amarelo submetidos à iluminação
artificial, irrigação e sombreamento. Revista Brasileira de Fruticultura, Jaboticabal, v. 30, n. 3,
p. 649-656, 2008.
CUNHA, M. Produtividade e características de frutos de pomares de maracujá implantados com sementes originais e reaproveitadas do híbrido BRS Gigante Amarelo. 2013. 46 f. Dissertação (Mestrado em Agronomia: Área de Concentração em
Produção Sustentável) - Universidade de Brasília,
Brasília, 2013.
DIAS, N. S.; BLANCO, F. F. Efeitos dos sais no solo e na planta. In: GHEYI, H. R.; DIAS, N. S.; LACERDA, C. F. (Eds.). Manejo da salinidade na agricultura. Fortaleza: INCTSal, 2010. v. 1, cap. 9,
p. 129-141.
DIAS, T. J. et al. Qualidade química de frutos do
maracujazeiro-amarelo em solo com biofertilizante
irrigado com águas salinas. Revista Brasileira de Engenharia Agrícola e Ambiental, Campina
Grande, v. 15, n. 3, p. 229-236, 2011.
DINIZ, A. A. CAVALCANTE. L. F; REBEQUI, A. M.; NUNES, J. C. Biomassa do maracujazeiro amarelo em função da aplicação de biofertilizante e matéria orgânica no solo. Revista de Biologia e Ciência da Terra, São Cristóvão, Sup., p.1- 9, 2009.
EMBRAPA. BRS Sol do Cerrado: Híbrido de
maracujazeiro-azedo para mesa e indústria. 1. ed.
Planaltina: Embrapa Cerrados Transferência de Tecnologia. 2008. 2 p. (Folder).
EMBRAPA. Manual de métodos de análise de solos. 2. ed. rev. Rio de Janeiro: Embrapa Solos, 2011. 230 p. (Embrapa Solos. Documentos, 132).
FERREIRA, D. F. Sisvar: a Guide for its Bootstrap procedures in multiple comparisons. Ciência e Agrotecnologia, Lavras, v. 38, n. 2 , p. 109-112,
2014.
FOLEGATTI, M. I. S.; MATSUURA, F. C. A. U.
Maracujá: Pós-colheita. 1. ed. Brasília: Embrapa Informação Tecnológica, 2002. 51p. (Frutas do Brasil, 23).
FREIRE, J. L. O. et al. Atributos qualitativos do maracujá amarelo produzido com água salina, biofertilizante e cobertura morta no solo. Revista Brasileira de Ciências Agrárias, Recife, v. 5, n. 1,
p. 102-110, 2010.
INSTITUTO ADOLFO LUTZ - IAL. Normas
analíticas, métodos químicos e físicos para análises de alimentos. 4. ed., 1. ed. digital, São
Paulo, SP, 2008. 1020 p.
JANDEL SCIENTIFIC. User's manual. Califórnia, 1991. 280 p.
LACERDA, C. F. et al. Estratégias de manejo para uso de água salina na agricultura. In: GHEYI, H. R.; DIAS, N. S.; LACERDA, C. F. (Eds.). Manejo da salinidade na agricultura: estudos básicos e
aplicados. Fortaleza: INCTSal, 2010. v. 1, cap. 17, p.
303-317, 2010.
MEDEIROS, S. A. F. et al. Caracterização físico
-química de progênies de maracujá-roxo e
maracujá-azedo cultivados no Distrito Federal. Revista Brasileira de Fruticultura, Jaboticabal, v. 31, n. 2, p. 492-499, 2009.
MELETTI, L. M. M. et al. Desempenho das cultivares IAC - 273 e IAC - 277 de maracujazeiro
Rev. Caatinga
pomares comerciais. In: REUNIÃO TÉCNICA DE
PESQUISA EM MARACUJAZEIRO - AMARELO,
3., 2002. Viçosa. Anais... Viçosa: UFV/SBF, 2002. p. 166 - 167.
MOREIRA, J. M. M. A. P.; TEXEIRA, L. P.; SOUSA, T. C. R. Desempenho agronômico e análise
econômica do sistema de produção do maracujá-azedo BRS Gigante Amarelo: estudo de
caso para o Distrito Federal. In: CONGRESSO DA SOCIEDADE BRASILEIRA DE SISTEMAS DE PRODUÇÃO, 9., 2012, Brasília. Anais... Brasília: SBSP, 2012. p. 1-26.
RICHARDS, L. A. Diagnostico y rehabilitación de suelos salinos y sódicos. México: Departamento de
Agricultura de los Estados Unidos de América, 1954.
174 p. (Manual de Agricultura, 60).
RODOLFO JÚNIOR, F.; CAVALCANTE, L. F.; BURITI, E. S. Crescimento e produção do maracujazeiro - amarelo em solo com biofertilizantes
e adubação mineral com NPK. Revista Caatinga,
Mossoró, v. 22, n. 2, p. 149-160, 2009.
RODRIGUES JUNIOR, O. M. et al. Avaliação da produção em genótipos de maracujazeiro amarelo na microrregião de Belém-PA. In: SEMINÁRIO DE
INICIAÇÃO CIENTÍFICA DA EMBRAPA, 16,
2012, Belém. Anais... Belém: Embrapa Amazônia
Oriental, 2012. p. 1-4.
SANTOS, H. G. et al. Latossolos. In: SANTOS, H. G. et al. (Eds.). Sistema brasileiro de classificação de solos. Rio de Janeiro: Embrapa Solos, 2006. 2. ed.
cap. 10, p. 161-176.
SANTOS, J. L. V. Qualidade dos frutos e ponto de colheita das cultivares de maracujá: BRS Gigante Amarelo, BRS Ouro Vermelho, BRS Sol do Cerrado. 2011. 93 f. Dissertação (Mestrado em
Produção Vegetal: Área de Concentração em Produção Vegetal) - Universidade Estadual do Norte
Fluminense, Campos do Goytacazes, 2011.
SÃO JOSÉ, A. R. et al. Maracujá: Práticas de
cultivo e comercialização. 1. ed. Vitória da Conquista, BA: UESB, 2000. 316 p
SILVA, A. F. et al. Preparo e Uso de Biofertilizantes Líquidos. Petrolina: Embrapa Semi -Árido, 2007. 4 p. (Comunicado Técnico, 130).
SILVA, G. T. M. et al. Caracterização física e química de frutos de genótipos de maracujazeiro. In:
XXI CONGRESSO BRASILEIRO DE
FRUTICULTURA, 21., 2010, Natal. Anais... Natal:
SBF, 2010. p. 1-4.
STROHECKER, R.; HENNING, H. M. Analisis de vitaminas: métodos comprovados. Madrid: Paz