http://www.uem.br/acta ISSN printed: 1806-2636 ISSN on-line: 1807-8672
Doi: 10.4025/actascianimsci.v36i1.21935
Production of sheep grazing on nitrogen-fertilized tifton 85 grass in
continuous stocking
Andréia Luciane Moreira1*, Jailson Lara Fagundes2, Eidi Yoshihara1, Alfredo Acosta Backes2, Leandro Teixeira Barbosa2 and Reges Heinrichs3
1
Polo Alta Sorocabana, Agência Paulista de Tecnologia dos Agronegócios, Secretaria de Agricultura e Abastecimento, Rodovia Raposo Tavares,
km 561, Cx. Postal 298, 19015-970, Presidente Prudente, São Paulo, Brazil. 2Universidade Federal de Sergipe, São Cristóvão, Sergipe, Brazil.
3
Universidade Estadual Paulista “Júlio de Mesquita Filho”, Dracena, São Paulo, Brazil. *Author for correspondence. E-mail: [email protected]
ABSTRACT. Biomass and forage volume density and the performance and stocking rate of sheep on pastures with nitrogen-fertilized Tifton 85 and subjected to a continuous stocking system were evaluated. Four doses of nitrogen (0, 100, 200, and 400 kg ha-1 year), arranged in an experimental design with randomized blocks and four replications, were analyzed. Sixteen paddocks and Santa Inês sheep were used as test animals, coupled to crossbreed Santa Inês sheep as regulating animal stocking. Nitrogen-fertilized Tifton 85 pastures increased the amount of forage biomass and volume density which affected stocking rate and weight gain of sheep in continuous grazing. When pastures with Tifton 85 were administered in variable load continuous stocking, with grass kept at 15 cm, nitrogen fertilization up to 400 kg ha-1 year is recommended.
Keywords: animal performance, Cynodon spp., grazing, nitrogen, pasture, stocking rate.
Produção de ovinos em pastagem de capim tifton 85 adubados com nitrogênio em lotação
contínua
RESUMO. Este ensaio foi realizado com o objetivo de avaliar a biomassa e a densidade volumétrica de forragem, o desempenho e a taxa de lotação de ovinos em pastos de capim Tifton 85 adubados com nitrogênio e submetidos ao regime de lotação contínua.Foram avaliadas quatro doses de nitrogênio (0, 100, 200 e 400 kg ha-1 ano), em delineamento experimental de blocos casualizados com quatro repetições. Utilizaram-se 16 piquetes e ovinos da raça Santa Inês como animais testes e animais mestiços da raça Santa Inês como reguladores de carga animal. Os pastos de Tifton 85 adubados com nitrogênio proporcionam aumento na quantidade de biomassa de forragem e na densidade volumétrica da forragem com efeito marcante na taxa de lotação e no ganho de peso dos ovinos quando utilizado em pastejo contínuo. Quando os pastos de Tifton 85 forem manejados em lotação contínua com carga variável, mantendo-se o pasto a 15 cm, recomendam-se adubações nitrogenadas de até 400 kg ha-1 ano.
Palavras-chave: desempenho animal, Cynodon spp., pastejo, adubação nitrogenada, pastagem, taxa de lotação.
Introduction
Since pastures are highly important in most production models, it is relevant that their usage is conditioned to sustainable managements that warrant the maintenance of productivity throughout a long period of time without jeopardizing the ecosystem’s main components (NERES et al., 2012). Pasture is the main nutrient source for animals in most cattle-raising plantations, with very low productivity index chiefly due to management deficiency such as lack of supervision, pasture control and forage production (PEDREIRA et al., 2005).
Nitrogen-fertilization of pastures is a basic practice when the production of dry matter has to be
increased. Nitrogenated fertilization alters forage plants’ morphological and structural characteristics and affects the production of dry matter (FAGUNDES et al., 2006a, 2006b; PEREIRA et al., 2012). Although several studies investigated productivity increase with nitrogenated fertilization (ALEXANDRINO et al., 2004; DA CUNHA et al., 2008; FAGUNDES et al., 2005; MARTUSCELLO et al., 2005), the adequate dose of the nutrient’s application should be evaluated to maximize economically the forage plant’s production potential.
matter with high nutrition rates and animal support capacity. They are extensively disseminated in Brazil and especially recommended for sheep production.
However, there is a lack of information on tropical forage responses in animal production systems with continuous stocking in monitored nitrogen-fertilized pastures (FAGUNDES et al., 2005). Owing to the importance of the grass Tifton 85 and the need for research in pasture systems, current assay evaluates the forage’s biomass and volume density, the performance of sheep and the stocking rate in nitrogen-fertilized Tifton 85 pastures.
Material and methods
Assay was performed in Polo Alta Paulista of the Agência Paulista de Tecnologia dos Agronegócios (APTA), Secretary of Agriculture and Supply of the State of São Paulo, Adamantina, Brazil, at 21º40’S and 51º08’W, altitude 415 meters. Soil may be classified as eutrophic red-yellow argisol, moderate A, average sandy texture and wavy topography (EMBRAPA, 1999) with the following characteristics: pH (CaCl2)
= 5.2; MO (g kg-1) = 11.0; P (mg dm-3) = 16.0; K
(cmolc) = 2.3; Ca (cmolc) = 16.0; Mg (cmolc) = 8.0;
H+Al (cmolc) = 15.0; SB (cmolc) = 24.5; T (cmolc)
= 41.0 and V(%) = 63.0.
Soil analysis indicated fertilization and liming following Lima and Vilela (2005). Liming raised base saturation to 70%, whereas base fertilization was made up of 150 kg ha-1 of the formulation 3-36-18
applied to the furrow.
During the experimental period (between 1st
December 2008 and 30th April 2009), mean daily
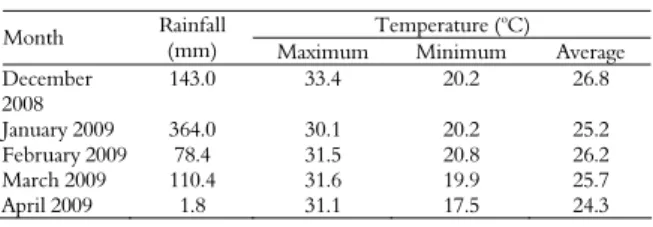
temperature ranged between 30.1 and 33.4°C and minimum temperature ranged between 17.5 and 20.8°C, with total rainfall of 697.6 mm (Table 1).
Table 1. Monthly rainfall and temperature (maximum, minimum and average) during the experimental period.
Temperature (oC)
Month Rainfall
(mm) Maximum Minimum Average
December 2008
143.0 33.4 20.2 26.8
January 2009 364.0 30.1 20.2 25.2
February 2009 78.4 31.5 20.8 26.2
March 2009 110.4 31.6 19.9 25.7
April 2009 1.8 31.1 17.5 24.3
Source: Archives of the Meteorological Office - Polo Alta Paulista/APTA (2009).
Treatments comprised four nitrogen doses, namely, control and 0, 100, 200 and 400 kg ha-1 year,
with urea as nitrogenated fertilizer, distributed in three applications on 11/30/2008, 01/05/2009 and 02/05/2009. A randomized block design with four replications was used. Experimental blocks were separated according to contour hedges in soil
management and conservation of the farm. An experimental block was installed in each contour hedge.
Experimental units consisted of 16 paddocks with areas ranging between 300 and 500 m2 and
inversely proportional to N dose applied to maintain the stocking rate uniform in all the paddocks. Thirty-two Santa Inês sheep were used as test animals and crossbreed Santa Inês were the regulators of animal load. Animals were paired according to live weight and allotted two by two to the experimental units as from 12/15/2008 for adaptation.
Cynodon spp. cv. Tifton 85 was used due to its
high production potential and to the Brazilian cattle-breeders interest in the grass species. Pasture was managed under continuous stocking at a variable rate. Mean height of pasture was kept at approximately 15 cm by placing and removing regulating animals. Pasture height was monitored weekly by 40 measures randomly applied in each parcel by a 1 cm-scaled ruler. Regulating animals were placed and removed from parcels when pasture height was respectively over or below the desired point.
Three 0.16 m2 samples per experimental unit
(parcel) from each sample were harvested to evaluate forage biomass. Harvested samples were sub-sampled and fractioned into leaves (green leaf laminas), green stems (stem + leaf shield) and dead matter (shoots and dead leaves), weighed, dried and weighed again. The mass of each component of the forage canopy was estimated from leaf, stem and dead matter in total dry mass of each sample harvested. Forage biomass per area (kg ha-1) was
subsequently estimated. Volume density of green forage (kg ha-1 cm of DM) was calculated from the
results of green forage mass (stem + live leaves) and mean height. A simulated forage grazing was undertaken at each evaluation period, plucking up by hand representative material that would be selected by the animals. It was done in the afternoon and a sample of approximately 400 g was removed from each parcel. Samples were sent to the laboratory, fractioned in leaves (green leaf laminas), green stems (stem + leaf shield) and dead matter (shoots and dead leaves), weighed and dried in a air-forced buffer at 65ºC during 72h, and weighed once again. The percentage of each component of simulated grazed pasture was estimated from leaf, stem and dead matter in total dry mass of each sample harvested.
were weighed and placed once more on the paddocks, following Carnevalli et al. (2001). Daily weight gain (DWG) for the animals’ individual performance was estimated by data on weight of animals at the beginning and end of each month. Pasture-regulating animals were monitored to control their staying time on the paddocks. The days in which regulating and test animals were kept on the paddocks were totalized at the end of the experiment and the animal stocking rate was calculated. Weight gain per area (WGA) was calculated by multiplying DWG and stocking rate. Animals were treated for helminthes every thirty days.
Five evaluations were undertaken during the experimental period, namely, December (12/1-31/08), January (01/1-31/09), February (02/1-28/09), March (03/1-31/09) and April (04/1-30/09).
The statistical model for the analysis of results was:
Y ijk = μ + Bi + Nj + Ek + NEjk + eijk,
in which:
μ = constant to all observations; Bi = effect of block (i= 1, 2, 3 and 4);
Nj = effect of nitrogen doses (j = 0, 100, 200
and 400 kg ha-2 year);
Ek = effect of evaluation period (k = December,
January, February, March and April);
NEjk = interaction between Nitrogen doses and
evaluation period; eijk = experimental error.
Data were analyzed according to measurements repeated during the period by the procedure MIXED of Statistical Analysis System (SAS) package. Results underwent analysis of variance with F test significance at 95% probability (p < 0.05). Quantitative treatments and nitrogen doses were then submitted to analysis of regression by REG (PROC REG) procedures, whereas qualitative treatments and evaluation period underwent Tukey’s test by LSMEANS (PROC MEANS) procedures. When effect of Nitrogen doses interaction and evaluation period (p < 0.05) existed, regression analysis (PROC REG) was employed in each evaluation period so that the interaction could be parceled.
Results and discussion
The management of grazing animals followed according to experimental plan. In fact, height of pasture grass was maintained between December 2008 and April 2009 with rates close to target calculated during the experimental period (Table 2). A slight oscillation in pasture height was reported over time but it did not impair data evaluation.
Table 2. Height (cm) of pastures with grass Tifton 85 on nitrogenated fertilization at different evaluation periods.
N doses December January February March April
0 14.1 13.3 12.3 14.2 13.9
100 14.7 12.7 15.3 16.0 12.9
200 14.2 14.7 16.5 16.2 14.1
400 14.9 16.3 15.8 16.3 14.4
Means 14.5 14.3 15.1 15.7 13.8
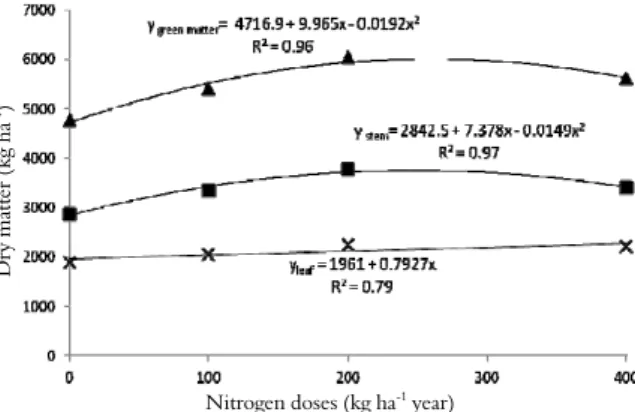
Effect of the interaction Nitrogen doses and evaluation period was not registered for available biomass variables of leaves (p = 0.1575), stem (p = 0.574), green matter (leaf + stem) (p = 0.998), volume density of green forage (p = 0.054) of Tifton 85. Available biomass of leaf (ABL), stem (ABS) and green matter (leaf + stem) (ABGM) of Tifton 85 was significantly affected by evaluation period (Table 3). Differential effect of forage mass related to the evaluation period may be attributed to environmental and nutritional changes which affect plants’ phenology by changing the number of live leaves into shoots, leaf lengthening, final length of leaf and the ratio leaf:stem (FAGUNDES et al., 2006b). ABL reported between December and April was equivalent to 41, 35, 37, 40 and 40% of ABGM which guaranteed the good stability of the grass (ALMEIDA et al., 2003). Available biomass determined intake in a system of animal production on pasture. Since DM intake determines animal production, availability of pasture biomass should be over or equal to 2,500 kg ha-1, prior to grazing. It should be observed that
ABGM rates were higher than those by Benedetti et al. (2008). They may have been the result of weight gain per animal per area.
Table 3. Available biomass of leaf (ABL), stem (ABS) and green matter (ABGM) and volume density of green forage (VDGF) in pastures with Tifton 85 with nitrogenated fertilization, significance levels and coefficients of variation (%).
December January February March April Variables
--- kg ha-1 DM --- Significance CV
ABL 2900A 2046B 2001BC 1931BC 1582C 0.001 21.3
ABS 4107A 3755AB 3342BC 2908CD 2410D 0.001 20.9
ABGM 7006A 5800B 5342B 4839BC 3993C 0.001 19.3
--- kg h-1 cm DM ---
VDGF 619A 437B 353C 307C 315C 0.001 18.7
Means followed by the same letters in the line do not differ (p > 0.05).
particular the development of early leaves, increase in the number of emergent live leaves of shoots, decrease in time interval for leaf emergence and stimulus for shoots (FAGUNDES et al., 2006b).
Dry ma
tter (kg
ha
-1)
Nitrogen doses (kg ha-1 year)
Figure 1. Available biomass of leaves, stem and green matter of grass Tifton 85 with N-fertilized grass.
There was no effect of nitrogenated fertilization on the volume density of green forage (p = 0.059) and effects were restricted to the evaluation period (Table 3). A possible explication for the non-verification of N effect on green forage density may have been the maintenance of the pasture structure at a height of 15 cm. Although N fertilization changed the biomass of leaf, stem and dead matter, it failed to provide total available green biomass since pasture-regulating animals were placed or removed from the paddocks when pasture height changed.
Volume density of mean forage Tifton 85 in the experiment was 406, ranging between 307 and 619 kg ha-1 cm DM. The above rates were similar to
those in the literature for other forage species such
as Cynodon spp., with 403 kg ha-1 cm DM
(CARNEVALLI et al., 2001) and 365 kg ha-1 cm
DM (FAGUNDES et al., 2011), but higher than those for elephant grass cv. Guaçu (Pennisetum
purpureum), with 69 kg ha-1 cm DM and for
Tanzania grass with 81 kg ha-1 cm DM (PEDREIRA
et al., 2005). There was no interaction effect between Nitrogen doses and evaluation period in the morphological composition of simulated grazing for the variables leaf (p = 0.983), stem (p = 0.951) and dead matter (p = 0.969) of Tifton 85. Likewise, there was no effect of Nitrogen doses on the composition of leaf (p = 0.925), stem (p = 0.352) and dead matter (p = 0.3329) of Tifton 85 in simulated grazing. Effects were restricted to the evaluation period (Table 4). Lowest leaf participation and the highest participation of dead matter occurred in April, related to changes in the
morphological composition of pasture and shoot density. In fact, they decreased forage accumulation rate and provided lower selection opportunity.
Table 4. Morphological composition of Tifton 85 in simulated grazing in pastures with nitrogenated fertilization.
December January February March April CV Variables
--- % --- Significance (%) Leaf 61.1bc 67.3ab 69.9a 54.5c 42.9d 0.001 12.5 Stem 37.0b 32.7bc 29.9c 38.0ab 43.3a 0.001 16.7 Dead
matter
1.93c 0.73c 0.94c 7.48b 13.73a 0.001 56.5
Means followed by the same letter in the line did not differ (p > 0.05).
As a rule, the morphological composition in simulated grazing was consistent, with high participation of leaf, followed by stem (Figure 2). The above revealed the sheep’s great selectivity in grazing management. Decrease in leaf proportion and increase in stem and dead matter in the morphological composition of simulated grazing during March and April were another relevant factor. The above data may be explained by changes in the morphological composition of pasture resulting from the plants’ phenological modifications. Changes in the pasture’s morphological composition throughout the growth season were caused by growth in the proportion stem – leaves, associated with an increase of dead matter as a consequence of the natural senescence of the forage plant and intensified by the water deficit during the evaluation period.
Morpho
logic
al
c
o
m
p
ositi
on (%
)
Month
Figure 2. Morphological composition of forage in simulated grazing in pasture with Tifton 85 during the experimental period.
by Carnevalli et al. (2001) for Tifton 85, with variation between 20 and 46.8 g sheep-1 day, and
lower rates by Fagundes et al. (2011), with variation between 71.92 and 86.15 g sheep-1 day.
Data of N effect on individual weight gain were adjusted to linear model (Figure 4). Nitrogenated fertilization increased the amount of leaves, the density of vegetative shoots, the volume density of forage, and contributed towards the highest rates in forage accumulation. Consequently, individual weight gain, stocking rate and weight gain per area were underscored.
Weigh
t gain
(g ani
m
al
-1 day
)
Period of the year
Figure 3. Individual weight gain of sheep in pasture Tifton 85 during the experimental period.
Weigh
t gain
(g ani
m
al
-1 day
)
Nitrogen doses (kg ha-1)
Figure 4. Individual weight gain of sheep in pastures Tifton 85 due to nitrogenated fertilization.
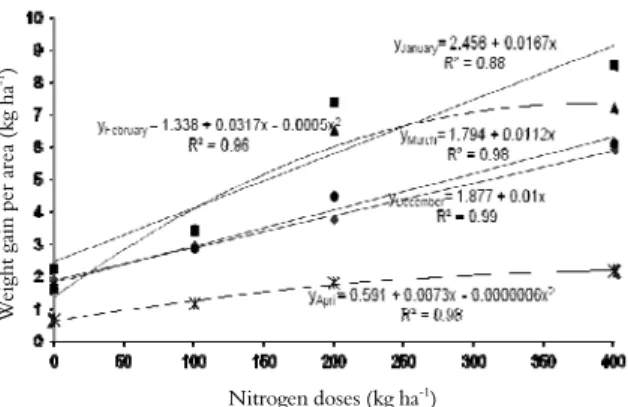
Interaction between evaluation period and N doses affected animal stocking rate (p = 0.0001; CV = 14.75) (Figure 5) and weight gain per area (p = 0.0001; CV = 34.31) (Figure 6). The above may have occurred due to alterations in morphological composition, available biomass and volume density of green forage during March and April, responsible for variations in stocking rate and weight gain per area.
Anima
l stoc
king
(she
ep ha
-1 da
y)
Nitrogen doses (kg ha-1
)
Figure 5. Animal stocking rate in pastures Tifton 85 due to nitrogenated fertilization.
Data of N effect on animal stocking rate adjusted themselves respectively to the linear model in December, January, March and April and to the quadratic model in February (p < 0.05) (Figure 5). Stocking rate and weight gain per area were similar to those by Carnevalli et al. (2001) and Fagundes et al. (2011) in pastures Tifton 85 and by Carnevalli et al. (2001) in pastures Florakirk.
Significant effect of interaction N on weight gain per area (p = 0.0185) was reported and data adjusted themselves to linear model in December, January and March and to quadratic model in February and April (p < 0.05) (Figure 6).
Differential effect between weight gains per area in treatments may have been caused by variations in the pasture’s morphological composition (Figures 1 and 2) with effects on the pasture stocking rate (Figure 5) due to differentiated behavior of nitrogenated fertilization in each evaluation period. It must be underscored that a certain quantity of animals in each experimental unit was required to keep pasture height and structure. Pasture control required a number of animals that would balance the daily accumulated forage and thus warranted forage mass that would not impair animal intake. Animal stocking rate and gain per area were high although individual performance had practically the same results.
per shoot, leaf length, final leaf length, ratio leaf:stem and population density of shoots were altered with the consequent quantity and quality modification of material available to animals (FAGUNDES et al., 2011).
Weigh
t gain p
er area
(kg h
a
-1)
Nitrogen doses (kg ha-1)
Figure 6. Weight gain per area of sheep in pastures Tifton 85 due to nitrogenated fertilization.
Acknowledgements
The authors are grateful to the Research Support Foundation of São Paulo – FAPESP for funding this research.
Conclusion
Nitrogen-fertilized Tifton 85 pastures increase the quantity of forage biomass and volume density of forage with significant effect on stocking rate and weight gain when used in continuous grazing by sheep. When Tifton 85 pastures are managed by continuous stocking with variable load and pasture kept at 15 cm, nitrogenated fertilizations up to 400 kg ha-1 year may be recommended.
References
ALEXANDRINO E.; NASCIMENTO JR., D.; MOSQUIM, P. R.; REGAZZI, A. J.; ROCHA, F. C. Características morfogênicas e estruturais na rebrotação da
Brachiaria brizantha cv. Marandu submetida a três doses de
nitrogênio. Revista Brasileira de Zootecnia, v. 33, n. 6, p. 1372-1379, 2004.
ALMEIDA, R. G.; NASCIMENTO JR., D.; EUCLIDES, V. P. B.; MACEDO, M. C. M.; FONSECA, D. M.; BRÂNCIO, P. A.; GARCEZ NETO, A. F. Disponibilidade, composição botânica e valor nutritivo da forragem de pastos consorciados, sob três taxas de lotação.
Revista Brasileira de Zootecnia, v. 32, n. 1, p. 36-46, 2003.
BENEDETTI, E.; RODRÍGUEZ, N. M.; CAMPOS, W. E.; BORGES, A. L. C. C.; SALIBA, E. S. Consumo de alimentos e produção de leite de vacas mestiças mantidas em diferentes pastagens tropicais. Ciência Animal Brasileira, v. 9, n. 3, p. 578-589, 2008.
CARNEVALLI, R. A.; DA SILVA, S. C.; FAGUNDES, J. L.; SBRISSIA, A. F.; CARVALHO, C. A. B.; PINTO, L. F. M.; PEDREIRA, C. G. S. Desempenho de ovinos e respostas de pastagens de Tifton 85 (Cynodon spp.) submetidas a regimes de desfolha sob lotação contínua.
Scientia Agricola, v. 58, n. 1, p. 7-15, 2001.
DA CUNHA, B. A. L.; ROSSIELLO, R. O. P.; CARVALHO, C. A. B.; ALMEIDA, F. Q. Dinâmica de perfilhamento do capim-coastcross (Cynodon dactylon (L.) Pers.), submetido a doses de nitrogênio e períodos de rebrotação. Boletim de Indústria Animal, v. 65, n. 2, p. 137-145, 2008.
EMBRAPA-Empresa Brasileira de Pesquisa e Agropecuaria. Sistema brasileiro de classificação de solos. Brasília: Embrapa, 1999.
FAGUNDES, J. L.; FONSECA, D. M.; GOMIDE, J. A.; NASCIMENTO JR., D.; VITOR, C. M. T.; MORAIS, R. V.; MISTURA, C.; REIS, G. C.; MARTUSCELLO, J. A. Acúmulo de forragem em pastos de Brachiaria decumbens
adubados com nitrogênio. Pesquisa Agropecuária Brasileira, v. 40, n. 4, p. 397-403, 2005.
FAGUNDES, J. L.; FONSECA, D. M.; MISTURA, C.; MORAIS, R. V.; VITOR, C. M. T.; GOMIDE, J. A.; NASCIMENTO JR., D.; CASAGRANDE, D. R.; COSTA, L. T. Características morfogênicas e estruturais do capim-braquiária em pastagem adubada com nitrogênio avaliadas nas quatro estações do ano. Revista Brasileira de Zootecnia, v. 35, n. 1, p. 21-29, 2006a.
FAGUNDES, J. L.; FONSECA, D. M.; MORAIS, R. V.; MISTURA, C.; VITOR, C. M. T.; GOMIDE, J. A.; NASCIMENTO JR., D.; SANTOS, M. E. R.; LAMBERTUCCI, D. M. Avaliação das características estruturais do capim-braquiária em pastagens adubadas com nitrogênio nas quatro estações do ano. Revista Brasileira de Zootecnia, v. 35, n. 1, p. 30-37, 2006b. FAGUNDES, J. L.; MOREIRA, A. L.; FREITAS, A. W. P.; ZONTA, A.; HENRICHS, R.; ROCHA, F. C.; BACKES, A. A.; VIEIRA, J. S. Capacidade de suporte de pastagens de capim-tifton 85 adubado com nitrogênio manejadas em lotação contínua com ovinos. Revista Brasileira de Zootecnia, v. 40, n. 12 p. 2651-2657, 2011.
LIMA, J. A.; VILELA, D. Formação e manejo de pastagem
de Cynodon.In: VILELA, D.; RESENDE, J. C.; LIMA, J.
(Org.). Cynodon: forrageiras que estão revolucionando a pecuária Brasileira. Juiz de Fora: Embrapa Gado de Leite, 2005. p. 59-77.
MARTUSCELLO, J. A.; FONSECA, D. M.; NASCIMENTO JR., D., SANTOS, P. M.; RIBEIRO JÚNIOR, J. I.; CUNHA, D. N. F. V.; MOREIRA, L. M. Características morfogênicas e estruturais do capim- xaraés submetido à adubação nitrogenada e desfolhação. Revista Brasileira de Zootecnia, v. 34, n. 5, p. 1475-1482, 2005.
singular ou em associação. Ciência Rural, v. 42, n. 5, p. 862-869, 2012.
PEDREIRA, C. G. S.; ROSSETO, F. A. A.; SILVA, S. C.; NUSSIO, L. G.; MORENO, L. S. B.; LIMA, M. L. P.; LEME, P. R. Forage yield and grazing efficiency on rotationally stocked pastures of Tanzania-1 guineagrass and ‘Guaçu’ elephantgrass. Scientia Agricola, v. 62, n. 5, p. 433-439, 2005.
PEREIRA, O. G.; ROVETTA, R.; RIBEIRO, K. G.; SANTOS, M. E. R.; FONSECA, D. M.; CECON, P. R. Crescimento do capim-tifton 85 sob doses de nitrogênio e
alturas de corte. Revista Brasileira de Zootecnia, v. 41, n. 1, p. 30-35, 2012.
Received on September 18, 2013. Accepted on November 1, 2013.