Scientia Agricola, v.60, n.3, p.565-571, Jul./Sept. 2003
TILLERING OF TIFTON 85 BERMUDAGRASS IN
RESPONSE TO NITROGEN RATES AND TIME
OF APPLICATION AFTER CUTTING
Linda Monica Premazzi1; Francisco Antonio Monteiro1*; José Eduardo Corrente2
1
USP/ESALQ - Depto. de Solos e Nutrição de Plantas, C.P. 9 - 13418-900 - Piracicaba, SP - Brasil.
2
USP/ESALQ - Depto. de Ciências Exatas. *Corresponding author <[email protected]>
ABSTRACT: Nitrogen fertilization is determinant for pasture productivity, as it results in increasing forage yield and is associated with the growth physiology of forage plants. An experiment was carried out in a greenhouse to evaluate the effects of nitrogen rates and times of application after cutting on Tifton 85 Bermuda grass (Cynodon spp.) tillering. Plants were grown in a Typic Quartzipsamment soil and nitrogen rates were 0, 80, 160 and 240 mg kg-1
of soil; times of application were immediately after and seven days after cutting. A 4 x 2 factorial experiment was set in a completely randomized block design (n= 4). Plants were evaluated in two sequential growth periods - 39 and 41 days. Nitrogen rates affected tiller density, considering the initial number of tillers in the second growth and the emerged and final number of tillers at the end of the growth periods. Tiller weight increased up to the nitrogen rate of 201 and 185 mg kg-1 of soil in the first and second growth periods, and the correlation coefficients between the final number of tillers and dry matter yields in the top part of the plant for these periods were 0.92 and 0.94, respectively. The rate of tiller development, evaluated in each of the seven-day periods, was affected by nitrogen rates and time of application. There was an effect of rates and time of application in the first and a significant interaction between rates and time in the second growth period.
Key words: Cynodon, tiller weight, tiller density, grass, fertilization
PERFILHAMENTO EM CAPIM-BERMUDA CV. TIFTON 85
EM RESPOSTA A DOSES E AO MOMENTO DE APLICAÇÃO DO
NITROGÊNIO APÓS O CORTE
RESUMO: A adubação nitrogenada é fator determinante na produtividade das pastagens, pois aumenta a produção de massa e está associada à fisiologia de crescimento das plantas forrageiras. Um experimento foi conduzido com a gramínea Tifton 85 (Cynodon spp.), em casa-de-vegetação num solo Neossolo Quartzarênico, com o objetivo de avaliar a influência de doses e momentos de aplicação de nitrogênio após o corte no perfilhamento desta planta forrageira. Foram definidas quatro doses e dois momentos de aplicação de nitrogênio após o corte, em esquema fatorial 4 x 2, no delineamento experimental de blocos completos ao acaso, com quatro repetições. As doses de nitrogênio foram de 0, 80, 160 e 240 mg kg–1 de solo e os dois momentos de aplicação de nitrogênio foram imediatamente após o corte das plantas e após sete dias. As avaliações foram conduzidas durante dois períodos de crescimentos, com as plantas atingindo 39 e 41 dias de idade. Houve efeito das doses de nitrogênio no número inicial de perfilhos no segundo crescimento, e no número de perfilhos surgidos e no número final de perfilhos nos dois períodos avaliados. O peso dos perfilhos individuais teve incrementos até as doses de nitrogênio de 201 e 185 mg kg–1
de solo, no primeiro e segundo cortes, respectivamente. Foram obtidos os coeficientes de correlação de 0,92 e 0,94 entre o número final de perfilhos e produção de massa seca da parte aérea, para o primeiro e segundo crescimentos, respectivamente. A taxa de aparecimento de perfilhos foi influenciada pelas doses e momentos de aplicação de nitrogênio após o corte, sendo estes efeitos independentes no primeiro e interativos no segundo crescimento, para cada período de avaliação.
Palavras-chave: Cynodon, peso de perfilhos, densidade de perfilhos, gramínea, adubação
INTRODUCTION
Tifton 85 Bermuda grass (Cynodon spp.) was re-leased in the United States of America in 1992, after several years of research; it is very productive and pre-sents better quality than other Bermuda grasses (Hill et al., 1996). Similarly to other forages of the genus
Scientia Agricola, v.60, n.3, p.565-571, Jul./Sept. 2003
Nitrogen exerts great impact on forage produc-tivity (Whitehead, 1995). The plant’s response to this nu-trient has been primarily measured by plant biomass yield, but it can also be evaluated through physiological growth responses, such as tillering. Nitrogen can result in an ex-pressive effect on the number and particularly on the size of tillers (Wilman & Wright, 1983).
The contribution of tillers to pasture yield can be discussed under aspects of tiller density (number of tillers per area) and tiller weight. According to the phenotypic plasticity of the grass, there is an inverse relationship be-tween tiller density and weight, referred to as compensa-tion between tiller size and density (Chapman & Lemaire, 1993). This compensation effect was observed by Sbrissia et al. (1999) in Tifton 85 Bermuda grass and by Boggiano et al. (1999) in Paspalum notatum Flugge.
Response to nitrogen related to increase on tiller density has been reported for some grass species, such as perennial ryegrass (Lolium perenne L.) by Wilman & Pearse (1984), Harris et al. (1996) and McKenzie (1998); setaria grass (Setaria anceps Stapf. Ex. Massey cv. Kazungula) by Herling et al. (1991); and Tifton 85 Ber-muda grass by Paulino et al. (1997). On the other hand, Wilman & Pearse (1984) verified an increase on tiller weight for perennial ryegrass after nitrogen application. No information could be found in the literature with regard to effects of nitrogen application times for Tifton 85 Bermuda grass after being cut or grazed. This subject has been addressed for some other forage species (Vicente-Chandler et al., 1962; Cecato et al., 1994; Silva et al., 1996), even though a consensus cannot be reached to define the most adequate moment for nitrogen fertili-zation. The objective of this work was to evaluate the ef-fect of nitrogen rates and application times after cutting on Tifton 85 Bermuda grass tillering and determine a re-lationship with yield in the top part of the forage plants.
MATERIAL AND METHODS
An experiment was carried out utilizing Tifton 85 Bermuda grass (Cynodon spp.) grown in a greenhouse. The experiment was developed as a 4 x 2 factorial ar-rangement, in which four nitrogen rates and two nitro-gen application times were evaluated (n=4), in a com-pletely randomized block design.
Nitrogen rates were 0, 80, 160 and 240 mg kg-1 of soil and the nutrient was supplied in the form of NH4NO3. The two nitrogen application times were imme-diately after cutting and seven days after cutting.
Soil utilized was a Typic Quartzipsamment, col-lected in São Pedro, SP, Brazil at 22º32’55”S, 47º54’50”W and altitude of 514 m, in an area predomi-nantly occupied by cerrado. The soil was collected at 0 to 20 cm, and shade dried and sieved. Soil analysis indicated the following: pH in CaCl2 = 3.95; P = 1.6 mg dm-3;
or-ganic matter = 15.9 g dm-3; K+ = 0.3; Ca2+ = 0.6; Mg2+ = 0.5; H+Al = 47; Al3+ = 7; sum of exchangeable bases = 1.4; CEC = 48.4 (concentrations expressed as mmolc dm-3), and V = 3%.
Correction of soil acidity was targeted at raising base saturation to 60%, as used by Palhano (1990) for
Cynodon dactylon cv. Coastcross 1. The corresponding amount of lime was determined according to Raij et al. (1987) and 2873 mg CaO plus 1025 mg MgO (corre-sponding to CaO = 410.43 mg kg-1
of soil and MgO = 146.43 mg kg-1 of soil) were incorporated to 7 kg of soil contained in a plastic bag, followed by manual agitation for five minutes. Each plastic bag containing soil was placed in a plastic pot and then deionized water was added to approximately soil field capacity. After water-ing, few pots were identified as references and weighed on that date and in the two following weeks. The mean water loss per pot, observed at weighing, was utilized to calculate water replacement for all pots.
Planting was performed 50 days after soil’s in-cubation with lime, and seven seedlings were transplanted to each pot; each seedling consisted of a single stem, with some leaf area and root system present. Seedlings were selected according to their size, and plant stand was uniformized for all pots.
Plants were cut eleven days after planting to a 4.5 cm height to ensure uniformity, because of an out-break of saprophyte fungi when all old leaves were re-moved. In the next day, all pots received fertilization, cal-culated in terms of mg kg-1
of soil at P = 100, K = 125.8 and N = 10, with the utilization of analytical reagents KH2PO4 and NH4NO3. Another uniformizing cut was per-formed twenty days later at a height of 2.5 cm and fer-tilization with nitrogen at 10 mg kg–1 of soil was carried out the following day, with the use of analytical NH4NO3. Data collection began on March 24, 1998, when plants were cut to a 2.5 cm height; at that time, nitrogen rates of 0, 80, 160 and 240 mg kg-1
of soil were applied as NH4NO3, in addition to the basic general fertilization which consisted of the following nutrients, specified by rates (mg kg-1 of soil) and analytical reagents, respec-tively: P = 100 (KH2PO4); K = 125.8 (KH2PO4); S = 8 (MgSO4); B = 0.25 (H3BO3); Cu = 1.00 (CuSO4.5H20); Zn = 1.00 (ZnSO4.7H2O); Mo = 0.10 (Na2MoO4 .H2O).
Tillers were marked with a colored wire (Davies, 1981) and tillering was evaluated from the beginning to the end of each growth period. After plants were cut, all tillers present in the pot were identified with single-col-ored rings. In the first growth period, marking occurred on the day plants were cut, and in the second period it oc-curred in the first four days of growth. Developing tillers were identified at every two days with rings of different color, coded according to the day of evaluation. Tillers aris-ing from the base or laterally (aerial) were identified with-out distinction. At cutting time all rings were removed and separated by colors, corresponding to each marking date.
Tillering was evaluated in terms of initial num-ber of tillers (corresponding to the numnum-ber of tillers present at the beginning of each growth period), number of tillers that developed (corresponding to tillers that de-veloped during each growth period), and final number of tillers (represented by the sum of initial and developed tillers). The rate of tiller formation (corresponding to the number of tillers that developed every two days) was evaluated at every seven-day interval, and a mean value was obtained for the period. The mean tiller weight (mg per tiller) was obtained by dividing dry mass yield in the aerial part for each cutting by the final number of tillers. Forage yield was evaluated in the two growth pe-riods. The first cutting was performed on May 02 , at a 2.5 cm height from the soil, and the second was done on June 13, when plants were cut at soil level. Collected material was taken to a forced-ventilation oven, and main-tained for 72 hours at 65oC. Yield data are presented in Premazzi & Monteiro (2002).
An analysis of variance was run to verify the sig-nificance of effects (P < 0.05) related to rates and nitro-gen application times on the studied variables. Tukey test (P < 0.05) was utilized for variables: initial number of developing tillers, number of tillers and final number of tillers. Effects of fertilizer rates were fitted to linear and quadratic models for the variable tiller weight. The rate of tiller formation was evaluated by Repeated Measure-ments in Time Analysis. The SAS for WINDOWS ver-sion 6.11 software package was utilized.
RESULTS AND DISCUSSION
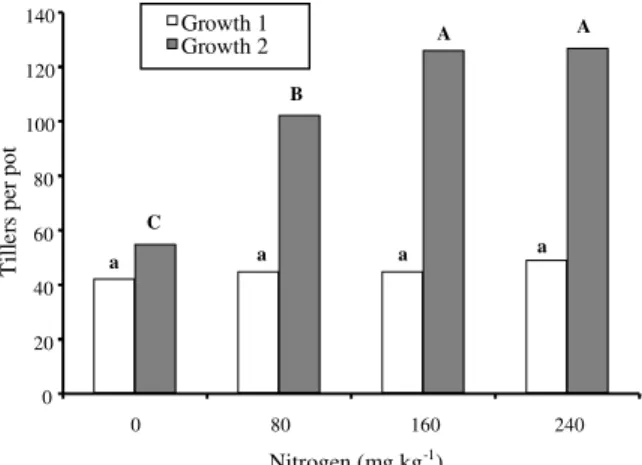
In the first growth period of Tifton 85 Bermuda grass, no nitrogen rate or time of application effect was observed (P > 0.05) on the initial number of tillers, since the rates had not yet been applied; an average of 45 tillers per pot was obtained (Figure 1). In the second growth pe-riod there was an effect (P < 0.05) of nitrogen rate on the initial number of tillers for rate zero differing from the others, and for rate 80 mg kg-1 of soil differing from rates 160 and 240 mg kg-1
of soil. This effect probably reflects the action of nitrogen fertilization on plants dur-ing the first growth period.
Nitrogen rates increased the number of tillers that developed and the final number of grass tillers (Figures 2 and 3), both in the first and second growth periods of the forage (P < 0.05).
Figure 1 - Tillering of Tifton-85 at first and second growth periods, as affected by nitrogen rate. Different letters at top of bars indicate diferences (P < 0.05) by Tukey test within each growth period.
Figure 3 - Number of new tillers and final number of tillers of Tifton-85 in the second growth period, as affected by nitrogen rate. Different letters at top of bars indicate differences (P < 0.05) by Tukey test, within each tiller class.
0 20 40 60 80 100 120 140
0 80 160 240
Nitrogen (mg kg-1)
T
ill
e
rs
pe
r pot
Growth 1 Growth 2
a
a a a
C
B
A A
Figure 2 - Number of new tillers and final number of tillers of Tifton-85 in the first growth period, as affected by nitrogen rate. Different letters at top of bars indicate differences (P < 0.05) by Tukey test, within each tiller class.
0 50 100 150 200 250
0 80 160 240
Nitrogen (mg kg-1)
T
ille
rs
pe
r pot
New tillers Final number
c B
b A
a b A
a A
0 50 100 150 200 250 300 350 400 450
0 80 160 240
Nitrogen (mg kg-1)
T
ille
rs
p
er
po
t
New tillers Final number
c C
b B
a b A
The number of developing tillers was more sen-sitive to the nitrogen supply than to the final number of tillers in the first growth (Figure 2), since the initial num-ber of tillers was similar for all rates, with differences (P < 0.05) between the non-application of the nutrient and the rates of 80, 160 and 240 mg kg-1 of soil, and between the rates of 80 and 240 mg kg-1 of soil, with regard to the number of developing tillers. With regard to the final number of tillers differences were observed (P < 0.05) between no nitrogen and the other rates. In the second growth period (Figure 3) there were differ-ences (P < 0.05) between the non-application of nitro-gen and rates of 80, 160 and 240 mg kg-1 of soil for num-ber of tillers that developed and final numnum-ber of tillers. The rate of 80 differed from the 240 mg kg-1 of soil for number of tillers that developed; the rate of 80 differed from the 160 and 240 mg kg-1 of soil rates for final num-ber of tillers. Effects of nitrogen application on tillering in Tifton 85 Bermuda grass was reported by Paulino et al. (1997), who described a linear effect of nitrogen rates 0, 50 and 150 kg ha-1 on the increase in number of tillers per pot, with 68 tillers per pot obtained at the rate of 150 kg ha-1. This maximum number of tillers is, in absolute num-bers, quite lower than the figures obtained in the present experiment.
In other forage grass genera, nitrogen application was also effective to increase tillering. Wilman & Pearse (1984), working on perennial ryegrass, utilized nitrogen rates of 0, 66 and 132 kg ha-1 and observed numbers of tillers of 844, 988 and 1076 for an area of 0.1 m2
, respec-tively. Harris et al. (1996) reported an increase in tiller density of 4072, 6295, 6673 tillers m-2 and numbers of tillers per plant of 3.37, 4.10, and 4.26 when nitrogen was applied at 0, 200 and 400 kg ha-1, respectively. In-creases in total tiller density (tillers m-2) up to the rate of 480 kg ha-1 year-1 were observed by McKenzie (1998) when nitrogen rates ranging from 120 to 720 kg ha-1 year-1 were utilized. Herling et al. (1991), in a setaria grass evaluation study, verified tillering increases beginning with the absence of nitrogen application up to rates of 80 and 160 kg ha-1; values were 11.49, 14.74 and 15.06 tillers per pot, respectively.
The final number of tillers and the number of de-veloping tillers were correlated (P < 0.05) with the ini-tial number of tillers. The coefficient of correlation val-ues were 0.40 and 0.50 for the first growth, and 0.89 and 0.94 for the second growth in the relations between ini-tial number of tillers with number of tillers that devel-oped and final number of tillers, respectively. The higher correlation values in the second growth period mean that the effect of nitrogen on tillering was associated with higher, pre-existing tiller densities.
In the second growth the number of tillers that developed and the final number of tillers were greater
than in the first growth, reflecting the fact that plant es-tablishment had already occurred. This observation, with regard to tillers, is compatible with the maximum dry mass yield values obtained for the top part, which were higher in the second cutting (Premazzi & Monteiro, 2002). There was a high correlation between dry mass yield of the top part and final number of tillers; coeffi-cients of correlation of 0.92 and 0.94 were obtained for the first and second cuttings, respectively.
Nitrogen rates which provided maximum dry mass yield of the top part were higher than those that promoted greater plant tillering. Nitrogen rate values for maximum dry mass yield on the top part for the first and second cut-tings were, respectively, 217 and 205 mg kg-1 of soil, while greatest tillering was obtained at nitrogen rates of 183 and 188 mg kg-1 of soil, and 187 and 191 mg kg-1 of soil for number of tillers that developed and final number of tillers in the first and second growth periods, respectively. The production of new tillers ceases before a balance in the production of leaf area can be attained (Matthew et al., 1999).
Mean tiller weight was influenced (P < 0.05) by nitrogen rates. This effect was represented by a quadratic regression model, both in the first and second cuttings (Fig-ure 4). Wilman & Pearse (1984) also observed effects of nitrogen application on tiller weight in perennial ryegrass when submitted to rates of 0, 66 and 132 kg ha-1, with val-ues of 0.8, 4.3 and 7.9 mg per tiller, respectively.
The mean tiller weight for Tifton 85 Bermuda grass in the first cutting was higher, probably because of a smaller final number of tillers in each experimental unit, while in the second cutting the greater tillering determined a smaller mean tiller weight. Pinto et al. (1994) also veri-fied a negative response in tiller weight for setaria grass, when the highest nitrogen rate (between rates ranging from 15 to 90 mg kg-1
of soil) was utilized; they explained that a greater number of growing tillers, which compete among themselves for assimilates produced by the plant, results in smaller individual tiller weight.
Figure 4 - Weight of tillers of Tifton-85 in the first and second cutting, as affected by nitrogen rates.
0 50 100 150 200 250
0 80 160 240
Nitrogen (mg kg-1)
A
v
er
ag
e w
eig
h
t o
f
till
er
s
(m
g
p
er
til
le
r) 1st Cut
Y=42.8+1.78X-0.004X2 (R2 = 0.95)
C.V.=10.4%
2nd Cut
Y=37.8+1.00X-0.003X2 (R2 = 0.89)
Scientia Agricola, v.60, n.3, p.565-571, Jul./Sept. 2003
The maximum estimated values for mean tiller weight of 217 and 128 mg per tiller were verified at nitro-gen rates of 200 and 185 mg kg-1 of soil, for the first and second cuttings, respectively. These rates were higher than rates that provided maximum tiller density in the first cut-ting (183 and 188 mg kg-1 of soil) but similar in the sec-ond cutting (187 and 191 mg kg-1 of soil). This provides an example that when plants attain their maximum tillering potential, the contribution of tillers towards dry mass yield in the top part is translated into tiller weight.
The phenotypic plasticity explains the inverse re-lationship between tiller density and weight (Chapman & Lemaire, 1993). This has been demonstrated by Sbrissia et al. (1999) for Tifton 85 Bermuda grass and by Boggiano et al. (1999) for Paspalum notatum; it can also be identified in the relationship tiller weight and density in the first cutting, as increasingly higher nitrogen rates were utilized.
There was an effect (P < 0.05) of rates and times of application of nitrogen after cutting on the rate of tiller formation, evaluated at every seven-day period. Wilman & Pearse (1984) reported increases of 0.05, 0.27, and 0.38 in the numbers of new perennial ryegrass tillers emerg-ing per tiller per week, as a function of increments in ni-trogen rates from 0 to 66 and to 132 kg ha-1.
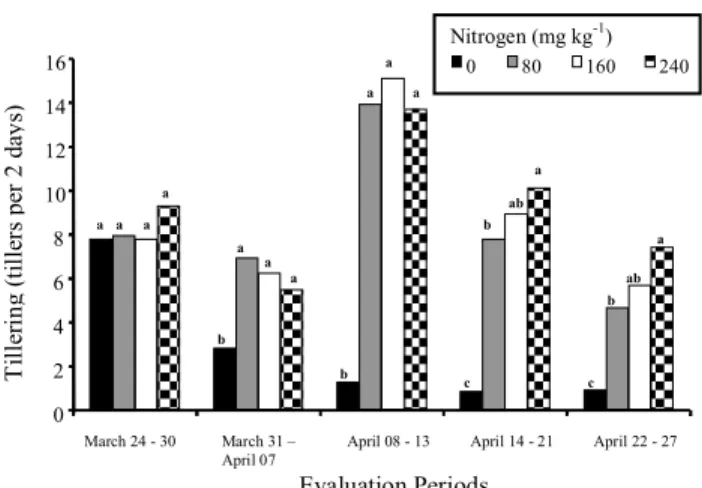
In the first growth period (Figure 5) there was an effect (P < 0.05) of nitrogen rates in the second, third, fourth and fifth evaluation periods. No effect of nitrogen rates could be verified in the first evaluation period, even though plants that received nitrogen immediately after cutting showed greater tillering rate during that period, as can be seen in Figure 6.
In the second and third periods a difference (P < 0.05) was verified between the absence of nitrogen application and the other rates, which were similar among themselves. In the fourth and fifth periods a difference (P < 0.05) was detected between the absence of nitro-gen application and the other rates, with rate 80 differ-ing from rate 240 mg kg-1 of soil. The rate of tiller for-mation in the third evaluation period, when nitrogen was supplied, was higher than in the other periods, decreas-ing progressively from then on. This decrease was more intense when smaller nitrogen rates were utilized. This could be related to plant shading, translated by an in-crease in Leaf Area Index (LAI), which occurred for all nitrogen rates, beginning in the third evaluation period. Such effect of time on plant growth is similar to what oc-curs when nitrogen is applied, as described by Simon & Lemaire (1987) for Italian ryegrass (Lolium multiflorum
Lam. cv. Tiara), when an increase in number of tillers per plant was observed only at the initial growth stage. Ef-fects practically disappeared as LAI increased. As the leaf area in the canopy accumulates, the proportion of light decreases with regard to its wavelength from red to far
red, which promotes the release of new buds and the pro-duction of new tillers (Matthew et al., 1999).
In the first growth, effect of nitrogen application times after cutting was also observed (Figure 6). In the initial stage of evaluation (two first periods) that nitro-gen application was superior right after cutting relative to the seven subsequent days. Fertilization performed at cutting brought about the immediate availability of nitro-gen, which promoted greater tillering. Nabinger (1998) emphasized the importance of immediate nitrogen avail-ability at cutting time, when the objective is to maximize tiller density and quickly attain optimal LAI. Even being of inferior quality, tillering that was observed at the be-ginning of plant growth, when nitrogen was applied seven days after cutting, was attributed to an intrinsic regrowth
Figure 5 - Tillering of Tifton-85 in the first growth period as affected by time of evaluation and nitrogen rates. Different letters indicate differences among means by Tukey test (P < 0.05), within each evaluation period.
Figure 6 - Tillering of Tifton-85 in the first growth period as affected by time of evaluation and lag time of nitrogen fertilization after cutting. Different letters indicate differences among means by Tukey test (P < 0.05), within each evaluation period.
0 2 4 6 8 10 12 14
March 24 - 30 March 31 –
April 07 April 08 - 13 April 14 - 21 April 22 - 27
Evaluation periods
T
il
ler
in
g
(t
il
le
rs
p
er
2
da
ys
)
N at cutting N 7 day after cutting
a
b
a a
b a
a
a a
b
0 2 4 6 8 10 12 14 16
March 24 - 30 March 31 – April 07
April 08 - 13 April 14 - 21 April 22 - 27
Evaluation Periods
T
ille
rin
g
(
ti
lle
rs
p
er
2 da
y
s)
0 80 160 240
a a
a a
a a
a
b a a a
b
ab b
c a
ab b
c a
Scientia Agricola, v.60, n.3, p.565-571, Jul./Sept. 2003
mechanism of the plant, that can be stimulated by nitro-gen present in storage structures (Ourry et al., 1988). The application of nitrogen seven days after cutting promoted tillering only on the fourth evaluation period. Similarly to what was observed in Figure 5, the effect of nitrogen was manifested at greater magnitude not at the initial growth stage, but at the intermediate stage, becoming less effective from that point forth.
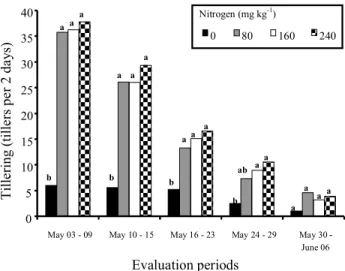
In the second growth period an interactive effect was observed between nitrogen rates and application times after cutting for rate of tiller formation (Figures 7 and 8). This rate achieved greater values in the second growth relative to the first, since in the second growth plants were already established, with a greater number of existing tillers (Figure 1), from which new tillers can
de-velop (Langer, 1963). During that stage a greater amount of nitrogen might be available, as residual nitrogen from the first growth.
In the first evaluation period, tillering rate was slightly higher when nitrogen was applied immediately after cutting, relatively to nitrogen applied seven days later, probably because the date of fertilizer application was closer to the evaluation date, with a more effective action of this nutrient on plant growth (Figures 7 and 8). Once again, considering the first evaluation period and application at cutting time, a significant effect was only observed between no-application of nitrogen and the other nitrogen rates, which could be attributed to the length of the marking period for initial tillers (four days), prevent-ing differences between nitrogen rates of 80, 160 and 240 mg kg-1 of soil from being identified. Differences between nitrogen rates of 80 and 160 mg kg1 of soil, detected in the first and second evaluation periods, when applied seven days after cutting, could be attributed to the residual effect of nitrogen application in the first growth.
The absence of differences between nitrogen rates of 80, 160 and 240 mg kg-1 of soil when nitrogen was applied immediately after cutting and in the third, fourth and fifth evaluations, when nitrogen was applied seven days later, in association with the decreasing model in the rate of tiller formation with time, for both nitrogen ap-plication times, suggests that a shading effect occurred on the plants, reducing tillering (Corsi & Nascimento Jr., 1986). This decreasing model can be explained by the season progress until fall, which is less favorable for growth of tropical grass than summer.
CONCLUSIONS
Nitrogen increased tiller density up to the inter-val between 160 and 240 mg kg-1 of soil, and tiller mean weight was increased up to 185 and 200 mg kg-1
of soil. Positive effects of nitrogen rates on the rate of tiller for-mation are predominant when evaluated at every two days, with isolated or interactive effects with time of ap-plication after cutting, as a function of regrowth age of Tifton 85 grass.
ACKNOWLEDGEMENTS
To the Agronomists Israel Benetti and Pelerson F. Schiavuzzo for invaluable help while the experiment was being conducted. To CAPES and CNPq for the pro-vided scholarships.
REFERENCES
ALVIM, J.A; BOTREL, M.A; MARTINS, C.E.; CÓSER, A.C.; RESENDE, H; VILELA, D. Efeito de doses de nitrogênio e de intervalos entre cortes sobre a produção de matéria seca e teor de proteína bruta do Tifton 85. In: REUNIÃO DA SOCIEDADE BRASILEIRA DE ZOOTECNIA, 35., Botucatu, 1998. Anais. Botucatu: SBZ, 1998. p.492-494.
0
5 10 15 20 25 30 35 40
May 03 - 09 May 10 - 15 May 16 - 23 May 24 - 29 May 30 -June 06
Evaluation periods
Tille
rin
g
(tille
rs
p
e
r 2
d
a
y
s)
0 80 160 240
a a a
a ab
b a a a
b a
a a
b a a a
b
a a Nitrogen (mg kg-1)
Figure 7 - Tillering of Tifton-85 in the second growth period as affected by times of evaluation and nitrogen rates applied at cutting. Different letters indicate differences among means by Tukey test (P < 0.05), within each evaluation period.
0 5 10 15 20 25 30 35
May 03 - 09 May 10 - 15 May 16 - 23 May 24 - 29 May 30 -June 06
Evaluation periods
T
ill
eri
n
g
(
till
ers
p
er
2 da
y
s) 0 80 160 240
c a aa
a a a
ab
b a a a
b ab a
b
c a
b
a Nitrogen (mg kg-1)
Scientia Agricola, v.60, n.3, p.565-571, Jul./Sept. 2003
Received December 18, 2001 Accepted April 16, 2003 BOGGIANO, P.; MARASCHIN, G.; NABINGER, C.; RIBOLDI, J.;
CADENAZZI, M.; ROSA, L.M. Effect of the herbage allowance and nitrogen fertilization on tiller density and weight of Paspalum notatum
Flügge in a natural pasture in Rio Grande do Sul. In: INTERNATIONAL SYMPOSIUM ON GRASSLAND ECOPHYSIOLOGY AND GRAZING ECOLOGY, Curitiba, 1999. Curitiba: UFPR, 1999. p.391-394.
CECATO, U.; FAVORETTO, V.; MALHEIROS, E.B. Freqüências de corte, níveis e formas de aplicação de nitrogênio sobre as características da rebrota do capim-Aruana (Panicum maximum Jacq cv. ARUANA).
Revista UNIMAR, v.16, p.263-276, 1994.
CHAPMAN, D.F.; LEMAIRE, G. Morphogenetic and structural determinants of plant regrowth after defoliation. In: INTERNATIONAL GRASSLAND CONGRESS, 17., Palmerston North, 1993. Proceedings. Palmerston North: Tropical Grassland,1993. p.95-104.
CORSI, M.; NASCIMENTO JR., D. Princípios de fisiologia e morfologia de plantas forrageiras aplicados no manejo das pastagens. In: PEIXOTO, A.M.; MOURA, J.C.de; FARIA, V.P.de (Ed.) Pastagens: fundamentos da exploração racional. Piracicaba: FEALQ, 1986. p.11-37.
DAVIES, A. Tissue turnover in the sward. In: HOGDSON, J.; BAKER, R.D.; DAVIES, A.; LAIDLAW, A.S.; LEAVER, J.D. (Ed.) Sward
measurement handbook. Hurley: The British Grassland Society, 1981.
p.197-209.
GOMES, L.H.; CECATO, U.; ÍTAVO, C.V.; MEDRONI, S. Avaliação de cultivares do gênero Cynodon sob dois níveis de adubação nitrogenada. In: REUNIÃO DA SOCIEDADE BRASILEIRA DE ZOOTECNIA, 34., Juiz de Fora, 1997. Anais. Juiz de Fora: SBZ,1997. p.33-35. HARRIS, S.L.; THOM, E.R.; CLARK, D.A. Effect of high rates of nitrogen
fertilizer on perennial ryegrass growth and morphology in grazed dairy pasture in northern New Zealand. New Zealand Journal of Agricultural
Research, v.39, p.159-169, 1996.
HERLING, V.R.; ZANETTI, M.A.; GOMIDE, C.A; LIMA, C.G de. Influência de níveis de adubações nitrogenadas e potássica e estádios de crescimento sobre o capim-setária (Setária anceps Stapf Ex. Massey cv. Kazungula). 1. Produção de matéria seca e fisiologia de perfilhamento.
Revista da Sociedade Brasileira de Zootecnia, v.20, p.561-571, 1991.
HILL, G.M.; GATES, R.N.; WEST, J.W.; BURTON, G.W.; Tifton bermudagrass utilization in beef, dairy, and hay production. In: WORKSHOP SOBRE O POTENCIAL FORRAGEIRO DO GENERO
CYNODON, Juiz de Fora, 1996. Anais. Juiz de Fora: EMBRAPA, CNPGL, 1996. p.139-150.
LANGER, R.H.M. Tillering in herbage grasses. Herbage Abstracts, v.33, p.141-148, 1963.
MATTHEW, C.; ASSUERO, S.G.; BLACK, C.K.; SACKVILLE HAMILTON, N.R. Tiller dynamics of grazed swards. In: INTERNATIONAL SYMPOSIUM ON GRASSLAND ECOPHYSIOLOGY AND GRAZING ECOLOGY, Curitiba, 1999. Curitiba: UFPR, 1999. p.109-133.
MARTIM, R. A. Doses de nitrogênio e de potássio para produção, composição e digestibilidade dos capins Coastcross e de Tifton 85 em um Latossolo Vermelho-Amarelo. Piracicaba: USP/ESALQ, 1997. 109p. (Dissertação - Mestrado)
McKENZIE, F.R. Influence of applied nitrogen on vegetative, reproductive, and aerial tiller densities in Lolium perenne L. during the establishment year. Australian Journal of Agricultural Research, v.49, p.707-711, 1998.
NABINGER, C. Eficiência do uso de pastagens: disponibilidade e perdas de forragem. In: SIMPÓSIO SOBRE MANEJO DA PASTAGEM, 14., Piracicaba, 1997. Anais. Piracicaba: FEALQ, 1998. p.213-251. OURRY, A.; BOUCAUD, J.; SALETTE, J. Nitrogen mobilization from
stubble and roots during re-growth of defoliated perennial ryegrass.
Journal of Experimental Botany, v.39, p.803-809, 1988.
PALHANO, A.L. Recrutamento de nutrientes e valor nutritivo de Cynodon dactylon (L.) Pers. cv. Coastcross no 1. Piracicaba: USP/ESALQ, 1990.
122p. (Dissertação - Mestrado)
PAULINO, V.T.; GERDES, I.; CARVALHO, D.D.; LUCENA, M.A.C.; AMARO, F.R.; FERREIRA, T.A. Fontes e doses de nitrogênio na produção, teor de proteína bruta e perfilhamento do capim Tifton 85 (Cynodon spp.). In: REUNIÃO DA SOCIEDADE BRASILEIRA DE ZOOTECNIA, 34., Juiz de Fora, 1997. Anais. Juiz de Fora: SBZ, 1997. p.142-144.
PEDREIRA, C.G.S.; MELLO, A.C.L. de. Cynodon spp. In: SIMPÓSIO SOBRE MANEJO DA PASTAGEM, 17., 2000, Piracicaba. Anais.
Piracicaba: FEALQ, 2000, p.109-133.
PINTO, J.C.; GOMIDE, J.A.; MAESTRI, M. Produção de matéria seca e relação folha/caule de gramíneas forrageiras tropicais, cultivadas em vasos, com duas doses de nitrogênio. Revista da Sociedade Brasileira
de Zootecnia, v.23, p.313-326, 1994.
PREMAZZI, L.M.; MONTEIRO, F.A. Produção do capim-Tifton 85 submetido a doses e épocas de aplicação de nitrogênio após o corte.
Boletim de Indústria Animal, v.59, p.1-16, 2002.
RAIJ, B. van; QUAGGIO, J.A.; CANTARELLA, H.; FERREIRA, M.E.; LOPES, A.S.; BATAGLIA, O.C. Análise química do solo para fins de
fertilidade. Campinas: Fundação Cargill, 1987. 170p.
SBRISSIA, A.F.; SILVA, S.C.da; MATTHEW, C.; PEDREIRA, C.G.S.; CARVALHO, C.A.B.; CARNEVALLI, R.A.; FAGUNDES, J.L.; PINTO, L.F.M.; CORTUCCI, M.; RODRIGUES, E.R. Tiller size/density compensation in grazed swards of Cynodon spp. In: INTERNATIONAL SYMPOSIUM ON GRASSLAND ECOPHYSIOLOGY AND GRAZING ECOLOGY, Curitiba, 1999. Curitiba: UFPR, 1999. p.348-352.
SILVA, S.C.da; CORSI, M.; FARIA, V.P.de. Correção do solo e adubação de pastagens de capim-elefante. In: PEIXOTO, A.M.; MOURA, J.C.de; FARIA, V.P.de (Ed.) Pastagens de capim elefante: utilização intensiva. Piracicaba: FEALQ, 1996. p.29-49. (Biblioteca de Zootecnia, 3). SIMON, J.C.; LEMAIRE, G. Tillering and leaf area index in grasses in the
vegetative phase. Grass and Forage Science, v.42, p.373-380, 1987. VINCENTE-CHANDLER, J.; SILVA, S.; FIGARELLA, J. Effect of
frequency of application on response of guinea grass to nitrogen fertilization. The Journal of Agriculture of the University of Puerto Rico, v.46, p.342-349, 1962.
WHITEHEAD, D.C. Grassland nitrogen. Wallingford: CAB International, 1995. 397p.
WILMAN, D.; PEARSE, P.J. Effects of applied nitrogen on grass yield, nitrogen content, tillers and leaves in field swards. Journal of
Agricultural Science, v.103, p.201-211, 1984.
WILMAN, D.; WRIGHT, P.T. Some effects of applied nitrogen on the growth and chemical composition of temperate grasses. Herbage Abstracts, v.53, p.387-393, 1983.