Eucalyptus urophylla S. T. Blake
Thais Galhardo Godoy1, Sebastião Carlos da Silva Rosado2 (received: March 10, 2010; accepted: April 28, 2011)
ABSTRACT: The objective of this study is to select superior genotypes for effi ciency of phosphorus use in seedlings of Eucalyptus urophylla, correlating them with initial height growth in the fi eld, at age eight months. A completely randomized block design was used in the nursery, consisting of eight clones, three replicates and four plants per plot. The same design was used in the fi eld, consisting of eight clones, four replicate blocks and nine plants per plot. Data being collected in the nursery at age 120 days included: phosphorus concentration in shoot (CPPA); phosphorus concentration in root (CPR); phosphorus content in shoot (CtPPA); phosphorus content in root (CtPR); total phosphorus content in seedling (CtPT); phosphorus use effi ciency in shoot (EUP-PA); phosphorus use effi ciency in root (EUP-R) and total phosphorus use effi ciency (EUP-T). Analyses of variance showed signifi cant genetic differences among clones for all traits and, given the high heritability values found, estimated genetic gains were generically very high. As regards predicted indirect genetic gain, it was noted that selection on nursery seedlings for all EUPs provided the highest values of indirect gain in height of fi eld seedlings.
Key words: Initial growth of seedlings, phosphorus use effi ciency, genetics.
EFICIÊNCIA DE UTILIZAÇÃO DE FÓSFORO EM PLANTAS JOVENS DE Eucalyptus urophylla S. T. Blake
RESUMO: Objetivou-se, com este trabalho, a seleção de genótipos superiores para a efi ciência de utilização de fósforo em mudas de Eucalyptus urophylla, correlacionando-as com o crescimento inicial em altura no campo, aos oito meses de idade. O delineamento usado no viveiro foi o de blocos inteiramente casualizados, com oito clones, três repetições e quatro plantas por parcela. O delineamento utilizado no campo também foi de blocos inteiramente casualizados, com oito clones, quatro blocos e nove plantas por parcela. Os dados coletados no viveiro aos 120 dias de idade foram: concentração de fósforo na parte aérea (CPPA); concentração de fósforo na raiz (CPR); conteúdo de fósforo na parte aérea (CtPPA); conteúdo de fósforo na raiz (CtPR); conteúdo de fósforo total na muda (CtPT); efi ciência de utilização do fósforo na parte aérea (EUP-PA); efi ciência de utilização de fósforo na raiz (EUP-R) e efi ciência de utilização do fósforo total (EUP-T). As análises de variância mostraram que existem diferenças genéticas signifi cativas entre clones para todas as características e, tendo em vista os altos valores de herdabilidade encontrados, os ganhos genéticos estimados foram de grande magnitude. No estudo de previsão de ganho genético indireto, verifi cou-se que a seleção, em mudas no viveiro, para todas as EUP propiciou os maiores valores de ganho indireto em altura das mudas no campo.
Palavras-chave: Crescimento inicial de mudas, efi ciência de uso de fósforo, genética.
1Forest Engineer – Departamento de Ciências Florestais – Universidade Federal de Lavras/UFLA – Cx. P. 3037 – 37200-000 – Lavras, MG, Brasil – [email protected]
2Forest Engineer, Professor PhD in Forest Improvement – Departamento de Ciências Florestais – Universidade Federal de Lavras/UFLA – Cx. P. 3037 – 37200-000 – Lavras, MG, Brasil – [email protected]fl a.br
1 INTRODUCTION
Species of genus Eucalyptus play an important part in the Brazilian social, economic and environmental scene. Up until 2007, an estimated 3,771,867 ha in area was reforested with Eucalyptus (ASSOCIAÇÃO BRASILEIRA DE PRODUTORES DE FLORESTAS PLANTADAS - ABRAF, 2008), expected to produce enough timber to cater for the Brazilian industrial sector, in particularly cellulose pulp production and charcoal-fuelled steel metallurgy.
From a nutritional standpoint, a superior species and/or genotype is one that is capable of developing and producing good yields under unfavorable fertility conditions, and having the ability to absorb the required
nutrients in smaller quantities and/or distribute them more effi ciently to various plant components, without affecting productivity (FURLANI et al., 1984).
Species with an enhanced ability to absorb and/or use nutrients would be more desirable. This is so because not only would they make better use of the nutrients being supplied via fertilization, but smaller amounts of nutrients should suffi ce (LUCA, 1997), resulting in greater biomass yield, which is an important characteristic for successful growth and improved productivity where soils are low in P levels (MACHADO, 2000).
environmental parameters, as well as heritability, direct and indirect genetic gains, correlating them to young plants in the fi eld at age eight months.
2 MATERIAL AND METHODS
Clonal seedlings were used in this experiment, as produced by the minicutting technique (vegetative propagation) in the forest nursery of Carvovale Ltda. The nursery is located in the municipality of Taiobeiras, in Vale do Jequitinhonha region, at coordinates 42º14’10” west longitude and 15º48’30” south latitude. According to Köppen classifi cation, the predominant local climate is dry, continental, with average annual precipitation less than 1,000 mm and average maximum temperature around 34ºC (COMPANHIA DE PESQUISA DE RECURSOS MINERAIS - CPRM, 2004).
Seedlings were produced in tubes with a volume capacity of 50 cm3 and stored in plastic trays containing 96 cells, suspended 80 cm above ground level. The substrate used consisted of 40% vermiculite, 30% scorched rice husk, 10% coconut fi ber, 20% slash pine bark and needles, at a pH of 5.5.
In the nursery, eight clones were assessed using a completely randomized block design, with three replicates and four plants per plot. In the fi eld, the same design was used consisting of eight clones with four replicates and nine plants per plot, at age eight months, arranged at 3 x 2 m spacing. According to Tomé (2002), in order to obtain more precise estimates of treatment means or selection gain, models with a random progeny effect are more suitable. This is so because the effects of progenies are better represented by random effects, since the usual assumption in quantitative genetics is that genetic values related to a genotype result from the sum of small effects of individual contributions from a large number of Mendelian segregating genes for trait manifestation.
At age 120 days, the root portion of each seedling was washed carefully, trying to preserve roots as much as possible. The vegetal materials were placed in labeled paper bags and taken to a forced air oven at 70ºC, to a constant weight. They were then ground using a stainless steel Wiley mill and submitted to the Laboratory of Leaf Analysis of the Departamento de Ciência do Solo of the Universidade Federal de Lavras (UFLA) where, using a nitric-perchloric mixture, P concentrations were determined in the shoot and root portions, by colorimetry (ASSOCIATION OF OFFICIAL ANALYTICAL CHEMISTS - AOAC, 1975).
The following data were collected: height of fi eld seedlings after eight months (Hc); phosphorus concentration in shoot (CPPA); phosphorus concentration in root (CPR); P content in shoot (CtPPA); P content in root (CtPR); total P content in seedling (CtPT); phosphorus use effi ciency in shoot (EUP-PA); phosphorus use effi ciency in root (EUP-R); total phosphorus use effi ciency (EUP-T). Effi ciencies were calculated on the basis of the following methodologies: Siddiqui and Glass (1981) and Swiader et al. (1994).
Data were submitted to analysis of variance, following program procedures in GENES (CRUZ, 2001). The statistical model used was:
ij
Y = μ + g i +bj + εji
where: Yij is the mean value observed in the ith genotype of the jth block; μ is grand mean; g
i is effect of the i
th genotype (random effect); bj is effect of the jth block (random effect); εji is experimental error.
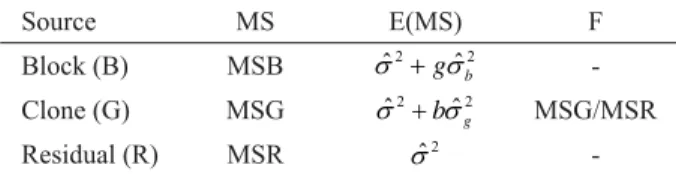
The analysis of variance summary and expected mean square values for estimates of phenotypic, genotypic and environmental parameters are provided in Table 1. Table 1 – Analysis of variance summary and expected mean square values for phenotypic, genotypic and environmental parameters.
Tabela 1 – Esquema da análise de variância e estimativa das esperanças dos quadrados médios para os parâmetros fenotípicos, genotípicos e ambientais.
Source MS E(MS) F
Block (B) MSB
-Clone (G) MSG MSG/MSR
Residual (R) MSR
-2
ˆ
σ : residual variance; σˆ2g: genotypic variance; σˆb2: variance between blocks; g: number of genotypes; b: number of blocks.
Estimates of variance components, values of heritability and coeffi cients of variation were derived according to expressions described by Cruz and Carneiro (2003).
Gains were predicted by selecting one in four clones being assessed (25% selection), normalizing selection intensity at 1.400 (COTTERIL; DEAN, 1990).
3 RESULTS AND DISCUSSION
From Table 2 data, signifi cant differences are noted among clones, by the F test (p≤0.01), for initial height
2 2
ˆ gˆb
σ + σ
2 2
ˆ bˆg
σ + σ
2
ˆ
growth in the fi eld, P concentration, P content and P use effi ciency. This indicates the possibility of selecting clones with higher fi eld yielding potential, particularly under conditions of P defi ciency.
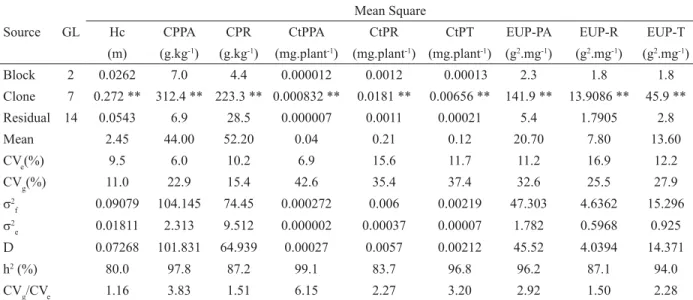
These traits had mean values of 2.45m (Hc); 44.0g. kg-1 (CPPA); 52.2g.kg-1 (CPR); 0.04mg.plant-1(CtPPA); 0.21mg.plant-1 (CtPR); 0.12mg.plant-1 (CtPT); 20.7g2. mg-1 (EUP-PA); 7.8g2.mg-1 (EUP-R) and 13.6g2.mg-1 (EUP-T). The experimental coefficients of variation (CVe) ranged from 6.0% (CPPA) to 16.98% (EUP-R). According to Gomes et al. (2002), low CVe values indicate good experimental precision, particularly in terms of environmental control and data collection.
In these nutritional traits, CVg values ranged from 15.4% (CPR) to 42.6% (CtPPA). Now, considering these genotypic and environmental coeffi cients of variation, the following CVg/CVe ratios are provided: 1.16 (Hc), 3.83 (CPPA), 1.51 (CPR), 6.15 (CtPPA), 2.27 (CtPR), 3.20 (CtPT), 2.92 (EUP-PA), 1.50 (EUP-R) and 2.28 (EUP-T). According to Vencovsky and Barriga (1992), successful selection is guaranteed if the above ratio is 1.0 or more. Therefore, the obtained results indicate the possibility of
success for all growth traits being assessed, particularly P content in the shoot portion (CtPPA).
According to the above table, heritability (h2) had percentage values of 80.0 (Hc), 97.8 (CPPA), 87.2 (CPR), 99.1 (CtPPA), 83.7 (CtPR), 96.8 (CtPT), 96.2 (EUP-PA), 87.1 (EUP-R) and 94.0 (EUP-T). From these high h2 coeffi cients and the high CVg/CVe ratios, relatively high gains can be predicted for the traits being assessed.
Table 3 provides predicted genetic gains to be attained from direct selection for initial height growth in the fi eld, as assessed eight months after planting (Hc), and for P nutritional traits, as well as indirect gains in Hc with selection for nutritional traits CPPA, CPR, CtPPA, CtPR, CtPT, EUP-PA, EUP-R and EUP-T.
In forest improvement programs, correlations are used to assist with selection involving two traits simultaneously, in other words, selection on one trait may have refl ections, positive or negative, on another. Where refl ections are positive, gains are directly obtained in the selected trait and indirect gains are obtained in the correlated trait. However, for this to happen, it is necessary that the genotypic correlation among the traits of interest be relatively high. Table 2 – Analysis of variance summary and estimate of genetic, phenotypic and environmental parameters for nutritional characteristics and height of young fi eld plants, at age eight months, of E. urophylla clones.
Tabela 2 – Resumo da análise de variância e estimativa dos parâmetros genéticos, fenotípicos e ambientais para características nutricionais e altura de plantas jovens no campo, aos oito meses de idade, de clones de E. urophylla.
Source GL
Mean Square
Hc CPPA CPR CtPPA CtPR CtPT EUP-PA EUP-R EUP-T
(m) (g.kg-1) (g.kg-1) (mg.plant-1) (mg.plant-1) (mg.plant-1) (g2.mg-1) (g2.mg-1) (g2.mg-1)
Block 2 0.0262 7.0 4.4 0.000012 0.0012 0.00013 2.3 1.8 1.8
Clone 7 0.272 ** 312.4 ** 223.3 ** 0.000832 ** 0.0181 ** 0.00656 ** 141.9 ** 13.9086 ** 45.9 **
Residual 14 0.0543 6.9 28.5 0.000007 0.0011 0.00021 5.4 1.7905 2.8
Mean 2.45 44.00 52.20 0.04 0.21 0.12 20.70 7.80 13.60
CVe(%) 9.5 6.0 10.2 6.9 15.6 11.7 11.2 16.9 12.2
CVg(%) 11.0 22.9 15.4 42.6 35.4 37.4 32.6 25.5 27.9
2
f 0.09079 104.145 74.45 0.000272 0.006 0.00219 47.303 4.6362 15.296
2
e 0.01811 2.313 9.512 0.000002 0.00037 0.00007 1.782 0.5968 0.925
D 0.07268 101.831 64.939 0.00027 0.0057 0.00212 45.52 4.0394 14.371
h2 (%) 80.0 97.8 87.2 99.1 83.7 96.8 96.2 87.1 94.0
CVg/CVe 1.16 3.83 1.51 6.15 2.27 3.20 2.92 1.50 2.28
** P≤0.01; Hc: height of fi eld seedlings, after eight months; CPPA: P concentration in shoot; CPR: P concentration in root; CtPPA: P content in shoot; CtPR: P content in root; CtPT: total P content; EUP-PA: P use effi ciency in shoot; EUP-R: P use effi ciency in root; EUP-T: total P use effi ciency; CVe: experimental coeffi cient of variation (error); CVg: genetic coeffi cient of variation; 2
f : phenotypic variation; 2
e : environmental variation, 2
g : genetic variation; h
2 : coeffi cient of genotypic determination; CV
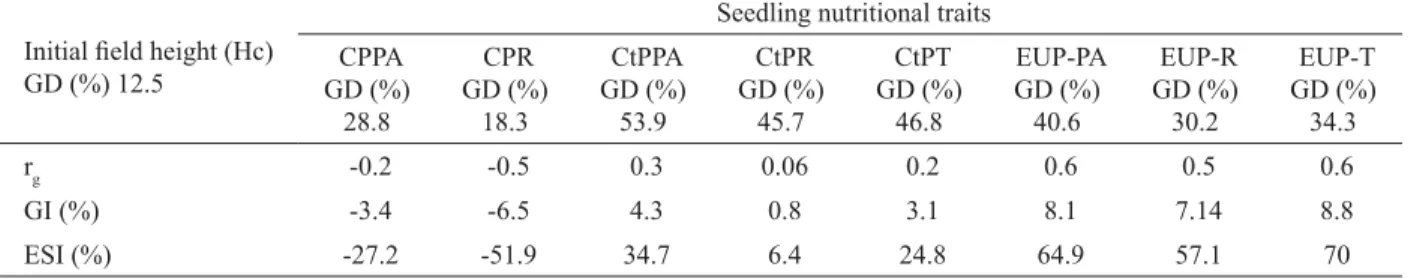
Table 3 – Direct gain (GD), genetic correlation (rg),indirect gain (GI) and indirect selection effi ciency (ESI) for seedling nutritional parameters and height of young fi eld plants, at age eight months, of E. urophylla clones.
Tabela 3 – Ganho direto (GD), correlação genética (rg),ganho indireto (GI) e efi ciência de seleção indireta (ESI) para parâmetros nutricionais de mudas e altura de plantas jovens no campo, aos oito meses de idade, de clones de E. urophylla.
Initial fi eld height (Hc) GD (%) 12.5
Seedling nutritional traits
CPPA GD (%)
28.8
CPR GD (%)
18.3
CtPPA GD (%)
53.9
CtPR GD (%)
45.7
CtPT GD (%)
46.8
EUP-PA GD (%)
40.6
EUP-R GD (%)
30.2
EUP-T GD (%)
34.3
rg -0.2 -0.5 0.3 0.06 0.2 0.6 0.5 0.6
GI (%) -3.4 -6.5 4.3 0.8 3.1 8.1 7.14 8.8
ESI (%) -27.2 -51.9 34.7 6.4 24.8 64.9 57.1 70
CPPA: P concentration in shoot; CPR: P concentration in root; CtPPA: P content in shoot; CtPR: P content in root; CtPT: total P content; EUP-PA: P use effi ciency in shoot; EUP-R: P use effi ciency in root; and EUP-T: total P use effi ciency.
The negative values of genotypic correlation between Hc and CPPA, CPR and CPT were due to the fact that, in these concentration traits, there may be a dilution of P in the dry matter of seedlings
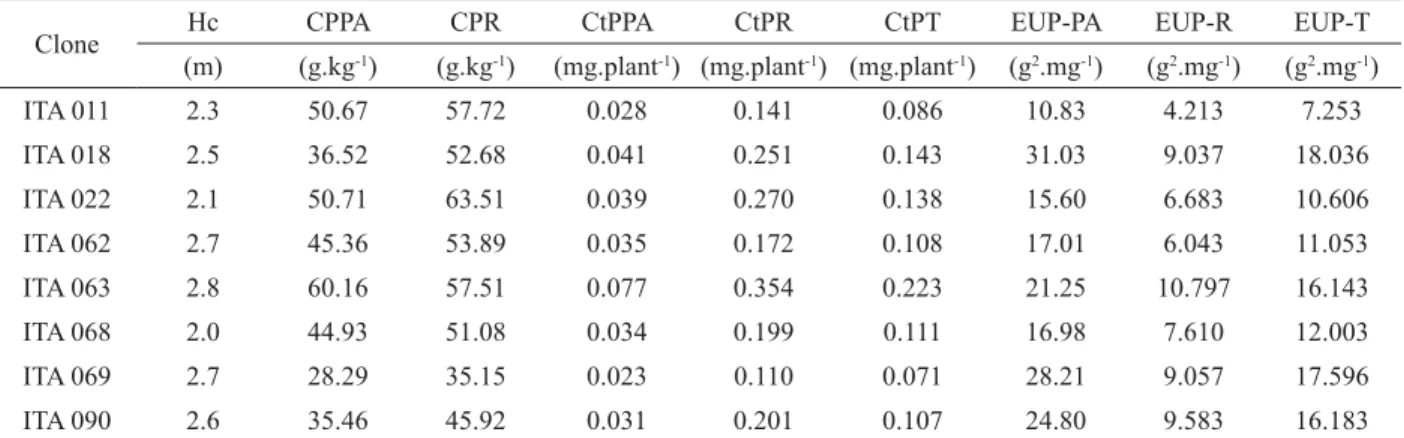
Table 4 provides mean values per clone type for all nutritional traits of interest. Considering only the traits showing better indirect gain responses in initial fi eld height, it is noted that EUP-PA ranged between 10.830 g2.mg-1 (clone ITA-011) and 31.030 g2.mg-1 (clone ITA-018); EUP-R ranged between 4.213 g2.mg-1 (clone ITA-011) and 10.797 g2.mg-1 (clone ITA-063), while EUP-T ranged between 7.253 g2.mg-1 (clone ITA-011) and 18.036 g2.mg-1 (clone ITA 018).
Clones ITA-063 and ITA-069 showed the highest mean values of Hc (height of fi eld seedlings), 2.8 and 2.7m respectively. Considering only those traits with higher ESI values, it is noted that said clones are included among clones also showing the highest estimated means for EUP-T, EUP-PA and EUP-R.
In the case of forest stands, the shoot portion being economically more important, P use effi ciency becomes a good indicator of nutrient conversion into biomass, in Eucalyptus clones (FURTINI NETO, 1994).
Results found in this study point to different behavioral patterns in eucalyptus clones regarding nutritional phosphorus use effi ciency. As far as forest activity is concerned, given the wide assortment of species and genotypes used as well as the use of differing fertility soils, this aspect should be given special attention, so as to ensure that the interaction between soil x species and/ or genotypes is done sensibly.
From that correlation, a genetic material may be obtained capable of simultaneously gathering several favorable attributes (CRUZ; REGAZZI, 2001). By the same token, where a trait is negatively correlated to another, one should be cautious that selection on one trait does not cause undesirable changes on other traits.
Table 3 above provides genotypic correlation coeffi cients among the traits of interest. From among nutritional traits, the lowest direct gain (GD%=18.3) was estimated for CPR and the highest (GD%=53.9) was estimated for CtPPA, considering a 25% selection. However, when observing estimates of expected indirect genetic gains (GI%) in fi eld height growth (Hc), it is noted that the most effi cient nutritional trait, at 120 days, was total P use effi ciency (EUP-T), with a GI of 8.8%, revealing an indirect selection effi ciency (ESI) of 70.0%. Other important nutritional traits, showing an ESI above 50%, included EUP-PA and EUP-R, with 64.9% and 57.1% respectively. These ESI values thus suggest that the nutritional trait ‘P use effi ciency’ can be an indicator of seedling quality in this clonal population.
According to Falconer (1987), indirect selection constitutes an important strategy for improving low heritability traits and/or traits considered diffi cult to measure.
Table 4 – Mean estimates for nutritional traits regarding height of young fi eld plants, at age eight months, of E. urophylla clones.
Tabela 4 – Estimativas de médias para características nutricionais de altura de plantas jovens no campo, aos oito meses de idade, de clones de E. urophylla.
Clone Hc CPPA CPR CtPPA CtPR CtPT EUP-PA EUP-R EUP-T
(m) (g.kg-1) (g.kg-1) (mg.plant-1) (mg.plant-1) (mg.plant-1) (g2.mg-1) (g2.mg-1) (g2.mg-1)
ITA 011 2.3 50.67 57.72 0.028 0.141 0.086 10.83 4.213 7.253
ITA 018 2.5 36.52 52.68 0.041 0.251 0.143 31.03 9.037 18.036
ITA 022 2.1 50.71 63.51 0.039 0.270 0.138 15.60 6.683 10.606
ITA 062 2.7 45.36 53.89 0.035 0.172 0.108 17.01 6.043 11.053
ITA 063 2.8 60.16 57.51 0.077 0.354 0.223 21.25 10.797 16.143
ITA 068 2.0 44.93 51.08 0.034 0.199 0.111 16.98 7.610 12.003
ITA 069 2.7 28.29 35.15 0.023 0.110 0.071 28.21 9.057 17.596
ITA 090 2.6 35.46 45.92 0.031 0.201 0.107 24.80 9.583 16.183
Hc: height of fi eld seedlings, after eight months; CPPA: P concentration in shoot; CPR: P concentration in root; CtPPA: P content in shoot; CtPR: P content in root; CtPT: total P content; EUP-PA: P use effi ciency in shoot; EUP-R: P use effi ciency in root; and EUP-T: total P use effi ciency.
COTTERIL, P. P.; DEAN, C. A successful tree breeding with
index selection. [S.l.]: CSIRO, 1990. 80 p.
CRUZ, C. D. Aplicativo computacional em genética e
estatística: programa Genes, Versão Windows. Viçosa, MG: UFV, 2001. 648 p.
CRUZ, C. D.; CARNEIRO, P. C. S. Modelos biométricos
aplicados ao melhoramento genético. Viçosa, MG: UFV, 2003. 585 p.
CRUZ, C. D.; REGAZZI, A. J. Modelos biométricos
aplicados ao melhoramento genético. 2. ed. Viçosa, MG: UFV, 2001. 390 p.
FALCONER, D. S. Introdução à genética quantitativa. Viçosa, MG: UFV, 1987. 279 p.
FURLANI, A. M. C.; BATAGLIA, O. C.; FURTINI, P. R.; AZZINI, L. E.; CAMARGO, O. A. B. Avaliação de genótipos de arroz quanto à efi ciência na utilização de fósforo em solução nutritiva e em solo. Revista Brasileira de Ciência do
Solo, Campinas, v. 7, n. 3, p. 291-302, set./dez. 1984.
FURTINI NETO, A. E. Efi ciência nutricional, cinética de
absorção e frações fosfatadas em Eucalyptus ssp. 1994. 99 p. Tese (Doutorado) - Universidade Federal de Viçosa, Viçosa, 1994.
4 CONCLUSIONS
Signifi cant differences were found among clones regarding genotypes, for all traits of interest.
Heritability values were found to be relatively high. A high correlation was found between initial fi eld height and EUP-T, EUP-PA and EUP-R, for nutritional traits.
Clone ITA063 was found to have the highest CtP value, while clone ITA 069, the lowest.
The most P use effi cient clone was ITA063, while the most ineffi cient (EUP-T, EUP-PA and EUP-R) was ITA 011.
5 REFERENCES
ASSOCIAÇÃO BRASILEIRA DE PRODUTORES DE FLORESTAS PLANTADAS. Anuário estatístico da
ABRAF: ano base 2008. Brasília, 2009. 129 p.
ASSOCIATION OF OFFICIAL ANALYTICAL CHEMISTS.
Offi cial methods of analysis. 12. ed. Washington, 1975. 1094 p.
COMPANHIA DE PESQUISA DE RECURSOS MINERAIS.
GOMES, J. M.; COUTO, L.; LEITE, H. G.; XAVIER, A.; GARCIA, S. L. R. Parâmetros morfológicos na avaliação de qualidade de mudas de Eucalyptus grandis. Revista Árvore, Viçosa, v. 26, n. 6, p. 655-664, nov./dez. 2002.
LUCA, E. F. Efi ciência de uso do fosfato de cálcio por mudas
de Eucalyptus grandis. 1997. Dissertação (Mestrado) – Escola Superior de Agricultura “Luiz de Queiroz”, Piracicaba, 1997.
MACHADO, C. T. T. Caracterização de genótipos de
milho quanto a parâmetros morfológicos, fi siológicos e microbiológicos associados a efi ciência e absorção e uso do fósforo. 2000. 366 p. Tese (Doutorado) – Universidade Federal Rural do Rio de Janeiro, Seropédica, 2000.
SIDDIQUI, M. Y.; GLASS, A. D. M. Utilization index; a modifi ed approach to the estimation and comparison
of nutrient utilization effi ciency in plants. Journal Plant
Nutrition, New York, v. 4, n. 3, p. 289-302, 1981.
SWIADER, J. M.; CHYAN, Y.; FREIJI, F. G. Genotypic differences in nitrate uptake and utilization effi ciency in pumpkin hybrids. Journal of Plant Nutrition, v. 17, n. 10, p. 1687-1699, 1994.
TOMÉ, M. A. Blocos fi xos ou aleatórios?: o caso dos ensaios em látice no melhoramento vegetal. Ciência e
Agrotecnologia, Lavras, v. 26, n. 3, p. 576-584, maio/jun. 2002.
VENCOVSKY, R.; BARRIGA, P. Genética biométrica no