1. department of sports and Health, lisbon university (ulisboa), faculty of Human Kinetics (fmH), Biomechanics and functional morphology laboratory, p-1499-002 lisbon, portugal.
2. ciper - interdisciplinary centre for the study of Human performance, Neuromechanics of the Human movement group, research, fmH, ulisboa, portugal
dictor of knee pain. Further research is required to in-vestigate the influence of foot morphology as well as of the use of insoles, splints or adapting shoes, on obese individuals with knee osteoarthritis.
Keywords: Knee osteoarthritis; Pain; Morphology; Body composition; Physical activity; Obesity.
IntroductIon
Knee osteoarthritis (KOA) is a major cause of pain and loss of function1, affecting 16.7% of the U.S. population above 45 years of age2. In Portugal the overall prevalence of KOA was 11.1%, which was higher than in the hip (5.5%)3.
Considering that osteoarthritis (OA) is a chronic disea se, the way to reduce its impact on the population is to prevent its incidence and to decrease the speed of its progression by controlling the risk factors. These factors can be classified as systemic (age, gender, hor-monal factors) or biomechanical (obesity, physical ac-tivity, muscle weakness)4. Although KOA does not im-plicate a sudden change in mobility, there are several clinical and radiographic indicators that over the years may influence these patients’ ability to perform articu-lar motion, with consequent limitation in activity and restriction in social participation.
The role of physical activity in the control of OA symptoms is still controversial. On the one hand, physi -cal activity is recommended for the positive effect on the muscle strength around the joint, in maintaining and improving joint mobility5, increasing the diffusion of substances that nourish the articular cartilage and en-hancing anabolic processes6. On the other hand, phy -sical activity such as high impact sport activities that cause overloading can elicit cartilage breakdown and is somehow perceived as unsafe for individuals with OA, because the repetitive impact and torsional loads that occur during physical activity can damage the articular cartilage and calcify the subchondral bone7.
Determinant factors of pain intensity in overweight
and obese adults with knee osteoarthritis
Cunha C1, Vieira F1,2, Yazigi F1,2, Espanha M1,2, Carnide F1,2
acta reumatol port. 2016;41:359-366
AbstrAct
Osteoarthritis is one of the most disabling diseases, the main symptom being pain, which is associated with a low level of physical activity. The incidence and pro-gression of knee osteoarthritis are directly related with risk factors such as obesity, age and mechanical factors. Objective: The aim of this study was to identify which variables (physical activity, anthropometry and body composition of the lower limb) best predict pain in-tensity in obese individuals with knee osteoarthritis. Methods: The sample consisted of 44 individuals of both genders (mean age 56.6 ± 6.6 yrs). Anthropometric mea-sures of body mass, stature, mid-thigh, patellar and calf circumferences, and foot breadth were obtained. The body composition of the most painful lower limb was obtained by dualenergy Xray absorptiometry in diffe -rent regions: mid-thigh; patella; calf and foot. For each of these regions, fat mass percentage, the amount of fat and fat-free mass, bone mass and bone mineral density were evaluated. Physical activity was assessed by the In-ternational Physical Activity Questionnaire (short ver-sion) and pain intensity with the numeric rating scale. Data analysis was done using the multifactorial logistic regression (backward conditional method).
Results: The multifactorial analysis showed that gender (Odds Ratio of 7.448 for a 95% Confidence Interval of [1.032 – 53.747]) and foot breadth (Odds Ratio of 3.730 for a 95% Confidence Interval of [1.006 – 13.827]) are important factors to explain the risk of pain.
Conclusions: These results seem to indicate that the as-sessment of foot morphology must be considered in knee osteoarthritis studies, since foot breadth is a
pre-According to Cicuttini8, obesity is the main pre-ventable risk factor in the incidence and progression of knee OA and it is associated both with metabolic factors9, because the main source of proinflamatory adipokines is the adipose tissue10, and with biome-chanical factors, such as the overload on the weight-bearing joint11, in which the effect of overweight is in-creased when the individual has a poor alignment of the lower limb (varus or valgus knee)12.
Foot morphology has also been associated with in-creased development of OA. Particularly, foot prona-tion13and flat feet are related with knee pain in subjects with and without OA14.
In addition to these characteristics, the body com-position of the lower limb may be related to the in-creased incidence and progression of KOA, namely the muscle mass15, which reduces the impact of shocks in the joint, and the mineral density of the bone16, which is associated with an increased incidence of OA.
Although there is some evidence of an association between knee alignment and foot posture and the risk of OA13, there are few studies that establish the rela-tionship between the body composition of the lower limb and the development of this disease.
The purpose of this study was to identify the role of physical activity, anthropometry and body composi-tion on the prediccomposi-tion of pain intensity in obese indi-viduals with KOA.
methods
sAmPle
The sample of this study, composed of 44 subjects, is part of the PICO project (aquatic program against os-teoarthritis) that consists of an aquatic exercise pro-gram, with an educational component, that has been specifically created for overweight and obese indivi -duals with KOA17.
All the subjects participated voluntarily in the study after being informed of their goals, and signed a con-sent form. This study was approved by the Ethical Committee of the Faculty of Human Kinetics, Techni-cal University of Lisbon and was conducted in accor-dance with the World Medical Association’s Declara-tion of Helsinki.
Inclusion criteria required that all subject: 1) be aged between 40-65 years; 2) have a body mass index (BMI) between 28.0-45 kg/m2; 3) have knee pain and a radiographic Knee OA (K-L grade I-III)18; 4) lead a
sedentary lifestyle (defined as no frequent organized exercise for the last 6 months); 5) be independent with mobility capacity; and 6) be able to read and write. Di-agnosis of Knee OA was done according to the clinical and radiographic criteria of the American College of Rheumatology (ACR)19.
Knee PAIn
The perceptible pain intensity of the most painful knee with OA during the last month was assessed using a Numerical Rating Scale (NRS) (0-10), where zero meant no pain and ten worst possible pain.
PhysIcAl ActIvIty
Assessment of physical activity levels was done through the short version of the International Physical Activity Questionnaire (IPAQ) validated for the Por-tuguese adult population20. Data were treated accor -ding to IPAQ guidelines21.
This questionnaire uses the activities performed in a typical week as a representative reference, of the lifestyle adopted by the subject during that period.
AnthroPometry
Anthropometric measurements included height, body mass, three circumferences of the lower limbs (mid--thigh, patella and calf) and the foot breadth.
The reason for choosing foot breadth, as the only foot anthropometric measure, was its accuracy and measurement ease.
The lower limb measurements were made on the right and left sides; nevertheless we only used the data of the lower limb of the most painful knee in the sta-tistical analysis.
Anthropometric measurements were collected according to the procedures established by ISAK, des -cribed in Marfell-Jones, Olds, Stewart and Carter22, ex-cept the patellar circumference and foot breadth, obtained according to the procedures described by Lohman et al.23 and Pheasant and Haslegrave24, res -pectively.
BMI was calculated as body mass (kg) divided by the square of the height (m2).
All measurements were performed using a single evaluator accredited by ISAK, using a stadiometer “Drought”, a scale “Seca Alpha 770”, a tape measure “Rosscraft” and a compass and slide from the anthro-pometric case “DKSH”.
The intra-evaluator technical errors of measurement (TEM) for all anthropometric variables are acceptable25
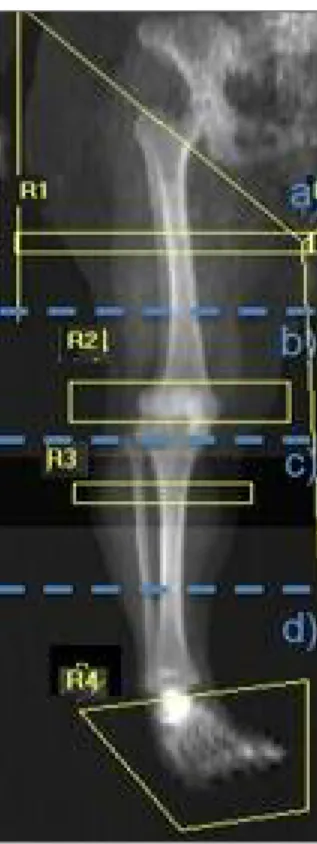
the top of the greater trochanter and the upper edge of the patella and after the calculation of its half-length, we placed the bottom side of a random width rectan-gle on this midpoint. The top side of this rectanrectan-gle was then lowered until it had a width of two pixels (mini-mum distance between two parallels lines). Lastly, we established the R1 three pixels width by lowering the bottom side of the rectangle by one pixel.
The patellar region (R2) was defined by a rectangle delimited by the upper edges of the patella and the ti -bia respectively, and the width corresponding to the width of the knee region (Figure 1).
The definition of the calf region (R3) that corres -ponded to the maximum calf volume was similar to R1: a rectangle with three pixels in width and a length equal to the greatest calf width (Figure 1). To define this re-gion, firstly we located the level at which the calf shows its greatest volume to place a random width rectangle with its lateral sides on the outer edges of the calf. Se -condly, we moved its bottom side closer to the topside, until the R3 three pixels width rectangle was found.
The posterior limit of the foot region (R4) was the lower edge of the malleolus tibial and its anterior li mit was the most distal portion of the biggest toe (Figure 1). As mentioned above, anatomical landmarks defined each region of interest in order to enable standardiza-tion of the measurement site for all individuals, thus al-lowing a correct comparison among them.
The choice of this methodology, using anatomical landmarks and not pre-defined areas for each region, was due to the fact that this type of population’s mor-phology of certain regions, such as the region of the patella, presents varying sizes, making it difficult to de-fine the same area for all individuals.
A single evaluator conducted the assessment of each region. The intra-evaluator technical error of measure-ment (TEM) was: 0.2% for the right mid-thigh area, 0.3% for the left mid-thigh area, 0.7% for the right patella area, 0.6% for the left patella area, 0.4% for the right calf area, 0.6% for the left calf area, 0.4% for the right and left foot areas.
stAtIstIcAl AnAlysIs
Descriptive statistics was used to determine the central tendency, standard deviation, and relative frequency of analysed variables, allowing the sample characterization. Normal distribution of scale variables was evalua -ted by Shapiro-Wilk tests.
Since the variable pain did not follow a normal dis-tribution in this study, we dichotomized pain using the since they are below 1% (right midthigh circumferen
-ces - 0.2%; left mid-thigh circumferen-ces – 0.1%; right patella circumferences – 0.2%; left patella circumferen -ces – 0.3%; right calf circumferen-ces – 0.2%; left calf circumferences – 0.4%; foot right breadth – 0.6%; foot left breadth 0.4%).
body comPosItIon
The body composition of the most painful lower limb was obtained by DXA scanner (QDR 4500A, fan-beam densitometer, software version 8.21; Hologic, Waltham, USA) at different regions: mid-thigh (R1); patella (R2); calf (R3) and foot (R4), as described below. For each of these regions, fat mass percentage, the amount of fat mass (FM), and fat-free mass and bone (FFM), and bone mineral density (BMD) were evalua ted.
The mid-thigh region (R1) was defined by a rectan-gle placed at mid-distance between the top of the greater trochanter and the upper edge of the patella (Figure 1). R1 is a rectangle with three pixels in width and a length equal to the greatest thigh width. To de-fine this region, firstly we measured the length between
FIGure 1.Regions of the most painful lower limb for body composition analysis in DXA (R1- mid-thigh region; R2 – patellar region; R3 – calf region; R4 – foot region)
median value of 3 as the cut-off point, thus generating two groups (i.e., less and more pain).
When comparing the groups with less and more pain we used the Student’s t test and Mann-Whitney test for variables with normal and non-normal distri-bution, respectively.
In order to know which variables best predicted the level of pain intensity in individuals with knee OA, we used the bivariate (enter-method) and multivariate lo-gistic regression analysis (conditional backward method). The logistic regression model was adjusted for gender and only included the lower limb body com-position variables that weren’t significantly correlated with the anthropometric variables of the same regions. Statistical analysis was performed with the software SPSS ® Statistics for Mac version 19.0 (SPSS Inc., IBM Company, Chicago), for < 0.05.
results
In this study the mean age of participants was 56.6 years old, the mean value of BMI was 34.8 m/cm2, and mean knee pain intensity was 3.6 on a scale of 0 to 10. The severity of OA was measured using the radiologi-cal grading sradiologi-cale (K-L) where 50% of the participants were classified with grade I, 34.1% with grade II and 15.9% with grade III.
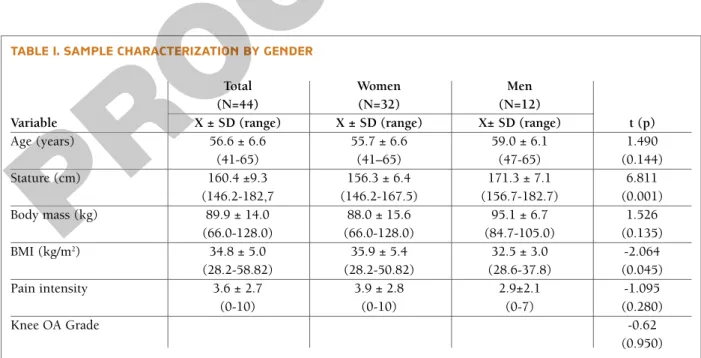
The knee OA is the most common form of OA and
affects the female population in a greater number26, which explains the fact that the sample of this study is mainly constituted by female participants (Table I). In this study, women presented higher values than men both on pain intensity and BMI but only the differences in BMI was statistically significant.
PhysIcAl ActIvIty
Physical activity was assessed by IPAQ, accounting for the time spent per week in vigorous physical acti -vity, moderate physical acti-vity, walking and the time spent in a sitting position (Table II).
The results show no statistically significant diffe -rences in any variable of physical activity between the individuals with less pain and with more pain. How-ever, the analysis of Table II shows that individuals in the group with less pain spend on average less time per week in vigorous physical activity (23.2 min vs. 46.7 min) and moderate physical activity (315 min/week or 5h and 15 min/week vs. 498.1 min/week or 8h and 18 min/week), but walk more (153.4 min/week or 2h and 34min/week vs. 141.7 min/week or 2h and 22m/week) and remain longer in sitting positions (2358.2min/ /week or 39h and 18min/week vs. 2123.3 min/week or 35h and 23min/week).
body comPosItIon And AnthroPometry oF the most PAInFul lower lImb
Table III presents the results of the comparison between
tAble I. sAmPle chArActerIzAtIon by Gender
Total Women Men
(N=44) (N=32) (N=12)
Variable X ± SD (range) X ± SD (range) X± SD (range) t (p)
Age (years) 56.6 ± 6.6 55.7 ± 6.6 59.0 ± 6.1 1.490 (41-65) (41–65) (47-65) (0.144) Stature (cm) 160.4 ±9.3 156.3 ± 6.4 171.3 ± 7.1 6.811 (146.2-182,7 (146.2-167.5) (156.7-182.7) (0.001) Body mass (kg) 89.9 ± 14.0 88.0 ± 15.6 95.1 ± 6.7 1.526 (66.0-128.0) (66.0-128.0) (84.7-105.0) (0.135) BMI (kg/m2) 34.8 ± 5.0 35.9 ± 5.4 32.5 ± 3.0 -2.064 (28.2-58.82) (28.2-50.82) (28.6-37.8) (0.045) Pain intensity 3.6 ± 2.7 3.9 ± 2.8 2.9±2.1 -1.095 (0-10) (0-10) (0-7) (0.280) Knee OA Grade -0.62 (0.950) Mean value, standard deviation, t and p
the groups with more pain and less pain regarding an-thropometric and body composition of the most painful limb variables. Although there were no statis-tically significant differences between the two groups, the individuals in the less pain group presented lower
values for all anthropometric variables and body com-position, with the exception of the FFM of the foot.
In order to understand the association between pain intensity, physical activity, anthropometry and body composition of different regions of the painful lower
tAble III. comPArIson oF AnthroPometry And body comPosItIon oF the most PAInFul lImb between the GrouPs wIth more PAIn And less PAIn
Less Pain More Pain
Variable (N=24) (N=20) t (p) Circumference (cm) 58.2 ± 4.9 61.6 ± 7.6 -1.834 (0.074) Mid-high FM (g) 407.4 ± 161.4 511.9 ± 220.4 -1.813 (0.077) FFM (g) 706.2 ± 139.9 740.0 ± 137.6 -0.259 (0.795)* BMD (g/cm2) 1.792 ± 0.283 1.839 ± 0.386 -0.46 (0.648) Circumference (cm) 45.1 ± 3.7 47.1 ± 6.5 -1.428 (0.161) FM (g) 469.3 ± 152.8 526.0 ± 168.4 -1.084 (0.278)* Patella FFM (g) 404.4 ± 87.1 416.6 ± 103.9 -0.33 (0.741)* BMD (g/cm2) 1.123 ± 0.172 1.196 ± 0.183 -1.371 (0.178) Circumference (cm) 40.1 ± 2.9 41.4 ± 4.4 -0.57 (0.572)* Calf FM (g) 139.0 ± 54.5 171.5 ± 76.6 -1.667 (0.103) FFM (g) 333.0 ± 75.2 327.5 ± 74.9 0.241 (0.811) BMD (g/cm2) 1.129 ± 0.199 1.163 ± 0.177 -0.59 (0.558) Breadth (cm) 9.6 ± 0.6 9.7 ± 0.6 -0.978 (0.334) Foot FM (g) 263.8 ± 58.9 265.0 ± 42.7 -0.075 (0.941) FFM (g) 516.2 ± 120.3 462.5 ± 151.7 -2.074 (0.038)* BMD (g/cm2) 0.863 ± 0.157 0.863 ± 0.201 -0.687 (0.492)* tAble II. comPArIson oF PhysIcAl ActIvIty between the GrouPs wIth more PAIn (IntensIty> 3) And less PAIn (IntensIty ≤3)
Less pain (N=24) More pain (N=20)
Variable X ± SD X± SD z (p) VPA (min.sem-1) 23.2 ± 57.8 46.7 ± 128.10 -0.163 (0.87) MPA (min.sem-1) 315.0 ± 439.3 498.1 ± 914.1 -0.049 (0.961) WALK (min.sem-1) 153.4 ± 315.0 141.7 ± 179.3 -0.083 (0.934) VMPA (min.sem-1) 338.2 ± 474.8 544.7 ± 995.3 -0.036 (0.972) TOTALPA (min.sem-1) 491.6 ± 742.3 686.4 ± 1061.6 -0.012 (0.961) SIT (min.sem-1) 2358.2 ± 1171.4 2123.3± 327.1 0.593 (0.557)*
Mean value, standard deviation, t and p
VPA: Time of vigorous physical activity per week; MPA: Time of moderate physical activity per week; WALK: Time walking per week; VMPA: Time of moderate and vigorous physical activity per week; TOTALPA: Total time of physical activity
(VPA+MPA+WALK); Sit: Total time seated per week. *Student's t test, for the variables with normal distribution
Mean value, standard deviation, t and p
FM-fat mass; FFM-fat-free mass, BMD-bone mineral density by area. *Mann-Whitney U test , for the variables without normal distribution.
for variables like foot arch or lower limb alignment that are not inserted in the model.
Caution should be taken when we want to apply these results to other populations due to the higher confidence intervals obtained in this study, which are related to the short number of participants.
The variable gender was one of the two variables that was presented in the regression model, possibly be-cause of the higher prevalence of OA in women, mainly aged over 50 (a fact that is associated with the occur -rence of menopause and consequent changes in circulating levels of female sex hormones which act in balance with bone metabolism27, and the fact that women with OA have a greater tendency to express higher levels of pain than what they really feel28.
A possible explanation for the contribution of foot breadth as a predictor of pain is related to biome -chanical changes of the lower limb as a consequence of overweight and obesity and the knee compartment affected with OA (tibiofemoral medial or lateral or tibiofemoral joint plus patellofemoral). It is known that obesity is associated with a valgus alignment of the lo wer limb and consequently to a pronated foot, as well as with increased ground reaction force during gait12, 29. These changes are a result of both the amount of body mass and a response to an impaired balance29.
In a comparison study of the plantar pressure dis-tribution between obese and non-obese subjects30, plantar pressure was found to be higher in the obese, being exerted mainly in the anterior-transverse arch, between the heads of the first and fifth metatarsals, points corresponding to the anatomical references used by us for measuring foot breadth. Thus, the rela -tionship between the breadth of the foot and pain can be explained by the fact that in most obese patients with knee OA, as a result of increased body weight, weight is distributed in a larger plantar surface on the forefoot, resulting in an increase of its breadth. More-over, one feature of knee OA is joint instability, caused limb in an integrated way, we performed a logistic
re-gression analysis (conditional backward method). The variables included in the final model were only those that showed a significant influence (p<0.05) on pain intensity in the bivariate logistic regression. Thus, the final logistic regression model only included the lower limb anthropometric variables (mid-thigh circumference, patella circumference, calf circumfe -rence, foot breadth), because no limb body composi-tion varia bles showed significant inference on pain in-tensity.
The regression model was adjusted according to gender and in addition to the anthropometric variables included the following ones: age, BMI, total time in physical activity and time spent in a sitting position.
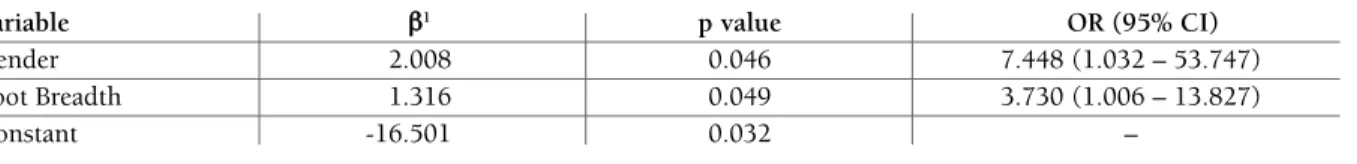
Table IV shows the variables that were integrated in the final model used to predict the intensity of knee pain.
From all variables included in the model, only the gender and foot breadth integrated the model with a significant effect on the occurrence of knee pain. This model presents a Nagelkerk R2of 0.18, which means that the model can explain 18% of the pain variable.
dIscussIon
In this study we evaluated 44 obese adults of both gen-ders with knee osteoarthritis in order to identify the in-fluence of the level of physical activity, anthropometry and body composition of the lower limb that best pre-dicts knee pain. The final regression model included the variables gender and foot breadth with statistic sig-nificant value that influences knee pain. The risk of pain increases seven times for women (OR = 7.448) and approximately four times per centimetre added to the foot breadth (OR = 3.730). However, this model only explains 18% of knee pain in individuals with knee OA. The value of foot breadth can be explained
tAble Iv. coeFFIcIents oF the loGIstIc reGressIon model For the vArIAble "PAIn IntensIty"
Variable b1 p value OR (95% CI)
Gender 2.008 0.046 7.448 (1.032 – 53.747)
Foot Breadth 1.316 0.049 3.730 (1.006 – 13.827)
Constant -16.501 0.032 –
b coefficients (b); Odds Ratio (OR); 95% Confidence Interval (95%CI) 1Constant means the interception value of the knee pain intensity
by loss of proprioceptive accuracy and also by quadri-ceps muscle weakness29, 31 that affects balance. One pos-sible strategy might be the attempt to increase the plan-tar contact area and thus stimulate the planplan-tar receptors that contribute to balance control.
Although there are no studies linking foot breadth to the presence of pain in individuals with KOA, Gross et al.14found an association between knee pain and flat feet. According to the same authors, flat feet present a greater forefoot region, caused by a dimi -nished me dial tibiofemoral joint space that could be associated to malaligment of the lower limb. Addition-ally, foot pronation in patients with OA in the medial compartment of the knee was a strategy to reduce pain by mo ving the centre of pressure to the lateral part of foot13.
In turn, the breadth of the foot29 is an anthropome -tric measure that has greater influence on logistic regression models to predict the plantar area, so the lar -ger the breadth of the foot, the greater the plantar area that is associated with increased knee pain.
These results should be interpreted in light of the limitations of this study. Firstly, the small number of participants might not be representative of the popu-lation studied. Second, this study doesn’t have a control group, which prevents us from making compari -sons between individuals with and without KOA. Third, assessing physical activity with the IPAQ is subjective and dependent on the shortterm memory abili -ty of the participants, therefore not permitting the pre-cise identification of the type and intensity of weekly physical activity practiced. Finally, it would have been fundamental for the interpretation of the results to know which compartment of the knee (medial or la -teral) was more affected by OA, as well as the lower limb alignment and foot posture measurements that make it possible to know if the foot was pronated or supinated. This information is important due to the exis tence of an association between incidence and pro-gression of OA12and pain intensity found in this study.
The results of this study suggest that foot morpholo -gy may influence knee pain in individuals with KOA, which makes the research of the influence of the use of insoles, splints or adapting shoes in this kind of popu-lation relevant in future.
In conclusion, our results seem to indicate that the evaluation of the morphology of lower limb, and spe-cial foot morphology, should be considered in further studies on knee OA, since gender and foot breadth were pain predictors.
corresPondence to
Carlota Cunha
Department of Sports and Health,
Lisbon University (ULisboa), Faculty of Human Kinetics (FMH), Biomechanics and Functional Morphology Laboratory, 1499-002 Lisbon, Portugal
E-mail: carlotalc88@gmail.com
reFerences
1. Cooper C, Snow S, McAlindon TE, Kellingray S, et al. Risk fac-tors for the incidence and progression of radiographic knee os-teoarthritis. Arthritis Rheum, Published online first: 2 APR 2001. DOI: 10.1002/1529-0131(200005)43:5<995::AID--ANR6>3.0.CO;2-1
2. Lawrence RC, Felson DT, Helmick CG, et al. Estimates of the prevalence of arthritis and other rheumatic conditions in the United States. Part II. Arthritis Rheum, Published online first: 28 DEC 2007 DOI: 10.1002/art.23176
3. Monjardino T, Lucas R, Barros H. Frequency of rheumatic di -seases in Portugal: a systematic review. Acta Reumatol Port. 2011;36:336-363
4. Felson DT, Lawrence RC, Dieppe PA, et al. Osteoarthritis: new insights. Part 1: the disease and its risk factors. Ann Intern Med 2000, Published online first: 1 AUG 2011 doi: 10.1016/j.cger. 2010.03.001
5. Cheng Y, Macera CA, Davis DR, Ainsworth BE, Troped PJ, Blair SN. Physical activity and self-reported, physician-diagnosed os-teoarthritis: is physical activity a risk factor? J Clin Epidemiol 2000, Published online first: MAR 2000 doi:10.1136/ bjsm.37.6.521
6. Hall AC, Urban JPG, Gehl KA. The effects of hydrostatic pres-sure on matrix synthesis in articular cartilage. Journal of or-thopaedic research 1999, Published online first: 18 FEB 2005 DOI: 10.1002/jor.1100090102
7. Vuori IM. Dose-response of physical activity and low back pain, osteoarthritis, and osteoporosis. Med Sci Sports Exerc 2001, Published online first: 16 DEC 2005 DOI: 10.1097/00005768-200106001-00026
8. Cicuttini FM, Baker JR, Spector TD. The association of obesity with osteoarthritis of the hand and knee in women: a twin study. J Rheumatol 1996; 23(7), 1221-1226
9. Hart DJ, Doyle DV, Spector TD. Association between metabo lic factors and knee osteoarthritis in women: the Chingford Study. J Rheumatol 1995; 22(6), 1118-1123
10. Conde J, Scotece M, Gómez R, Lopez V, Reino J, Gualillo O. Adipokines and Osteoarthritis: Novel Molecules Involved in the Pathogenesis and Progression of Disease. Arthritis 2011, Pub-lished online first: 10 JUN 2010 doi:10.1155/2011/203901 11. Powell A, Teichtahl AJ, Wluka AE, Cicuttini FM. Obesity: a
pre-ventable risk factor for large joint osteoarthritis which may act through biomechanical factors. Br J Sports Med 2005, Published online first: JAN 2005 doi: 10.1136/bjsm.2004.011841 12. Sharma L, Lou, C Cahue S, Dunlop DD. The mechanism of the
effect of obesity in knee osteoarthritis: the mediating role of malalignment. Arthritis Rheum 2000, Published online first: 2 APR 2001 DOI: 10.1002/1529-0131(200003)43:3<568::AID-ANR13>3.0.CO;2-E
13. Levinger P, Menz HB, Fotoohabadi MR, Feller JA, Bartlett JR, Bergman NR. Foot posture in people with medial compartment knee osteoarthritis. J Foot Ankle Res 2010, Published online first: 16 DEC 2010 doi:10.1186/1757-1146-3-29
14. Gross D, Felson D, Niu J, Hunter D, Guermazi A, Roemer F, Du-four A, Gensure R, Hannan M. Association of flat feet with knee pain and cartilage damage in older adults. J. Arthritis Care & Re-search 2011, Published online first: 7 JUL 2011 DOI 10.1002/acr.20431
15. Slemenda C, Brandt KD, Heilman DK, et al. Quadriceps weak-ness and osteoarthritis of the knee. Ann Intern Med 1997, Pub-lished online first: 27 JUL 1998 doi:10.1136/ard.57.10.588 16. Nevitt MC, Zhang Y, Javaid MK, et al. High systemic bone mi
-neral density increases the risk of incident knee OA and joint space narrowing, but not radiographic progression of existing knee OA: the MOST study. Ann Rheum Dis 2009, Published online first: 15 January 2009 doi: 10.1136/ard.2008.099531. 17. Yázigi F, Espanha M, Vieira F, Messier SP, Monteiro C, Veloso AP.
The PICO project: aquatic exercise for knee osteoarthritis in overweight and obese individuals. BMC Musculoskeletal D i -sorders 2013, Published online first: 13 NOV 2013 doi: 10.1186/1471-2474-14-320.
18. Kellgren JH. et al. Radiological assessment of osteo-arthrosis. Ann Rheum Dis 1957;16.4: 494-502.
19. Altman R, Alarcon G, Appelrouth D, et al. The American Col-lege of Rheumatology criteria for the classification and repor ting of osteoarthritis of the hip. Arthritis Rheum 2005, Published online first: 9 DEC 2005 DOI: 10.1002/art.1780340502 20. Mil-Homens MJ (2004). Caracterização da actividade física da
população adulta portuguesa e sua relação entre o estado e saúde e os custos com cuidados médicos. [dissertation]. [Lisbon]. Uni-versity of Lisbon; 138p.
21. Guidelines for data processing and analysis of the Internation-al PhysicInternation-al Activity Questionnaire (IPAQ)– Short and long forms. (n.d). Retrieved from http://www.ipaq.ki.se
22. Marfell-Jones M, Olds T, Stewart A, Lindsay Carter JE (2006) In-ternational Standards for Anthropometric Assessment. Rev. ed. Potchefstroom: ISAK; 137p.
23. Lohman TG, Roche AF, Martorell R (1988) Anthropometric standardization reference manual. Champaing, Illions: Human Kinetics Books; 177p.
24. Pheasant S, Haslegrave, CM (2006) Bodyspace anthropometry, ergonomics, and the design of work. 3rd ill. rev. ed. New York, NY: CRC Press; 352p.
25. Norton KI, Whittingham NO, Carter JEL, Kerr DA, Gore CJ, Marfell-Jones MJ (1996) Measurement Techniques in Anthro-pometry. In: Norton, K. and Olds, T. (Eds.), Anthropometrica. UNSW Press, Sydney. 77-96p
26. Symmons D, Mathers C, Pfleger B (2000) Global burden of os-teoarthritis in the year 2000.
27. Sowers M, Hochberg M, Crabbe, JP, Muhich A, Crutchfield M, Updike S. Association of bone mineral density and sex hormone levels with osteoarthritis of the hand and knee in premenopausal women. American journal of epidemiology 1996, Published on-line first: 22 MAY 2001 DOI: 10.1093/oxfordjournals.aje.a008655 28. Keefe FJ, Lefebvre JC, Egert JR, Affleck G, Sullivan MJ, Caldwell DS. The relationship of gender to pain, pain behavior, and disa -bility in osteoarthritis patients: the role of catastrophizing. Pain 2000;87(3), 325-334. Published online first: 1 AUG 2000 DOI: 10.1016/S0304-3959(00)00296-7
29. Messier SP. Obesity and osteoarthritis: disease genesis and non-pharmacologic weight management. Rheum Dis Clin North Am 2008, Published online first: 1 AUG 2009 doi:10.1016/j.rdc. 2008.04.007
30. Hills AP, Hennig EM, Byrne NM, Steele JR. The biomechanics of adiposity--structural and functional limitations of obesity and implications for movement. Obes Rev 2002, Published online first: 21 FEB 2002 DOI: 10.1046/j.1467-789X.2002.00054.x 31. Espanha MM, Pais S, Teles J, Silva C. The influence of age, strength and stiffness on proprioception in knee osteoarthritis Osteoarthritis and Cartilage, suppl. Published online first: APR 2012 doi:10.1016/j.joca.2012.02.229.