Microplankton composition, production and upwelling dynamics in Sagres (SW Portugal) during summer 2001
20
0
0
Texto
(2) sm69n3323. 5/9/05. 19:13. Página 324. INTRODUCTION Coastal fertilisation by cold nutrient-rich upwelled waters stimulates productivity and phytoplankton blooms (Barber and Smith, 1981). These blooms are dominated initially by nonmotile diatoms (Officer and Ryther, 1980) that are preferentially selected under the turbulent conditions produced by strong winds, which are responsible for the upwelling. As the turbulence is reduced, optimal conditions develop for the more motile dinoflagellates, establishing the plankton succession pattern (Margalef, 1978; Smayda, 2000). The ocean biota is sustained by the balance between the autotrophic (i.e. production) and heterotrophic (i.e. respiration) processes (e.g. Williams, 1984, 1998). In coastal systems where inputs from terrestrial sources are limited, such as the studied location, phytoplankton primary production represents the main source of organic matter. Size fractionation studies (Williams, 1981) have associated the dominant respiratory activity in coastal waters with small non-photosynthetic organisms, such as heterotrophic bacteria and microflagellates. Northerly winds along the west coast of the Iberian Peninsula produce conditions for seasonal upwelling from early spring to late summer (e.g. Wooster et al., 1976; Fiúza et al., 1982), whilst occasional upwelling occurs along the southern coast of Portugal (Algarve) with favourable westerly winds. After a prolonged period of northerly winds, fertile water can circulate around the Cabo S. Vincente, the southwestern tip of the peninsula, and flow eastwards along the southern coastal shelf (Fiúza, 1983; Sousa and Bricaud, 1992; Relvas and Barton, 2002). In contrast, a warm counter current, originating in the Gulf of Cadiz (Fig. 1) flows westwards to the Algarve coast and, during periods of prolonged southeasterly winds, can circulate around Cabo S. Vincente and flow northwards (Relvas and Barton, 2002). In relation to the overall patterns of ocean circulation in the eastern Atlantic, the northern part of the west coast of the Iberian Peninsula is influenced by the subpolar branch of the Eastern North Atlantic Central Water (ENACWsp), whereas the southern upwelled waters have characteristics of the ENACW subtropical branch (Fiuza, 1984; Ríos et al., 1992). The variations in phytoplankton abundance and composition between the northern and southern 324 S. LOUREIRO et al.. part of the west coast are primarily a consequence of the distinct topography of the continental shelves and river runoff (Peliz and Fiúza, 1999). In winter, the freshwater runoff induces salinity stratification on the wider and shallower shelf of the northwest coast, favouring the development of phytoplankton blooms. The peak for seasonal phytoplankton abundance occurs in spring and summer. The summer upwelling community is composed of chain-forming diatoms such as Pseudonitzschia spp. and Chaetoceros spp. (Moita, 2001). These upwelling systems have supported an important fishery resource for the west coast of the Iberian peninsular. In the case of the Algarve, 12.1% of the total licensed fleet is located at Sagres (Martins and Carneiro, 1997; Pita et al., 2002). Furthermore, in recent years, a significant contribution to the local economy has come from the production of 300 tons of oysters at Sagres (Cachola, 1995; European Commission, 1999; pers. comm. Tessier). This aquaculture is dependent on the enrichment of the coastal waters by upwelling as there are no permanent rivers or streams in the area and the anthropogenic contribution is minimal because of the low resident population and limited agriculture. Despite the importance of the Sagres region for Portuguese fisheries and bivalve culture, studies of production and associated phytoplankton community are scarce. Villa et al. (1997) reported a peak in May and September for phytoplankton based on estimates of chlorophyll a (chl a), and maxima for zooplankton between July and September based on plankton tows. Moita et al., (1998) have observed episodic blooms of toxic dinoflagellates east of Cabo S. Vicente along the Algarve coast. Sampayo et al. (1997) have detected biotoxins, leading to the temporary closure of oyster sales from Sagres. This study was undertaken during the upwelling season, from May to September 2001, at Sagres, in order to understand the influence of the circulation and upwelling events on the local microplanktonic population and primary production. The monitoring includes several of the elements required by the European Water Framework Directive (WFD, 2000) to assess the ecological status of coastal waters including physico-chemical parameters (temperature, salinity, oxygen and transparency data) and biological parameters (composition, abundance and biomass of the phytoplanktonic community)..
(3) sm69n3323. 5/9/05. 19:13. Página 325. FIG. 1. – Location of the sampling station (S). Cabo S. Vicente (CSV), oyster aquaculture (A).. MATERIAL AND METHODS Study area The Algarve coast along southern Portugal extends between 7°20’W and 9°W, along 37°N indented by two major canyons: S. Vicente and Portimão. The west coast off Algarve has an even narrow shelf, about 10 km wide. The sampling station (Fig. 1) was 5 km east of the upwelling centre off Cabo S. Vicente, at the entrance to the Porto Baleeira at Sagres (37°00’63” N and 8°55’62”W), and 3 km west of an offshore “long-line” system for oyster culture (37°00’40”N and 8°53’75”W). Following the requirements of the Water Framework Directive (WFD, 2000), this area is classified as a mesotidal, moderately exposed, coastal water of the Atlantic type (Bettencourt et al., 2004). The location was recently selected as an intercalibration site for the Common Implementation Strategy of the WFD. Sampling The Sagres station was sampled weekly, between the end of May and the beginning of September, with an interruption of 19 days in June. Surface water was collected early in the morning, independently of the tidal phase, and filtered through a 200µm mesh size net, to select for the microplankton community and remove the larger grazing organisms and particles. Aliquots for nutrients determination were frozen at 20 ºC for later analysis of ammonium, nitrite, nitrate, phosphate, and silicate, according to the methods. described in Grasshoff et al. (1983). Chl a concentration was determined by further filtering 1 l of water sample, through a Whatman GF/F filter, for measurement with a Jasco FP-777 based on the fluorometric methods described by JGOFS (1994). Water transparency was determined by Secchidisc depth and used for the estimation of the percentage irradiation depth profile. In general, the euphotic zone (defined as the depth at which the light intensity is 1% of the intensity of the surface) was greater than the overall depth of the sample site, which averaged 20 ± 3m depending on tidal fluctuations. Water for the determination of the dissolved oxygen concentration was collected with a Niskin bottle from depths at which the light intensity was 100, 50, 25 and 10% of that at the surface. Oxygen concentrations were determined with triplicates of each sample by the Winkler method (Strickland and Parsons, 1972; Bryan et al., 1976) using a Brand microburette for the titrations and expressing the final concentrations as µM O2 (± SE). Sea surface temperature (SST) was recorded with a Tinytalk PT 100 logger attached to a “longline” for oyster culture. Total daily solar irradiance (KJ m-2) was recorded by the Portuguese Instituto de Meteorologia (IM) at the Sagres station (8°57’W, 37°00’N, 25 m). Irradiance was converted to photosynthetically available radiation (PAR) using the criteria that PAR roughly represents 45% of total solar radiation (Kirk, 1994). PAR values for the surface layer were estimated based on the equation: Iz = I0 e-k z. (1). where I0 is the incident radiation, Iz the radiation at z depth, and k the Secchi extinction coefficient (Kirk, 1994). Apart from the 24 July, temperature and salinity profiles were recorded with a Seacat SBE 19 CTD between July and the end of the survey in September. The density (σt) was calculated from temperature and salinity data according to the algorithms of Fofonoff and Millard (1983). Upwelling indices The Ekman transport of surface water was estimated according to Bakun’s (1973) method, and used as a coastal upwelling index: qx , y =. τx , y ρaCD V Vx , y = fρw fρw. (2). SAGRES: MICROPLANKTON COMPOSITION AND PRODUCTION 325.
(4) 326 S. LOUREIRO et al.. 225 279 0.1 2.4 0.2 0.4 4.3 19.3 0.1 0.4 u.d.l.* 1.52 1.2 6.2 1.0 13.2 2.4 60.6 -3.9 57.1 14.8 19.2 19 40 u.d.l.* denotes under detection limits. 7 14. 1.0±1.7 244±13 0.3±0.1 10.3±4.3 0.2±0.1 0.4±0.4 3.3±1.7 4.3±3.1 21.1±19.7 25.4±19.8 16.0±1.6 23±6 9±2. 26.6±0.4 (n=10) 25.8 26.6 35.8±0.1 (n=10) 35.7 35.9 11.3±15.3 (n=14) 8.0 12.9 min max. min max. Total. 225 8.9 0.3 2.4 0.2 0.4 5.9 16.0 0.1 0.4 0.2 0.4 1.7 4.0 1.0 6.3 2.4 19.9 -3.9 16.4 14.8 17.5 19 30 7 11. 1.2±0.9 241±10 0.3±0.1 10.2±3.8 0.3±0.1 0.3±0.1 3.1±0.9 4.1±2.0 12.6±7.7 8.5±8.0 16.2±1.1 22±5 8±2. 26.2±0.3 (n=5) 25.8 26.5 35.8±0.1 (n=5) 35.7 35.8 10.1±1.3 (n=5) 8.0 11.1 P3. 246 279 0.1 1.0 0.2 0.4 6.2 19.3 0.1 0.2 0.1 0.5 4.8 6.2 1.8 13.3 39.6 60.6 26.3 57.1 14.3 14.9 19 24 7 9. 0.6±0.4 258±15 0.3±0.1 12.7±5.9 0.2±0.1 0.3±0.2 5.6±0.6 5.5±5.2 53.0±9.9 47.5±14.5 14.6±0.3 21±3 8±1. 26.6±0.2 (n=3) 26.4 26.7 35.8±0.1 (n=3) 35.7 35.8 11.1±1.5 (n=4) 8.9 12.2 min max. min max. P2. 227 247 0.4 1.9 0.2 0.4 4.3 11.6 0.1 0.3 u.d.l.* 1.5 1.2 2.4 2.2 7.2 8.3 28.1 5.1 20.9 14.7 19.2 19 40 7 14. 1.1±0.7 237±9 0.3±0.1 8.4±3.1 0.2±0.1 0.6±0.6 1.8±0.5 3.7±2.0 16.2±8.7 12.5±7.5 17.0±1.8. SiO4µM PO43µM NO3µM NO2µM NH4+ µM Chl a µg l-1 NCP GP DCR µM O2 d-1 µM O2 d-1 µM O2 d-1 T °C Photic m. 26±9 10±3. 26.1±0.2 (n=2) 26.0 26.3 35.9±0.0 (n=2) 35.9 35.9 12.6±4.2 (n=5) 11.9 12.9. Microplankton samples were preserved with acidified Lugol’s iodine solution. Each sample was placed in a 100 ml sedimentation chamber and settled for observation with a Zeiss Axiovert 25 inverted microscope. Qualitative and quantitative analyses of the samples were based on the methods of Utermöhl (1958). Smaller cells were identified (Tomas, 1997) and counted at 400x magnification up to a total of 100 optical fields, whereas the less abundant and larger organisms were observed over. P1. Microplankton identification and carbon content. Secchi m. Production and respiration rates were estimated by the oxygen light-dark bottle technique (Strickland and Parsons, 1972). The filtered samples were siphoned carefully into 300 ml Winkler bottles with silicon tubing to reduce turbulence. Triplicates were fixed immediately for measurement of initial dissolved oxygen concentrations. Triplicates of light and dark bottles were suspended along a ‘long-line’ and incubated for 24 h, after which they were fixed. Gross production (GP), net community production (NCP) and dark community respiration (DCR) were determined from the difference between the means of the light, dark, and initial time replicates; rates are expressed as µM O2 d-1 (±SE). Rates were converted to carbon units using 1.4 as the photosynthetic quotient (Laws, 1991).. σt Kg m-3. Production and respiration rates. Sal.. where τx,y is the wind stress vector, ρa is the air density (1.22 Kg m-3), CD is an empirical dimensionless drag coefficient (1.14x10⁻³, see Large and Pond, 1982), Vx,y is the wind speed vector on the sea surface, with magnitude |V|, ƒ is the Coriolis parameter (8.78x10⁻⁵ s-1 for Sagres), and ρw is the density of seawater (~1025 Kg m-3). Wind direction and magnitude were obtained from the IM station at Sagres. The wind stress vector was divided into its two components (τx the eastward component, and τy the northward component), giving an estimation of qx and qy (m3 s-1 km-1) for Ekman transport. Positive values for qx indicate upwelling-favourable offshore Ekman transport along the south coast, whereas negative values of qx represent inshore Ekman transport on the south coast. Conversely, positive values of qy indicate downwelling on the west coast, whilst negative values of qy indicate upwelling-favourable offshore Ekman transport along the west coast.. O2 µM. Página 326. PAR 103KJm-2d-1. 19:13. Period. 5/9/05. TABLE 1. – Surface values of physical, biological, and chemical parameters (± SD); n, number of observations; min, minimum value; max, maximum value; PAR, photosynthetically available radiation; Sal., salinity; σt, density; photic = euphotic layer; T, temperature; NCP, net community production; GP, gross production; DCR, dark community respiration; chl a, chloroyphyll a concentration; NH4+, ammonium concentration; NO2, nitrite concentration; NO3, nitrate concentration; SiO4, silicate concentration; O2, oxygen concentration.. sm69n3323.
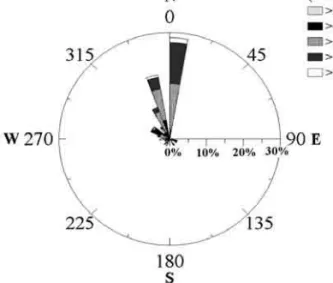
(5) sm69n3323. 5/9/05. 19:13. Página 327. the entire chamber at 100x magnification. Organisms were generally identified down to genus and whenever possible to species level; whenever this classification was not possible cells were included in wider groups (see Table 3). Cell volumes were determined by approximation to the nearest geometric shape (Hillebrand et al., 1999), and converted to biomass carbon units on the basis of formulae devised by Verity and Langdon (1984) and Verity (1992). Analysis of microplankton assemblage A statistical study of the microplankton community was completed with PRIMER© software (Plymouth Routines In Multivariate Ecological Research) for a multivariate analysis of the microplankton community. An assessment of natural groupings within the community was completed by multi-dimensional scaling (MDS) ordination using the Bray-Curtis similarity matrices of square-root abundance and biomass data. Significance tests for differences between the a priori established groups were carried out using one-way analysis of similarities (ANOSIM in Clarke and Warwick, 2001). The contribution of taxa to dissimilarities between the different periods (see results for period’s definition) were evaluated using the routine for similarity percentages (SIMPER in Clarke, 1993). The non-parametric statistical tests were done with the STATISTICA© 6 program. RESULTS Stages of the upwelling season Three periods were distinguished on the basis of the changes in SST during the survey (Table 1): period 1 (P1), from 24 May to 10 July, corresponded to a high temperature stage prior to a persistent upwelling event; period 2 (P2), from 11 July to 31 July, was marked by lower temperatures corresponding to a major upwelling event; finally, period 3 (P3), from 1 August to 3 September, corresponded to a further stage of higher temperatures. Wind and hydrographic conditions Figure 2 summarises both the speed distribution and the direction of the wind, and Figure 3b is a stick vector diagram of the time-series for coastal wind. FIG. 2. – Chart of wind direction and speed distribution (%) from May to September 2001 at Sagres.. speeds. Both figures show the prevailing northerly wind regime, from May to September, with average velocities of 6-10 m s-1. At the beginning of May (P1), favourable conditions for upwelling on the south coast (inferred by qx >0, Fig. 3a) induced a period of low SST (14ºC), followed by conditions favourable for upwelling on the west coast (inferred by qy < 0). The increasing SST by the end of May was related to a brief reversal in wind direction, leading to the replacement of cold water by warmer waters from the intrusion of the counter current from Cadiz towards the study site at Sagres. In June (P1), the generally high wind velocities and the persistent upwelling on the west coast (qy decreased to -700 m3 s-1 km-1) were linked to a decline in local SST (min. 15ºC), suggesting the influence of western, upwelled cold waters on the Sagres site. An increase in SST was recorded in the last week of June (max. 18°C), probably reflecting the relaxation of the upwelling conditions on the south coast (qx < 0) followed by the intrusion of the warmer coastal counterflow (07 and 25 June in Fig. 4). During the first few days of July (P2) an upwelling plume extended eastward from Cabo S. Vicente (03 June in Fig. 4) but had still not arrived at Sagres sampling station. In July (P2), SST reached the minimal values, associated with qx and qy favourable to offshore transport. On 11 July cold waters were mainly located south of the Cabo S. Vicente region, with a slight eastward advection extending up to Sagres (Fig. 4). During the rest of the month cold waters extended along the shelf off the Algarve. In August (P3), the SST at Sagres (Fig. 3d) reflected the variability of the wind regime with a cycle of upwelling / relaxation events with a duration. SAGRES: MICROPLANKTON COMPOSITION AND PRODUCTION 327.
(6) sm69n3323. 5/9/05. 19:13. Página 328. FIG. 3. – Temporal evolution of (a) mean weekly eastward (qx , white bar) and northward (qy, black bar) Ekman transport (m3 s-1 km-1); positive qx values indicates upwelling favourable conditions for the south coast, whereas negative qy represents upwelling favourable conditions for the west coast; (b) wind vectors time series between May and September 2001; (c) mean weekly wind speed, and (d) sea surface temperature (SST; ºC) at the sampling location. Arrows indicate sampling dates. Periods 1, 2 and 3 (P1, P2 and P3 respectively) mark stages of the upwelling season, defined according to the temperature ranges (see results).. FIG. 4. – Sea Surface Temperature (SST) satellite images (NOAA/AVHRR) from the South of Portugal (Algarve), processed at the Plymouth Marine Lab, UK. Dates are indicated in the images.. 328 S. LOUREIRO et al..
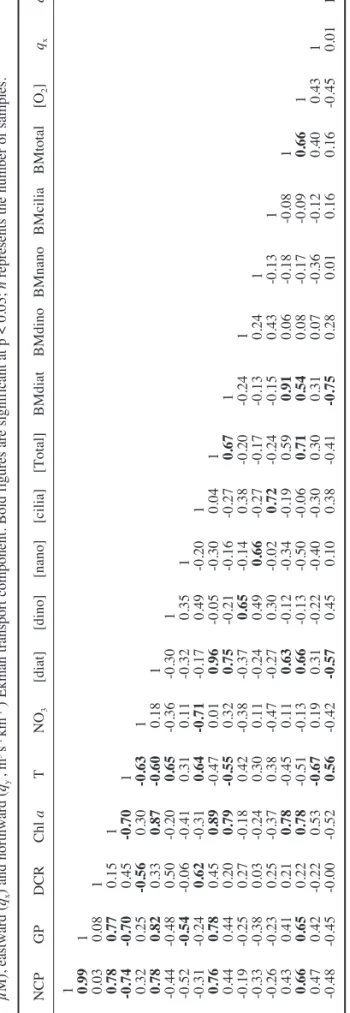
(7) 1 0.99 0.03 0.78 -0.74 0.32 0.78 -0.44 -0.52 -0.31 0.76 0.44 -0.19 -0.33 -0.26 0.43 0.66 0.47 -0.48 NCP GP DCR Chl a T NO3 [diat] [dino] [nano] [cilia] [Total] BMdiat BMdino BMnano BMcilia BMtotal [O2] qx qy. 1 0.08 0.77 -0.70 0.25 0.82 -0.48 -0.54 -0.24 0.78 0.44 -0.25 -0.38 -0.23 0.41 0.65 0.42 -0.45. 1 0.15 0.45 -0.56 0.33 0.50 -0.06 0.62 0.45 0.20 0.27 0.03 0.25 0.21 0.22 -0.22 -0.00. 1 -0.70 0.30 0.87 -0.20 -0.41 -0.31 0.89 0.79 -0.18 -0.24 -0.37 0.78 0.78 0.53 -0.52. 1 -0.63 -0.60 0.65 0.31 0.64 -0.47 -0.55 0.42 0.30 0.38 -0.45 -0.51 -0.67 0.56. 1 0.18 -0.36 0.11 -0.71 0.01 0.32 -0.38 0.11 -0.47 0.11 -0.13 0.19 -0.42. 1 -0.30 -0.32 -0.17 0.96 0.75 -0.37 -0.24 -0.27 0.63 0.66 0.31 -0.57. 1 0.35 0.49 -0.05 -0.21 0.65 0.49 0.30 -0.12 -0.13 -0.22 0.45. 1 -0.20 -0.30 -0.16 -0.14 0.66 -0.02 -0.34 -0.50 -0.40 0.10. 1 0.04 -0.27 0.38 -0.27 0.72 -0.19 -0.06 -0.30 0.38. 1 0.67 -0.20 -0.17 -0.24 0.59 0.71 0.30 -0.41. 1 -0.24 -0.13 -0.15 0.91 0.54 0.31 -0.75. 1 0.24 0.43 0.06 0.08 0.07 0.28. 1 -0.13 -0.18 -0.17 -0.36 0.01. 1 -0.08 -0.09 -0.12 0.16. 1 0.66 0.40 0.16. 1 0.43 -0.45. 1 0.01. 1. Página 329. NCP. GP. DCR. Chl a. T. NO3. [diat]. [dino]. [nano]. [cilia]. [Total]. BMdiat. BMdino BMnano BMcilia BMtotal. [O2]. qx. qy. 19:13. n = 14. 5/9/05. TABLE 2. – Spearman rank-order correlation between biological, chemical and physical parameters determined during the sampling season: net community production (NCP, µM O2 d-1), gross production (GP, µM O2 d-1), dark community respiration (DCR, µM O2 d-1), chlorophyll a concentration (Chl a, µg l-1), temperature (T, ºC), nitrate (NO3, µM), diatom ([diat]), dinoflagellate ([dino]), nanoflagellate ([nano]), ciliate ([cilia]) and total microplankton abundance ([total], x103 cell. l-1) and biomass (BMdiat, BMdino, BMnano, BMcilia, Bmtotal, µgC l-1), oxygen concentration ([O2], µM), eastward (qx) and northward (qy , m3 s-1 km-1 ) Ekman transport component. Bold figures are significant at p < 0.05; n represents the number of samples.. sm69n3323. of 14 days. Along the south continental shelf, episodes of relaxation were associated with the influence of the warm counter current. The selected SST satellite images (Fig. 4) are representative of P1 (24 May-3 July), P2 (11 July-28 August) and P3 (4 August-1 September). Local SST was negatively correlated (Spearman; p<0.05) with average weekly values for qx taken from the previous 7 days, and positively correlated with average weekly values for qy (Table 2) over the period of the survey. Overall, the upwelling events adjacent to Sagres seemed to be influenced by the interplay between water circulation driven by the winds along the west and south coasts. Time-series of depth profiles Figure 5 shows a series of depth profiles for O2 and temperature measured during the survey. 24 May - 10 July (P1). At the beginning of the study the water column was homogeneously oxygenated (248±0.3 µM O2, n = 12). On 31 May, the SST maximum was complemented by a minimal oxygen concentration at the surface (233±0.2 µM O2). In June, the two available oxygen profiles presented similar distribution patterns, and by 3 July a subsurface (9.5 m) minimal oxygen value (222±0.2 µM O2) indicated the possibility of intrusion at Sagres of oxygen-deficient, upwelled waters. 11 July - 31 July (P2). This period of matureupwelling was characterised by colder temperatures at all depths. On 11 July, the thermocline (0.2°C m–1) was at a depth of 11 m. By 18 July, the surface water was warmer, and a steeper (0.4°C m1), shallower (6 m) thermocline had developed: salinity and density (σt) profiles (Fig. 6) demonstrated a stratification on this date. However, oxygen profiles were generally homogeneous. On 31 July, high pelagic oxygen concentrations (277±2 µM O2, n = 12) probably reflected a recent active blooming phase. The pycnocline was associated with a less saline surface layer. 1 August - 3 September (P3). The oxygen decreased, as is typical of post-blooming periods. On 14 August there was an increase in surface stratification (pycnocline of 5-10 m) associated with a warmer, less saline layer. This probably reflects the intrusion of the warm coastal countercurrent coming from the Gulf of Cádiz. On 20 August there was a steep shallow thermocline (4 m), below which was a layer of both low oxygen (227±1 µM O2, n = 6) and low temperature (13.8ºC). The subsurface oxygen. SAGRES: MICROPLANKTON COMPOSITION AND PRODUCTION 329.
(8) sm69n3323. 5/9/05. 19:13. Página 330. FIG. 5. – Vertical profiles of oxygen concentrations (µM O2), and temperature ( ºC) taken from available CTD casts; when CTD casts were not available, temperature data are from a logger (see Material and Methods). Sampling date is shown on each plot. P1, P2 and P3 denote the three distinct upwelling periods.. FIG. 6. – Vertical profiles of salinity (dashed line), and density (dark line) taken from available CTD casts. Sampling date is shown on each plot. P2 and P3 denote the distinct upwelling periods.. maximum (241±0.2 µM O2) was at 3 m adjacent to the thermic surface layer. The water column temperature rose towards the end of August (max. 18°C), but declined rapidly in September (min. 16°C), reflecting the relaxation / upwelling cycles referred to previously. Physical, biological and chemical parameters Table 1 summarises the ranges of surface physical, chemical and biological parameters. PAR was high throughout the survey, with a maxima during P1 (Fig. 7b). The density attained a maximum (26.7 kg m-3) in July (P2), confirming the upwelling of denser water masses. The highest transparency val330 S. LOUREIRO et al.. ues for the water column (Fig. 7a) were recorded at the beginning of the study and on 20 August (11 m). The depth of the euphotic layer, calculated from Secchi disk data, was 19-40 m in May-June (P1). This was reduced to 19-24 m during the July (P2) upwelling/blooming event and then increased in August (P3) to 19-30 m. In May-June (P1), chla surface values averaged 1.8±0.5 µg l-1, followed by a significant increase during the July (P2; ANOVA p <0.0001, post hoc LSD Fisher test) upwelling episode (Fig. 7a), with the maximum of 6.2 µg l-1. The August (P3) decline (min. 1.7 µg l-1) was followed by a steady rise until the end of the survey, implying the development of a new bloom..
(9) sm69n3323. 5/9/05. 19:13. Página 331. FIG. 7. – Temporal distribution of surface (a) chlorophyll a concentration (µg l-1), Secchi depth (m), and (b) photosynthetically available radiation (PAR; 103 KJ m-2d-1) from 24 May to 3 September 2001 at the Sagres station.. The mean coefficient of variation (CV) for initial, “light”, and “dark” oxygen bottles was 0.56% (n = 42), 0.49% (n=42), and 0.72% (n = 42) respectively. The mean of the standard errors for primary production and respiration rates were: 0.84 µM O2 d–1 (n=14) for NCP, 1.02 µM O2 d-1 (n=14) for GP, and 1.07 µM O2 d-1 (n=14) for DCR. The distribution of production rates (Fig. 8a) exhibited a similar pattern to chl a (max. GP, 61±1.4 µM O2 d-1; NCP, 57±1.5 µM O2 d-1), although minimal values were observed in August (P3) instead of May-June (P1), both for NCP (-4±0.7 µM O2 d-1) and GP (2±0.8 µM O2 d-1). The NCP minimum corresponded to a period of net heterotrophy (negative NCP) on 14. FIG. 8. – Temporal distribution of surface (a) net community production (NCP), gross oxygen production (GP) and (b) dark community respiration (DCR) rates (µM O2 d-1), based on the light-dark bottle method, 24 h incubation, from 24 May to 3 September at the Sagres station. Bars correspond to standard errors; where the bars are not visible the data hid the small errors.. August. A high significant correlation (Spearman, p< 0.05) between production and chl a (Table 2) was observed. DCR remained low throughout the survey (Fig. 8b), reaching its peak (13±1 µMO2 d-1) on 31 July. This date marked the end of a major bloom and was concurrent with a decrease in chl a and a minimal value for PAR. Rates in carbon units averaged 180± 169 mg C m-3 d-1 for NCP, 218± 170 mg C m–3 d-1 for GP, and 37± 26 mg C m-3 d-1 for DCR (n=14). Pulses of nitrate-rich waters (> 12 µM) fertilised the surface from July to August (P2 and P3; Fig. 9a). Each pulse was followed by a decrease in concen-. FIG. 9. – Temporal surface distribution of (a) nitrate, ammonium, nitrite, (b) phosphate and silicate concentration (µM) from 24 May to 3 September at the Sagres station. SAGRES: MICROPLANKTON COMPOSITION AND PRODUCTION 331.
(10) sm69n3323. 5/9/05. 19:13. Página 332. TABLE 3. – List of identified microplankton taxa, its codes, and frequency of occurrence during the survey. Most frequent taxa (≥50%) in bold type. Code. Taxa. Bacillariophyceae (Diatoms) Centrales Ast Asteromphalus spp. Bac Bacteriastrum spp. Cha Chaetoceros spp. Cos Coscinodiscus spp. Dac Dactyliosolen spp. Det Detonula spp. Euc Eucampia spp. Gui Guinardia spp. GuiF Guinardia flaccida GuiS Guinardia striata Hem Hemiaulus spp. Lau Lauderia spp. Lep Leptocylindrus spp. Lic Licmophora spp. Melosira spp. Mel Odo Odontella spp. Rhi Rhizosolenia spp. Ske Skeletonema spp. ThaS Thalassiosira spp. DCs Small <20 µm Unidentified DCb Big >20 µm Unidentified Pennales AstP Asterionellopsis spp. Dip Diploneis bombus Fra Fragilariopsis spp. Man Manguinea spp. Meu Meuniera membranacea Nav Navicula spp. Nit Nitzschia spp. Ple Pleurosigma spp. PSN Pseudo-nitzschia spp. ThaN Thalassionema spp. DPb Big (>20 µm) Unidentified. Frequency (%). 14 21 86 36 71 36 57 64 57 21 50 93 100 43 29 57 100 57 64 79 79 Cil 21 29 29 29 29 71 100 21 93 21 71. tration, suggesting an autotrophic consumption. There was a significant negative correlation (Spearman, p< 0.05) between nitrate and SST (Table 2). Ammonium, silicate, and phosphate (Fig. 9a, b) remained low throughout the study; silicate reached a minimal value (0.1 µM) during the diatom-bloom in July (P2), and ammonium peaked twice in MayJune (P1). Surface oxygen concentrations were significantly higher (ANOVA, p = 0.041, post hoc LSD Fisher test) in July (P2; max. 281±0.2 µM O2). Microplankton abundance, biomass and composition A total of 58 microplankton taxa were identified (Table 3) during the survey. From the analysis of microplankton composition, four groups were distinguished: diatoms, dinoflagellates, ciliates, and nanoflagellates; the latter included Crytophyceae, Dictyochophyceae, and nanoflagellates. Bacillariophyceae were the best represented (32), followed by Dinophyceae (17), Ciliatae (5), Dictyochophyceae 332 S. LOUREIRO et al.. Code. Taxa. Dinophyceae (Dinoflagellates) Ale Alexandrium spp. Amp Amphidinium spp. Cer Ceratium spp. Dic Dicroerisma psilonereiella Din Dinophysis spp. Gon Gonyaulax spp. Gym Gymnodinium spp. GmGr Gymnodinium+Gyrodinium spp. Gyr Gyrodinium spp. Kat Katodinium spp. Oxy Oxytoxum spp. ProC Prorocentrum spp. ProP Protoperidinium spp. Scr Scrippsiella spp. Tor Torodinium spp. DNs Small < 20 µm Unidentified DNb Big > 20 µm Unidentified Ciliatae Hap Haptorida Mes Mesodiniidae Oli Oligotrichida Tin Tintinnina Unidentified Cryptophyceae Cry Cryptomonadales Dictyochophyceae Dic Dictyochaceae(Sillicoflagelates) Ped Pedinellaceae Nanoflagellates Nan Unidentified. Frequency (%). 14 79 79 14 57 7 86 100 86 36 7 57 93 57 36 79 36 50 57 100 36 43 86 29 36 100. (2), Cryptophyceae (1) and nanoflagellates (1). The highest occurrences (> 50%) were recorded for five diatoms (Lauderia spp., Leptocylindrus spp., Rhizosolenia spp., Nitzschia spp. and Pseudonitzschia spp.), two dinoflagellates (Gymnodinium+Gyrodinium spp., and Protoperidinium spp.), one ciliate (Oligotrichida) and the nanoflagellate group. The temporal evolution of diatom abundance (Fig. 10a) showed a similar trend to those reported for chl a and production rates, reflecting the high significant (p < 0.05) correlation between these variables (Table 2). Maximum diatom abundance was recorded in July (P2; range: 936-1366 x103 cell. l–1), and at the end of August (P3). Highest abundances for dinoflagellates were observed on 26 June (110 x103 cell. l–1) and at the end of the sampling season (> 130 x103 cell. l–1). Diatom abundance was significantly higher in July (P2; ANOVA p = 0.002, post hoc LSD Fisher), whereas dinoflagellate abundance was significantly higher in August (P3; ANOVA p = 0.02, post hoc LSD Fisher). Ciliate abundances.
(11) sm69n3323. 5/9/05. 19:13. Página 333. FIG. 10. – Temporal distribution of (a) abundance (103 cell. l-1) and (b) biomass (µgC l-1), from the identified functional groups (diat = diatoms, dino = dinoflagellates, nano = nanoflagellates, cilia = ciliates) from 24 May to 3 September 2001 at the Sagres station.. remained low (< 30 x103 cell. l–1) throughout the study, whereas nanoflagellates peaked (> 100 x103 cell. l–1) during P3, on 14 August and 3 September. Temporal variations in biomass are shown in Figure 10b: diatom biomass reached mean values of. 62±53 (n = 5), 479±238 (n =4) and 240±236 (n = 5) µgC l-1 for May-June (P1), July (P2) and August (P3) respectively. Dinoflagellate biomass reached higher values in May-June (P1) and August (P3). The contribution of nanoflagellates to the biomass was low throughout the study (maximum < 15 µgC l-1), whilst the biomass of the oligotrichida and tintinnina ciliates was dominant in May-June (P1) and August (P3). The changes in relative composition of the systematic groups in each period are evaluated in Figure 11a, b. There was a clear dominance of diatom abundance throughout the survey, reaching a peak (95%) in July (P2). May-June (P1) showed a biomass with a balanced composition of diatoms (37%), dinoflagellates (38%) and ciliates (22%). The biomass contribution of dinoflagellates in MayJune (P1) was mainly due to Protoperidinium spp. and Ceratium spp. Tintinnina and oligotrichida were confirmed as the principle contributors to the biomass of ciliates. Statistical assemblage analysis The MDS plots evidenced three distinct groupings corresponding to the May-June (P1), July (P2), and August (P3) stages, both for abundance (Fig. 12. FIG. 11. – Relative (a) abundance and (b) biomass of the microplankton groups in each period (P1, P2 and P3). Each segment represents the total percentage of the respective group (diat = diatoms, dino = dinoflagellates, nano = nanoflagellates, cilia = ciliates). SAGRES: MICROPLANKTON COMPOSITION AND PRODUCTION 333.
(12) sm69n3323. 5/9/05. 19:13. Página 334. FIG. 12. – Two dimension MDS ordination of Bray-Curtis similarities, from square root transformed abundance (a), (b) and biomass (c), (d). Numbers correspond to sampling dates (day.month). P1, P2, and P3 (the defined sampling periods) groupings are delimited on each plot.. a, b) and for biomass (Fig. 12 c, d). The global R (a statistical measure of the degree of separation of groups) resulting from the one-way ANOSIM tests for abundance data (Table 4) implied the rejection of the null hypothesis (no assemblage differences between P1, P2 and P3) at the 0.002 significance level. However, the pairwise R values (resulting from the comparison of the specific pairs of groups) TABLE 4. – One-way ANOSIM test for microplankton assemblage differences (in square root transformed abundance and biomass data) between the three a priori groups (P1, P2 and P3). Periods. R pairwise test. Possible permutations. Significance level. (a) Abundance Global R = 0.574 P1-P2 P1-P3 P2-P3. 0.563 0.368 0.825. 999 126 126 126. 0.002 0.024 0.008 0.008. (b) Biomass Global R = 0.589 P1-P2 P1-P3 P2-P3. 0.625 0.452 0.756. 999 126 126 126. 0.001 0.016 0.016 0.008. 334 S. LOUREIRO et al.. showed a weak separation (R = 0.37) between the community structures in May-June (P1) and August (P3). The May-June (P1) and July (P2) groups were significantly different (R > 0.5); finally, July (P2) and August (P3) showed a well-separated community composition for abundance (R > 0.75). Biomass followed a similar statistical pattern to the community composition. The result of SIMPER analysis is represented on Table 5. The highest average dissimilarities were found between July (P2) and August (P3) for abundance (δ = 54.45), and between May and June (P1) and July (P2) for biomass (δ = 66.01). May-June (P1) and August (P3) were the most similar periods for both abundance and biomass data, confirming the values obtained in the ANOSIM test and the MDS ordination. Chaetoceros spp., Thalassiosira spp., Lauderia spp., Detonula spp., and Pseudonitzschia spp. were the main taxa contributing to the dissimilarities between July (P2) and the other periods. Figure 13 shows the temporal distribution of the main taxa contributing to the abundance and biomass dissimilarities between the different periods..
(13) sm69n3323. 5/9/05. 19:13. Página 335. TABLE 5. – Taxa contribution (%) to the average (a) abundance and (b) biomass Bray-Curtis dissimilarity (δ), between the three defined sampling periods (P1, P2 and P3). Data were square root transformed. Taxa were selected until ~50% of the cumulative dissimilarity was attained (for taxa codes see Table 3). Taxa Code. P1 and P2 (%). Taxa Code. 16.79 7.34 5.73 5.03 3.62 3.31 3.15 3.08 2.55. Cumulative δ% 50.61. δ = 48.60 Lep Cha Rhi Ske PSN Cry DNs GmGr Gym ProC DPb. (b) Biomass δ = 66.01 Cha ThaS Gui Lau Det ProP Cos Tin Cer GuiF. 9.27 8.47 5.35 5.35 5.08 4.28 4.22 3.51 3.33 2.59. Cumulative δ% 51.44. Taxa Code. P2 and P3. Period Date. P1. (a) Abundance δ = 51.01 Cha ThaS Ske PSN Lau Det DPb Lep GuiS. P1 and P3 (%). TABLE 6. – Abundance (103 cell. l-1) of potentially HAB organisms (Hallegraeff, 1995; Pitcher and Calder, 2000; Smayda, 2000) from May to September (2001) at Sagres station. See Table 3 for taxa codes.. Rhi ProP Tin DNb GuiF Cha Cer Oli Cos DNs Lau Gui GmGr. 8.05 6.00 5.85 5.45 5.03 4.01 3.37 3.06 2.99 2.98 2.94. δ = 54.87 Cha ThaS Lep Ske PSN Rhi Lau GmGr Cry. 13.38 5.89 5.84 5.62 4.70 4.52 3.77 3.19 2.99. 49.73. 49.92. δ = 58.98. δ = 62.60. 10.12 5.54 4.42 3.78 3.72 3.54 3.40 3.28 2.93 2.89 2.78 2.64 2.60 51.64. ThaS Rhi Cha Lau Gui Det DNb Cer Cos ProP. 7.73 7.60 7.50 5.73 5.44 5.06 3.23 3.20 2.92 2.82. 51.23. P2. P3. PSN Ale 24-May 32.9 31-May 07-Jun 2.2 26-Jun 45.0 03-Jul 105.1 11-Jul 18-Jul 24-Jul 31-Jul 06-Aug 14-Aug 20-Aug 29-Aug 03-Sep. -. 76.7 104.1 128.9 71.8 7.8 29.6 11.2 4.0 0.7 22.3 209.4 -. Taxa Codes Cer Din Gon Gym ProC Scr 0.7 0.7 3.3 1.7 2.6. 0.7 0.7 1.0 2.6. 6.7 1.9 7.4 1.3 26.7 14.3 39.7 1.3. 0.7 3.6 2.4 0.7 2.3 1.9. 1.3 0.3 2.3 1.3. -. 1.3 1.7 -. 6.5 3.9 3.3 3.8 21.7 1.2 3.3 4.9 19.8 3.6 1.3 1.5 0.3 47.2 19.3 16.8 1.3 23.3 8.4. - defines no occurrence. Potentially HAB organisms Identification was mainly done down to genus level, so differentiation of harmful species within each taxa was not detected. Nevertheless, Table 6 presents the temporal distribution of algal taxa associated with harmful algal bloom (HAB) events identified during the survey at Sagres. Pseudo-nitzschia spp., a taxon that includes toxic species associated with amnesic shellfish poisoning (ASP; Bates et al., 1998), had the highest values for abundance in July (P2; 178±58 x103 cell. l-1). Water discolorations, commonly called red tides, are produced by. FIG. 13. – Temporal distribution of (a) abundance and (b) biomass of the main taxa contributing to Bray-Curtis dissimilarities between the defined sampling periods: P1, P2 and P3 (see Table 3 for taxa codes). Circles are proportional to abundance (max. 637 103 cell. l-1) and biomass (max. 390 µgC l-1) values; to avoid overlapping of circles, they represent 50% of their original size; as such, the absence of a bubble does not necessarily mean no occurrence, but that the relative abundance is low. SAGRES: MICROPLANKTON COMPOSITION AND PRODUCTION 335.
(14) sm69n3323. 5/9/05. 19:13. Página 336. Ceratium spp., Gonyaulax spp., and Scrippsiella spp., amongst other organisms (Pitcher and Calder, 2000; Smayda, 2000). These blooms, although nontoxic, are undesirable because they may cause fish and invertebrate killings due to oxygen depletion, following the decay of the blooms. Ceratium spp. occurred at low values (< 4 x10³ cell. l-1) and was basically characteristic of May-June (P1) and August (P3). Gonyaulax spp. only occurred once in May-June (P1), and Scrippsiella spp. was prominent in August (P3; 0.3-16.8 x10³ cell. l-1). Organisms with the potential to cause paralytic shellfish poisoning (PSP), such as Alexandrium spp. and Gymnodinium spp., were also recorded. Alexandrium spp. occurred only in low numbers in August, whilst Gymnodinium spp. occurred throughout the survey, with the greatest abundance in May-June (P1) and August (P3; 47 x 103 cell l-1). Dinophysis spp. and Prorocentrum spp., related to diarrhetic shellfish poisoning (DSP), were absent in July (P2), but occurred in May-June (P1) and August (P3). DISCUSSION Physical events and microplankton assemblage Although the lack of sufficient vertical data limits an understanding of the whole dynamics in threedimensions of the study site, the results show that during the upwelling season the Sagres region is influenced by the wind-driven circulation along the south and west coast, which forces cold, upwelled water into the surface layer. Upwelled water masses have characteristics of the ENACW subtropical branch (temperature > 13°C, σt < 27.1 kg m-3). These findings are consistent with the patterns already described for the Algarve coast (Fiúza, 1983, 1984; Sousa and Bricaud, 1992). Winds are mostly moderate (6-8 m s-1), and relatively intense velocities (8-10 m s-1) are only registered in July (P2), revealing a decrease in wind stress conditions in comparison with previous years (Relvas and Barton, 2002). The influence of the warm counterflow on the south coast during episodes of relaxation (Relvas and Barton, 2002) has been noticed on several occasions. Chl a peaks earlier (July) than has been reported (September) for the same area by Villa et al. (1997), probably owing to the interannual variability of physical factors (Peliz and Fiúza, 1999). The seasonal values for chl a and chemical parameters are 336 S. LOUREIRO et al.. in general agreement with the ranges described for the Cabo S. Vicente region (Moita, 2001). However, lower values of phosphate and silicate may imply the occurrence of a spring-bloom before the beginning of the survey. The maximal values for chl a (6.2 µg l-1) attained in July are similar to those reported for the upwelling regions of NW Spain – La Coruña (6.7 µg l-1 Casas et al., 1999) and Chile (6.2 µg l-1, Daneri et al., 2000), but lower than those of other upwelling systems such as Orgeon (1-57 µg l-1, Dickson and Wheeler, 1995), Benguela, NW Africa, and off Peru (5-50 µg l-1, Andrews and Hutchings, 1980; Estrada, 1974; Blasco, 1971 respectively). The lack of correlation between the Secchi-depth and chl a (Fig. 7), particularly during the bloom stage in July (P2) when Secchi values did not decrease as expected, may be due to several factors. The Secchi-disk depth is a measure of the concentration of light attenuating particles in the water column, whether from phytoplankton or non-phytoplankton sources. Factors contributing to the variation in Secchi-depth include the sun angle, sea surface reflectance and tidal height (Edmonson, 1980; Preisendorfer, 1986, Borkman and Smayda, 1998). In the current study, observations have been made independently of tidal phase. It may also be associated with variability in changes in chl a content per cell, carbon:chl a ratio, or chl a to accessory pigment ratio (Falkwoski and LaRoche, 1991). Several upwelling pulses were registered from late spring to late summer (Fig. 3). The first pulse in June (P1) fertilises the surface water with nutrients, but its evolution was not followed by this survey. A more persistent-active upwelling event develops in July (P2), fertilising the surface with concentrations of nitrate up to 19 µM. This value is higher than that reported for NW Spain (La Coruña, 9.8 µM, Casas et al., 1999; Ria de Vigo, 12 µM, Moncoiffé et al., 2000). Diatom biomass and density is dominant throughout the survey, and its temporal evolution is positively correlated (Spearman, p<0.05) with chl a and negatively correlated with SST, implying an association with cold waters supplied by upwelling. The maximal diatom abundance (1366 x103 cell. l-1) is typical for other upwelling regions (106 cell. l-1, refs. in Moita, 2001): NW Iberian-Galicia (Estrada, 1984), NW Africa (Blasco et al., 1980), Peru (Blasco, 1971) and Benguela (Giraudeau et al., 1993). The persistent diatom-chl a peak (≈ 21 days in July, P2) is related to prolonged conditions favourable to upwelling. This group is adapted to turbulent conditions (Margalef, 1978). The fact that.
(15) sm69n3323. 5/9/05. 23:51. Página 337. ammonium peaks are not coincident with oxygen minima, together with the predominance of low ammonium levels (< 0.5 µM), may imply pelagic nutrient regeneration as a secondary process during the survey period. Positively or neutrally buoyant diatoms could also partially explain the persistent bloom (refs. in Tremblay et al., 2002). The bloom collapse seems to be associated with a decrease in conditions favourable to upwelling, together with episodes of stratification in the water column, probably caused by the influence of the warm countercurrent. Nevertheless, the transition to a well-established stratified surface layer, which is a condition for the development of the classical diatom-dinoflagellate succession (Margalef, 1978), does not occur because of the fortnightly cycles of upwelling and relaxation, typical of temperate upwelling conditions (Walsh et al., 1977). Dinoflagellate abundance is positively correlated (Spearman, p<0.05) with temperature, suggesting an association with the warm waters of the countercurrent. Lingulodinium polyedrum has been described for this location by Amorim et al. (2004). Its absence from the samples in this study may be due to the sampling hour (early morning), when diel vertical migration limits its presence in surface waters, or to the inclusion of this species in higher classification groups. This species seems to be associated with coastal retention conditions in the Sagres area that may develop at times of relaxation when the cold waters are replaced by the warm waters of the countercurrent. Water retention has been reported in several upwelling areas (Graham and Largier, 1997; Demarcq and Faure, 2000; Marín et al., 2003). Coccolithophorids have been observed in the Cabo S. Vicente region (Abrantes and Moita, 1999; Cachão and Moita, 2000), but they have not been quantified because the calcareous plates may be damaged by preservation with acidic Lugol’s solution. Statistical analysis shows a distinct planktonic assemblage for the major upwelling-bloom stage (July, P2). Chaetoceros spp. (max. 567 x103 cell. l–1), Thalassiosira spp. (max. 95 x103 cell. l-1), Pseudo-nitzschia spp. (max. 129 x103 cell. l-1), Lauderia spp. (max. 67 x103 cell. l-1), and Detonula spp. (max. 53 x103 cell. l-1) are the main taxa contributing to the dissimilarities between the July (P2) upwelling-blooming period and the other sampling periods (P1 and P3). This is in agreement with Moita (2001), who classifies these taxa as coastal upwelling indicators during spring and summer for the Portuguese coast.. Potentially HAB The Pseudo-nitzschia spp. reached high abundances (171 x103 cell. l-1) during this study. Nevertheless, this taxon includes toxic and nontoxic organisms. In order to evaluate the potential harmful effects of this species, a joint study of occurrence of organisms and detection of total biotoxin and biotoxin per cell must be undertaken. In Portugal, IPIMAR is the National Reference Laboratory for biotoxins. Potentially harmful dinoflagellate taxa (Alexandrium spp., Ceratium spp., Dinophysis spp., Gonyaulax spp., Gymnodinium spp., Prorocentrum spp., and Scripsiella spp.) were also recorded. Since 1994, Gymonidinium catenatum blooms have been registered east of Cabo S. Vicente, and their presence seemed to be dependent on upwelling nutrient enrichment (Moita et al., 1998). Regarding Dinophysis spp., concentrations of < 500 cell. l-1 were already reported as agents of human intoxication in Portugal, leading to the closure of bivalve harvest (Vale, 1999). During this survey, higher concentrations were attained (max. 2600 cell. l-1). These values fall within ranges previously described for the Portuguese coast (Moita and Silva, 2000; Palma et al., 1998). In a region such as Sagres where bivalve culture occurs, precautionary closure of the zone should be carried out for abundances of 200-1000 cell. l-1 for Dinophysis spp., Gymnodinium catenatum, and Alexandrium minutum and > 100000 cell. l-1 for Pseudo-nitzschia spp. (European Commission, 2002). The closure should be maintained until the respective biotoxin analysis is found to be negative. Production and respiration rates Production maxima are attained in July, concurrent with the diatom-chl a peak. The seasonal average of volumetric GP (25.4±19.8 µM O2 d-1) is higher than for the systems of Chile (11.5 µM O2 d–1; Daneri et al., 2000), Arabian Sea (6.8 µM O2 d–1; Robinson and Williams, 1999), NW Africa and Benguela (15.2 µM O2 d-1, 14.4 µM O2 d-1 respectively, Robinson et al., 2002), but lower than for the Ría de Vigo-NW Spain area (37.3±30.7 µM O2 d-1, Moncoifée et al., 2000). DCR, on the other hand, is generally lower than reported for the above systems, representing only 17% of the GP, which reflects the predominance of the autotrophic component throughout the survey. The high significant correlations between total microplankton, chl. SAGRES: MICROPLANKTON COMPOSITION AND PRODUCTION 337.
(16) sm69n3323. 5/9/05. 19:13. Página 338. FIG. 14. – Phase plot of gross production (GP) versus respiration. Numbers indicate the temporal sequence of sampling dates (1= 24 May; 2= 31 May; 3= 7 June; 4= 26 June; 5= 3 July; 6= 11 July; 7= 18 July; 8= 24 July; 9= 31 July; 10= 6 August; 11= 14 August; 12= 20 August; 13= 29 August; 14= 3 September). P2 indicates the diatom-blooming period.. a, diatoms, production and oxygen data (Table 2) also suggest a dominant and active community of diatom-producers. Following the approach of Blight et al. (1995), GP was plotted against respiration to study the phasing of these parameters (Fig. 14). It is generally observed that the autotrophic peaks are not coupled with heterotrophic maxima, denoting a temporal lag between the two processes. This feature has been reported for other coastal areas (e.g. Blight et al., 1995; Robinson et al., 1999) and is probably associated with natural physical loss mechanisms (dispersion, sedimentation) in upwelling areas. However, from date 4-5 (May-June, P1), and date 12-13 (August, P3), the increase in GP is related to an increase in respiration rates. Although the lack of bacterioplankton data limits the interpretation of these findings, high temperatures were recorded on day 5 and 13, which usually favours picoheterotrophic activity (Wiebe et al., 1993). Additionally, on both occasions there was a peak for ciliate abundance, the best biological predictor of DCR according to Spearman’s correlation. A more efficient transfer from the auto- to the heterotrophic communities can be associated with a low molecular weight (LMW) pool of organic matter, originating from algal exudation, readily assimilated by heterotrophs (Blight et al., 1995). The autotrophic maximum (18 July) is coincident with the diatom bloom in July (P2). The heterotrophic maximum (31 July) is associated with a ciliate peak, together with a diatom maximum, a silicate minimum and a low PAR value, which sug338 S. LOUREIRO et al.. gests a co-limitation of light and nutrient on the diatom-photosynthetic rate (Kudela and Dugdale, 2000). The net heterotrophic period (NCP < 0) on 14 August occured during an episode in which nutrients were not limiting (nitrate: 8.5 µM; phosphate: 0.3 µM; silicate: 1.9 µM) but the value for PAR is low. This can be interpreted as a light limitation of the production rate (e.g. Ryther, 1956; Kirk, 1994). Cloud coverage can affect rates of production by a factor of up to 4.5 (Riegman and Colijn, 1991). Also, the decline in diatoms by this date is accompanied by an increase in the remaining functional groups (ciliate, dino- and nanoflagellate), contributing to a higher heterotrophic component. This transition period of the microplankton composition is probably associated with the intrusion of the warm coastal counterflow and the consequent stratification described above. As suggested for other systems (Moncoifée et al., 2000; Robinson et al., 2002), the observed heterotrophy could have been sustained by the accumulation of organic substrates from a recent bloom. The persistently high oxygen saturation (107%) measured at this time corroborates this hypothesis (Robinson et al., 2002). A contribution to the dissolved organic matter pool from the excretion of hanging mussels has also been reported (Álvarez-Salgado et al., 1996). CONCLUSIONS The Sagres area is subjected to the upwelling of cold waters in spring to late summer, originating in the wind-driven circulation patterns off the south and west coast. The temporal variation of these physical events regulates the influx of nutrients to the surface waters and subsequent microalgal growth, sustaining the phytoplankton biomass and production of the system. The long-lived diatom-chl a peak throughout July is probably associated with the persistence of the upwelling event. The collapse of this diatom bloom appears to be related to the decrease in upwelling conditions and the stratification of the water column, probably induced by the intrusion of the warm inshore water mass. These features imply a physical control of the biological development. Chaetoceros spp., Thalassiosira spp., Lauderia spp., Detonula spp., and Pseudo-nitzschia spp. can be considered as an upwelling proxy for this site. The progression of an upwelling / relaxation cycle determined the attained succession stage,.
(17) sm69n3323. 5/9/05. 19:13. Página 339. therefore regulating the composition of the microplankton assemblage and the subsequent nature of transfer to higher trophic levels, sediments and export. Low respiration rates (17% of GP) and uncoupling with production peaks appear to stem mainly from the interplay of the predominant autotrophic component and physical loss factors. Altogether, physical events seem to be the main factor influencing microplankton structure and production in this area. More work needs to be done to understand the whole dynamic of this ecological productive system, including water-column studies of new production, bacterial rates, regeneration processes and grazing pressure. Also, the benthic and atmospheric domain awaits further study to improve the understanding of the ecosystem behaviour. Nevertheless, the present study brings a valuable insight into the productive waters of the Sagres area. ACKNOWLEDGEMENTS We are grateful to J.-M. Novalet (Sagremarisco, Portugal) and J. Llinas (UTM, Catalunya, Spain) for their technical support and help during sampling. We thank the team of the Delegação dos Portos do Sul, Sagres, for their assistance and supply of a working space, and N. Amado for help during sampling. We thank the NERC (Natural Environment Research Council) RSDAS (Remote Sensing Data Analysis Service), hosted by the PML (Plymouth Marine Laboratory), for providing the SST satellite images, and Dr Á. Peliz (IPIMAR, Portugal) for help with the satellite data. Thanks are also due to P. Puyana and H. Martins (Uni. Algarve, Portugal) for their assistance during nutrient and chl a analysis. We thank Prof. J. Ros (Univ. Barcelona, Catalonia, Spain), Dr D. Vaqué (ICM, Catalonia, Spain) and Prof. M. Castro (Univ. Algarve, Portugal) for their scientific and statistical advice, and appreciate the help of Prof. P. Relvas (Univ. Algarve, Portugal) in the graphic representation of wind data and scientific advice. This research was partially funded by FCT (Fundação para a Ciência e a Tecnologia, Portugal) project (PRAXIS-MAR 1696-95), and an FCT grant (Praxis XXI/BD/15840/98), within the III Quadro Comunitário de Apoio by FSE and MCES, funding S. Loureiro. We would like to express our gratitude to Dr T. Moita (IPIMAR, Portugal) for the review and valuable comments that improved this manuscript.. REFERENCES Abrantes, F. and M.T. Moita. – 1999. Water column and recent sediments data on diatoms and coccolithophorids, off Portugal, confirm sediment record of upwelling events. Oceanol. Acta, 22(3): 319-336. Álvarez-Salgado, X.A., G. Rosón, F.F. Pérez, F.G. Figueiras and Y. Pazos. – 1996. Nitrogen cycling in an estuarine upwelling system, the Ria de Arousa (NW Spain) I. Short-time-scale patterns of hydrodynamic and biogeochemical circulation. Mar. Ecol. Prog. Ser., 135: 259-273. Amorim, A.J. Moita and P. Oliveira. – 2004. Dinoflagellate blooms related to coastal upwelling plumes off Portugal. Proc. of 10th Int. Conf. Harmful Algae, Florida, USA. In press. Andrews, W.R.H. and L. Hutchings. – 1980. Upwelling in the southern Benguela current. Prog. Oceanogr., 9(1): 81 pp. Bakun, A. – 1973. Coastal upwelling indices, west coast of North America, 1946-71. NOAA Tech. Rep. NMFS SSRF-671. US Dept of Commerce, Seattle: 103 pp. Barber, R.T. and R.L. Smith. – 1981. Coastal upwelling ecosystems. In: Longhurst, AR (eds.): Analysis of marine ecosystems, pp. 31-68. Academic Press, New York. Bates, S.S., D.L. Garrison and R.A. Horner. – 1998. Bloom dynamics and physiology of domoic-acid producing Pseudo-nitzschia species. In: Anderson, D.M. and A.D. Cembella (eds.): Physiological Ecology of Harmful Algal Bloom, pp. 267-292. NATO ASI Ser. 41, Springer, Berlin, Germany. Bettencourt, A.M., S.B. Bricker, J.G. Ferreira, A. Franco, J.C. Marques, J.J. Melo, A. Nobre, L. Ramos, C.S. Reis, F. Salas, M.C. Silva, T. Simas and W.J. Wolff. – 2004. Typology and Reference Conditions for Portuguese Transitional and Coastal Waters. Development of Guidelines for the Application of the European Union Water Framework Directive. INAG and IMAR, Lisbon, Portugal: 96 pp. Blasco, D. – 1971. Composition and distribution of phytoplankton in the region of upwelling off the coast of Peru. Invest. Pesq., 35: 61-112. Blasco, D., M. Estrada and B. Jones. – 1980. Relationship between the phytoplankton distribution and composition and the hydrography in the northwest African upwelling region near Cape Corbeiro. Deep-Sea Res., Part A 27: 799-821. Blight, S.P., T.L. Bentley, D. Lefèvre, C. Robinson, R. Rodrigues, J. Rowlands and P.J. leB Williams. – 1995. Phasing of autotrophic and heterotrophic plankton metabolism in a temperate coastal ecosystem. Mar. Ecol. Prog. Ser., 128: 61-75. Borkman, D.G. and T.J. Smayda. – 1998. Long-term trends in water clarity revealed by Secchi-disk measurements in lower Narragansett Bay. ICES J. Mar. Sci., 55: 668-679. Bryan, J.R., J.P. Riley and P.J. leB Williams. – 1976. A Winkler procedure for making precise measures of oxygen concentration for productivity and related studies. J. Exp. Mar. Biol. Ecol., 21: 191-197. Cachão, M. and M.T. Moita. – 2000. Coccolithus pelagicus, a productivity proxy related to moderate fronts off Western Iberia. Mar. Micropaleontol., 39(1-4): 131-155. Cachola, R. – 1995. Aquacultura «offshore» em Sagres. 8º Congresso do Algarve, Vilamoura, Portugal: 861-867. Casas, B., M. Varela, M. Canle, N. González and A. Bode. – 1997. Seasonal Variation of Nutrients, Seston and Phytoplankton, and Upwelling Intensity off La Coruña (NW Spain). Est. Coast. Shelf Sci., 44: 767-778. Casas, B., M. Varela and A. Bode. – 1999. Seasonal succession of phytoplankton species on the coast of A Coruña (Galicia, northwest Spain). Bol. Inst. Esp. Oceanogr., 15(1-4): 413-429. Clarke, K.R. and M. Ainsworth. – 1993. A method of linking multivariate community structure to environmental variables. Mar. Ecol. Prog. Ser., 92: 205-219. Clarke, K.R. and R.M. Warwick. – 2001. A further biodiversity index applicable to species lists: variation in taxonomic distinctness. Mar. Ecol. Prog. Ser., 216: 265-278. Daneri, G., V. Dellarossa, R. Quiñones, B. Jacob, P. Montero and O. Ulloa. – 2000. Primary production and community respiration in the Humboldt Current System off Chile and associated oceanic areas. Mar. Ecol. Prog. Ser., 197: 41-49. Demarcq, H. and V. Faure. – 2000. Coastal upwelling and associated retention indices derived from satellite SST. Application to Octopus vulgaris recruitment. Oceanol. Acta, 23(4): 391-408.. SAGRES: MICROPLANKTON COMPOSITION AND PRODUCTION 339.
(18) sm69n3323. 5/9/05. 19:13. Página 340. Dickson, M.L. and P.A. Wheeler. – 1995. Nitrate rates in coastal upwelling regime: a comparison on PN-specific, absolute, and Chl a-specific rates. Limnol. Oceanogr., 40(3): 533-543. Edmonson, W.T. – 1980. Secchi disk and chlorophyll. Limnol. Oceanogr., 25: 378-379. Estrada, M. – 1974. Photosynthetic pigments and productivity in the upwelling region of NW Africa. Tethys, 6: 247-260. Estrada, M. – 1984. Phytoplankton distribution and composition off the coast of Galicia (northwest Spain). J. Plankton Res., 6: 417-434. European Commission. – 1999. Report, Directive 91/494/EEC (Bivalve Molluscs) Portugal, Evaluation Mission (1219.02.1999). Directorate-General XXIV, Consumer Policy and Consumer Health Protection, 8 pp. European Commission. – 2002. Report of a mission carried out in Portugal from 21 January to 1 February 2001 regarding the implementation of Council Directive 91/493/EEC (fishery products), Council Directive 91/494/EEC (live bivalve molluscs). Health and Consumer Protection Directorate-General: 32 pp. Falkwoski, P.G. and J. LaRoche. – 1991. Acclimation to spectral irradiance in algae. J. Phycol., 27: 8-14. Fiúza, A.F.G., M.E. Macedo and M.R. Guerreiro. – 1982. Climatological space and time variation of the Portuguese coastal upwelling. Oceanol. Acta, 5(1): 31-40. Fiúza, A.F.G. – 1983. Upwelling patterns off Portugal. In: Suess, E. and J. Thiede (eds.): Coastal Upwelling: its sedimentary record. Part A. Responses of the Sedimentary Regime to Present Coast Upwelling, pp. 85-98. New York: Plenum. Fiúza, A.F.G. – 1984. Hidrologia e Dinâmica das Águas Costeiras de Portugal. PhD thesis, University of Lisbon, Portugal. Fofonoff, N.P. and R.C.J.r. Millard. – 1983. Algorithms for computation of fundamental properties of seawater. UNESCO Tech. Pap. Mar. Sci., 44: 53 pp. Graham, W.M. and J.L. Largier. – 1997. Upwelling shadows as near-shore retention sites: the example of northern Monterey Bay. Cont. Shelf Res., 17: 509-532. Giraudeau, J., P.M.S. Monteiro and K. Nikodemus. – 1993. Distribution and malformation of living coccolithophores in the northern Benguela upwelling system off Namibia. Mar. Micropaleontol., 22(1-2): 93-110. Grasshoff, K., M. Ehrhardt and K. Kremling. – 1983. Methods of Seawater Analysis. Verlag Chemie. FR Germany. Hallegraeff, G.M. – 1995. Harmful algal blooms: a global overview. In: Hallegraeff, G.M. and D.M. Anderson (eds.): Manual on Harmful Marine Microalgae, pp. 1-22. IOC Man. Guides 33 Unesco, Paris, France. Hillebrand, H., C.D. Dürselen, D. Kirschtel, U. Pollinger and T. Zohary. – 1999. Biovolume calculation for pelagic and benthic microalgae. J. Phycol., 35: 403-424. JGOFS. – 1994. Protocols for the joint global ocean flux study (JGOFS) core measurements. IOC Man. Guides, 29: 170 pp. Kirk, J.T.O. – 1994. Light and Photosynthesis in Aquatic Ecosystems, 2nd ed. Cambridge University Press, Cambridge. Kudela, R.M. and R.C. Dugdale. – 2000. Nutrient regulation of phytoplankton productivity in Monterey Bay, California. DeepSea Res., Part II 47 : 1023-1053. Large, W.G. and S. Pond. – 1982. Sensible and latent heat flux measurements over the oceans. J. Phys. Oceanogr., 12: 464-482. Laws, E.A. – 1991. Photosynthetic quotients, new production and net community production in the open ocean. Deep-Sea Res., 38: 143-167. Margalef, R. – 1978. Life-forms of phytoplankton as survival alternatives in an unstable environment. Oceanol. Acta, 1 (4): 493-509. Marín, V.H., L.E. Delgado and R. Escribano. – 2003. Upwelling shadows at Mejillones Bay (northern Chilean coast): a remote sensing in situ analysis. Inves. Mar. 31(2): 47-55. Martins, R. and M. Carneiro. – 1997. Contribuição para a caracterização da pesca artesanal local do Algarve. 9º Congresso do Algarve, Vilamoura, Portugal: 437-442. Moita, M.T., M.G. Vilarinho and A.S. Palma. – 1998. On the variability of Gymnodinium catenatum blooms in Portuguese waters. In: Reguera, B., B. Blanco and M.L. Fernández (eds.): Harmful Algae, pp. 118-121. Xunta de Galicia and IOC of UNESCO. Moita, M.T. and A.J. Silva. – 2000. Dynamics of Dinophysis acuta, D. acuminata, D. tripos and Gymnodinium catenatum during an upwelling event off the Northwest Coast of Portugal. In: Hallegraeff, G.M., S.I. Blackburn and C.J. Bolch (eds.):. 340 S. LOUREIRO et al.. Harmful Algal Blooms 2000, pp. 169-172. IOC of UNESCO. Moita, M.T. – 2001. Estrutura, Variabilidade e Dinâmica do Fitoplâncton na Costa de Portugal Continental. PhD thesis, University of Lisbon, Portugal: 272 pp. Moncoiffé, G., X.A. Álvarez-Salgado, F.G. Figueiras and G. Savidge. – 2000. Seasonal and short-time-scale dynamics of microplankton community production and respiration in an inshore upwelling system. Mar. Ecol. Prog. Ser., 196: 111-126. Nykjær, L. and L.V. Camp. – 1994. Seasonal and interannual variability of coastal upwelling along northwest Africa and Portugal from 1981 to 1991. J. Geophys. Res., 99 (C7): 14197-14207. Officer, C.B. and J.H. Ryther. – 1980. The possible importance of Silicon in marine eutrophication. Mar. Ecol. Prog. Ser., 3: 83-91. Palma, A.S., M.G. Vilarinho and M.T. Moita. – 1998. Interannual trends in the longshore variation of Dinophysis off the Portuguese Coast. In: Reguera, B., B. Blanco and M.L. Fernández (eds.): Harmful Algae, pp. 124-127. Xunta de Galicia and IOC of UNESCO. Peliz, A.J. and A.F.G. Fiúza. – 1999. Temporal and spatial variability of CZCS-derived phtyoplankton pigment concentrations off the western Iberian Peninsula. Int. J. Remote Sensing, 20(7): 1363-1403. Pita, C., A. Marques, K. Erzini, I. Noronha, D. Houlihan and M.T. Dinis. – 2002. Socio-economics of the Algarve (south of Portugal) fisheries sector. Eur. Assoc. Fish. Eco. (EAFE) Conference, Uni. Algarve, Portugal: 12 pp. Pitcher, G.C. and D. Calder. – 2000. Harmful Algal Blooms of the Southern Benguela Current: a Review and Appraisal of Monitoring from 1989 to 1997. S. Afr. J. Mar. Sci., 22: 255-271. Preisendorfer, R.W. – 1986. Secchi disk science: visual optics of natural waters. Limnol. Oceanogr., 31: 909-926. Relvas, P. and E.D. Barton. – 2002. Mesoscale patterns in the Cape São Vicente (Iberian Peninsula). J. Geophys. Res.,107(C10): 28-1-28-23. Riegman, R. and F. Colijn. – 1991. Evaluation of measurements and calculation of primary production in the Dogger Bank area (North Sea) in summer 1988. Mar. Ecol. Prog. Ser., 69: 125-132. Robinson, C. and P.J. leB Williams. – 1999. Plankton net community production and dark respiration in the Arabian Sea during September 1994. Deep-Sea Res., Part II 46: 745-765. Robinson, C., S.D. Archer and P.J. leB Williams. – 1999. Microbial dynamics in coastal waters of East Antarctica: plankton production and respiration. Mar. Ecol. Prog. Ser., 180: 23-36. Robinson, C., P. Serret, G. Tilstone, E. Teira, M.V. Zubkov, A.P. Rees and E.M.S. Woodward. – 2002. Plankton respiration in the Eastern Atlantic Ocean. Deep-Sea Res., Part I 49: 787-813. Ryther, J.H. – 1956. Photosynthesis in the Ocean as a Function of Light Intensity. Limnol. Oceanogr., 1(1): 61-70. Ríos, A.F., F.F. Pérez and F. Fraga. – 1992. Water masses in the upper and middle North Atlantic Ocean east of the Azores. Deep-Sea Res., 39(3-4): 645-658. Sampayo, M.A.M., S. Franca, I. Sousa, P. Alvito, P. Vale, M.J. Botelho, S. Rodrigues and A. Vieira. – 1997. Dez anos de monitorização de biotoxinas marinhas em Portugal (1986-1996). Arq. Inst. Nac. Saúde, 23: 187-194. Smayda, T.J. – 2000. Ecological features of harmful algal blooms in coastal upwelling ecosystems. S. Afr. J. Mar. Sci., 22: 219-253. Sousa, F.M. and A. Bricaud. – 1992. Satellite-Derived Phytoplankton Pigment Structures in the Portuguese Upwelling Area. J. Geophys. Res., 97(C7): 11343-11356. Strickland, J.D.H. and T.R. Parsons. – 1972. A practical handbook of seawater analysis. 2nd ed. Bull. Fish. Res. Board Can., 167, 310 pp. Tomas, C.R. – 1997. Identifying Marine Phytoplankton. Academic Press, London. Tremblay, J.E., Y. Gratton, J. Fauchot and N.M. Price. – 2002. Climatic and oceanic forcing of new, net, and diatom production in the North Water. Deep-Sea Res., II 49: 4927-4946. Utermöhl, H. – 1958. Zur Vervolkommnung der quantitativen Phytoplankton-Methodik. Mitt. int. Verein theor. angew. Limnol., 9: 1-38. Vale, P. – 1999. Caracterização de toxinas DSP na costa Portuguesa. PhD thesis, University of Lisbon, Portugal. Verity, P.G. and C. Langdon. – 1984. Relationships between lorica volume, carbon, nitrogen, and ATP contents of tintinnids in Narrangansett Bay. J. Plankton Res., 6: 859-868. Verity, P.G., C.Y. Robertson, C.R. Tronzo, M.G. Andrews, J.R. Nelson and M.E. Sieracki. – 1992. Relationships between cell.
(19) sm69n3323. 5/9/05. 19:13. Página 341. volume and the carbon and nitrogen content of marine photosynthetic nanoplankton. Limnol. Oceanogr., 37(7): 1434-1446. Villa, H., J. Quintela, M.L. Coelho, J.D. Icely and J.P. Andrade. – 1997. Phytoplankton biomass and zooplankton abundance on the south of Portugal (Sagres), with special reference to spawning of Loligo vulgaris. Sci. Mar., 61(2): 123-129. Walsh, J.J., T.W. Whitledge, J.C. Kelley, S.A. Huntsman and B.D. Pillsbury. – 1977. Further transition states of the Baja California upwelling ecosystem. Limnol. Oceanogr., 22: 264-280. WFD - 2000. Directive 2000/60/EC of the European Parliament and of the Council. Off. J. Eur. Comm., L 327: 1-73. Wiebe, W.J., W.M. Sheldon and L.R. Pomeroy. – 1993. Evidence for an enhanced substrate requirement by marine mesophilic bacterial isolates at minimal growth temperatures. Microb. Ecol., 25: 151-159.. Williams, P.J. leB. – 1981. Microbial contribution to overall marine plankton metabolism: direct measurements of respiration. Oceanol. Acta, 4(3): 359-363. Williams, P.J. leB. – 1984. A review of measurements of respiration rates of marine plankton populations. In: Hobbie, J.E. and P.J. Williams, leB (eds.): Heterotrophic activity in the sea, pp. 357389. Plenum Press, London. Williams, P.J. leB. – 1998. The balance of plankton respiration and photosynthesis in the open oceans. Nature, 394: 55-57. Wooster, W.S., A. Bakun and D.R. McLain. – 1976. The seasonal upwelling cycle along the eastern boundary of the North Atlantic. J. Mar. Res., (34) 2: 130-141. Scient. ed.: D. Vaqué. SAGRES: MICROPLANKTON COMPOSITION AND PRODUCTION 341.
(20) sm69n3323. 5/9/05. 19:13. Página 342.
(21)
Imagem
Documentos relacionados
Além disso, o Facebook também disponibiliza várias ferramentas exclusivas como a criação de eventos, de publici- dade, fornece aos seus utilizadores milhares de jogos que podem
Neste trabalho o objetivo central foi a ampliação e adequação do procedimento e programa computacional baseado no programa comercial MSC.PATRAN, para a geração automática de modelos
Ousasse apontar algumas hipóteses para a solução desse problema público a partir do exposto dos autores usados como base para fundamentação teórica, da análise dos dados
While Taming the Wild emphasizes relative dis/continuities in colonial versus sci- enti fic intellectual constructs of race, Racial Science and Human Diversity draws attention
The fourth generation of sinkholes is connected with the older Đulin ponor-Medvedica cave system and collects the water which appears deeper in the cave as permanent
Fig. 2 Peak-to-Average Power Ratio de um exemplo de um sinal. 3 Diagrama de blocos da arquitectura Doherty. 5 Diagrama de blocos da técnica Envelope Elimination and
Peça de mão de alta rotação pneumática com sistema Push Button (botão para remoção de broca), podendo apresentar passagem dupla de ar e acoplamento para engate rápido
Saliente-se que apenas será estudado todo o espólio exumado das fossas que correspondem a cronologias pré-históricas (4º e 3º milénio a.n.e). O Monte da Laje está inserido na
