25 The European Journal of Management
Studies is a publication of ISEG, Universidade de Lisboa. The mission of EJMS is to significantly influence the domain of management studies by publishing innovative research articles. EJMS aspires to provide a platform for thought leadership and outreach. Editors-in-Chief:
Luís M. de Castro, PhD
ISEG - Lisbon School of Economics and Management, Universidade de Lisboa, Portugal
Gurpreet Dhillon, PhD
The University of North Carolina, Greensboro, USA
Tiago Cardão-Pito, PhD
ISEG - Lisbon School of Economics and Management, Universidade de Lisboa, Portugal
Managing Editor: Mark Crathorne, MA
ISEG - Lisbon School of Economics and Management, Universidade de Lisboa, Portugal
ISSN: 2183-4172 Volume 23, Issue 1 www.european-jms.com
ARE LARGE FIRMS MORE PROFITABLE
THAN SMALL AND MEDIUM FIRMS IN
THE EUROPEAN UNION?
Cristina Gaio and Rita Henriques
ISEG – Lisbon School of Economics and Management, Universidade de Lisboa, Portugal
Abstract1
This study comparatively analyses the profitability between large enterprises (LE) and small and medium enterprises (SME) in the European Union in order to understand which group of companies is more profitable. The analysis is also segmented by groups of countries and industries. Furthermore, we study the impact of the financial crisis on profitability. The sample includes 54,654 firms from 21 EU countries and from 17 industries during the period between 2004 and 2013. Two measures of profitability are used: (1) Return on Assets (computed both with earnings before interest and taxes and net profit), and; (2) Return on Equity. The results suggest that LE are, on average, more profitable than SME. This finding holds across all industries except one. However, there is additional evidence that SME in Eastern Europe are more profitable than LE and are also more profitable than SME in Western Europe. Finally, the results also suggest that the financial crisis negatively impacted firms’ profitability, particularly in SME.
Key words: Profitability, large enterprises, small and
medium enterprises, crisis.
1We gratefully acknowledge financial support from FCT- Fundação para a Ciencia e Tecnologia (Portugal),
and national funding through the research grant UID/SOC/04521/2013. We are also thankful to Anaísa Gomes for her initial contributions for this study.
26
Introduction
Profitability is a measure of business success and an indicator of economic performance, since it has an impact on companies' ability to invest and deliver sustainable growth (Denčić-Mihajlov, 2014). Thus, the success (or even survival) of firms depends primarily on their profitability (Niresh and Velnampy, 2014) and the primary goal of most organisations is to maximise profitability. According to Ehi-Oshio et al. (2013), there are numerous factors that can influence profitability, highlighting firm size as one of them.
The overwhelming majority (99.8 %) of enterprises active within the European Union (EU)’s non-financial business economy in 2012 were small and medium enterprises (SME) - some 22.3 million. Perhaps the most striking phenomenon of SME is their contribution to employment, since they provided two-thirds of the total private sector employment in the EU. By contrast, there were 43,600 large enterprises (LE) in EU-28’s non-financial business economy in 2012. Together LE generated EUR 2.62 billion of added value, which equated to 42.5 % of the non-financial business economy total — by far the most important share among all enterprise size classes. Thus, a more comprehensive look at the association between size and profitability in EU companies during a recent time period seems relevant given both the importance of these two size classes of firms in the EU market and the uncertainty context experienced by these firms throughout the recent financial crisis. Moreover, it must be noticed that findings from existing studies differ in many respects, which suggests that there is a need for further research.
This study aims at analysing profitability in the EU market by comparing LE with SME, in order to determine which are the most profitable. A comparative analysis of the returns between LE and SME is carried out both in Eastern European and Western European contexts, as well as in different industries. The study expects to determine whether SME are more profitable in a certain region of Europe, and/or in a specific activity sector. Finally, the impact of the financial crisis on corporate profitability will be analysed.
Taking into account that the majority of previous studies focus on LE and present single-country frameworks, the novelty of this research results from both the diversity of data and the time frame covered by a financial crisis with strong economic impacts for European firms.
Covering some 54,654 large, medium and small firms from 17 industries in 21 European countries during a 10-year period (2004-2013), this study aims to contribute to a better understanding of firm-level factors as determinants of profitability, controlling for industry-specific and country-specific factors. In addition, this study intends to contribute to underline potential differences in the behaviour of SME and LE in two different institutional settings (West and East European countries) and also during a period of financial crisis.
The paper is organised as follows. In the next section, we review the theoretical aspects of profitability and firm size. In particular, we examine profitability in LE and SME as well as the most
27 common studied determinants of profitability. Still in this section, the hypotheses are developed. Section 3 describes the data, variables and the empirical setup. The empirical results are presented and discussed in light of the theoretical background in Section 4. Finally, conclusions and proposals for future research are presented in Section 5.
Literature review
The study of determinants of profitability has been considered an important research topic (Babalola, 2013). However, most studies are single-country analyses and focus only on listed companies, which are by nature larger and more successful companies, limiting the possibility of a generalised conclusion.
Earlier studies on profitability between different sized companies have produced very mixed results, leading to a lack of general consensus on how the size of firms is related to profitability. Some studies show that SME are the most profitable companies (Goddard et al., 2005; Becker-Blease et al, 2010) but other studies suggesting otherwise (Nunes et al., 2009; Denčić-Mihajlov. 2014) usually prevail. Appendix 1 summarises the main results of the previous literature.
Each study uses a different data set of firms and a different time frame, making it difficult to draw up a general statement about the relationship between profitability and firm size (Dhawan, 2001). In addition, Ehi-Oshio et al. (2013) point out that two of the possible causes for these ambiguous results are: the use of different measures of profitability, and the fact that most studies use single-country data, which may result in different conclusions as firms’ characteristics are largely determined by the business environment in which they operate.
Profitability in LE and SME
One of the pioneering studies examining the relationship between size and profitability is that of Hall and Weiss (1967), which focuses on the profitability of Fortune 500 companies. These authors conclude that LE have higher yields. This study is followed by Marcus (1969), who concludes that size influences the profitability of some, but not all, companies; therefore, rejecting the generalisation that LE are more profitable.
However, several studies conclude that size plays a notable role in explaining profitability and suggest that LE are more profitable compared to SME, particularly within the same industry (Schmalensee, 1989; Majumdar, 1997; Lee, 2009; Gaur and Gupta, 2011; Babalola, 2013; Ehi-Oshio et al., 2013; Doğan, 2013; Devi and Devi, 2014). An additional contribution comes from the research of Dahmash (2015), which highlights that size has a positive impact on profitability and that this impact differs amongst industries. These studies all focus on single-country samples and use different measures of size, namely: total assets, total sales and number of employees.
28
As suggested by Fiegenbaum and Karnani (1991), LE may be more profitable than SME due to the superior competition and strategic advantages of LE associated with a greater chance of strategic diversification and stronger bargaining power with customers and suppliers.
In contrast, there is another stream of studies that finds a negative relationship between profitability (measured in terms of return on equity and return on investment) and firm size, suggesting that SME present higher rates of profitability when compared to LE (Schneider, 1991; Goddard et al., 2005; Abu-Tapanjeh, 2006; Becker-Blease et al., 2010).
However, Stekler (1964), Samuels and Smyth (1968) and Dunlop (1992) argue that firms within the same industry may perform differently, but even then, the performance variability is lower in LE than in SME, both in terms of technical efficiency and in terms of profitability. Many reasons might explain this difference: the fact that LE are better able to withstand oscillations at the level of activity have better financial stability, face less uncertainty in terms of profit variance, and are generally more diversified, allowing them to offset the losses of one activity with profits from another (Whittington, 1980; Ballantine et al, 1993; Dhawan, 2001).
Nevertheless, Dhawan (2001) agrees that while SME face more market uncertainties and have superior capital constraints, they have higher flexibility in response to market changes and a superior efficiency rate allowing them to survive and succeed. Indeed, according to Porter (1980), technological efficiency is an important requirement for SME to be able to survive. Fiegenbaum and Karnani (1991) add the need to obtain a competitive advantage as key to survive, for instance through the adoption of niche strategies or through flexibility of their cost structure.
Finally, a third set of studies finds no statistically significant relationship between profitability and firm size (Amato and Wilder, 1985; Amato and Amato, 2004; Jónsson, 2007), concluding that there is no link between these two variables. Niresh and Velnampy (2014) point to agency problems to explain this result, since in some cases, managers’ own interests outbalance firm’s profitability.
Concerning the financial crisis impact on profitability, Denčić-Mihajlov (2014) concluded that listed LE show higher levels of profitability and liquidity during periods of economic recession. The author points out that more experienced managers, the use of new technologies and production processes and access to capital markets might be possible justifications for this positive behaviour of LE.
Determinants of profitability
In order to test the impact of size on firms’ profitability, Majumdar (1997) and Denčić-Mihajlov (2014) hold that it is necessary to take into account firm-specific factors, namely: financial structure (Abu-Tapanjeh, 2006); industry-specific factors, such as the level of concentration; threat of substitute products and services; barriers to entry and exit (Denčić-Mihajlov, 2014),
29 and; country-specific factors. Lee (2009) adds market-specific factors and company strategies to factors influencing profitability.
Amongst those determinants, firm-specific factors appear to have a much greater impact on profitability, both in LE and SME (Claver et al., 2002; Caloghirou et al., 2004; Lee, 2009). However, this is not entirely consensual, since other studies show evidence of a higher significance of industry-specific factors, especially regarding large and medium-sized firms (Amato and Amato, 2004). Included among the most used firm-specific variables that can be found are: size; leverage; liquidity; age; market share; turnover ratios, and; sales growth (Majumdar, 1997; Niresh and Velnampy, 2014; Goddard et al., 2005; Nunes et al., 2009; Doğan, 2013; Ehi-Oshio et al., 2013; Denčić-Mihajlov, 2014).
Hypotheses Development
Based on extant literature, we formulate the following hypotheses concerning the association between size and profitability of EU firms (H1 and H2).
H1: LE are more profitable than SME in EU.
This hypothesis tests the consistency of mainstream literature, which suggests that there is a statistically significant positive relationship between the size and the profitability of companies, i.e. LE have a higher profitability in comparison to SME (Schmalensee, 1989; Fiegenbaum and Karnani, 1991; Gaur and Gupta, 2009; Gaur and Gupta, 2011; Devi and Devi, 2014). Indeed, greater size allows companies greater benefits from scale economies, more efficient use of resources and greater ability to cope with changes in market conditions (Fiegenbaum et al., 1991).
H2: LE reported a lower decrease in profitability with the financial crisis.
Stekler (1964) highlights that the variability of profitability over time is inversely correlated with the size of firms. This might be explained by LE experiencing smaller relative variations in output (Schmalensee, 1989) which means that these companies contract less in recession than SME. Therefore, LE when compared to SME, are characterised by greater stability (Whittington, 1980) with higher and lower variable profitability (Dunlop, 1992).
Following Denčić-Mihajlov’s (2014) argument that LE demonstrate higher profitability during periods of recession, this hypothesis aims to test whether, indeed, large companies have better profitability management during the period of financial crisis.
30
Data and Methodology
Sample
All data were collected from the Amadeus Database. The sample period covers ten years of observation, corresponding to the time period of 2004 to 2013.
The initial selection criterion was companies belonging to the EU28, from all industries except the financial and public administration sectors, since these sectors have very particular frameworks that could bias results. Additionally, very small firms (total assets below €2,000,000 and less than 10 employees in 2013) were excluded.
Subsequently, companies that did not report full information during the sample period, as well as all companies for which it was not possible to calculate the variables under study were also excluded. As such, some countries, namely Austria, Cyprus and Denmark, were eliminated from the sample. Countries and industries with less than 10 firms were also excluded from the sample, namely Luxembourg, Malta, Bulgaria and Croatia, as well as Sector U and T.2
Finally, we excluded outliers in order to avoid biases caused by extreme values. Outliers were defined as being values below the 5% percentile and above the 95% percentile of the variables in the study.
The final sample consists of 54,654 companies, belonging to 21 EU countries and 17 industries. The sample comprises 9,784 LE and 44,870 SME, representing respectively 17.90% and 82.10% of the total sample. The 10-year period of time embraces 346,476 observations.
Appendix 2 reports the composition of the sample by country. Approximately 65% of the firms in the sample are based in Spain (28.13%), Italy (25.81%) and the United Kingdom (11.65%). In these countries, the United Kingdom is the one with the highest weight of LE (38.66%) comparing with SME, while in Italy and Spain LE account for only 15.64% and 9.48%, respectively. This trend is common to almost all EU countries where SME prevail, except for Germany and Holland. Appendix 3 shows the composition of the sample by industry. The two more representative industries are Sector C - Industrial (39.91%) and Sector G - Wholesale and retail, repair of motor vehicles and motorcycles (25.96%). Looking at industry segmentation by firm size, it is possible to conclude that SME represent an overwhelming majority in all industries except in Sector D – Electricity, gas and air conditioning where SME and LE share the market in an almost equitable way.
31
Empirical models
We use two profitability measures as dependent variables: Return on Assets (ROA) and Return on Equity (ROE). ROA is measured in two different ways:
ROA_EBIT: operational return on assets, the ratio between earnings before interest and taxes
(EBIT) and total assets (Goddard et al., 2005; Becker-Blease et al., 2010; Denčić-Mihajlov, 2014; Niresh and Velnampy, 2014; Dahmash, 2015);
ROA_NI: net return on assets, the ratio between net income (NI) and total assets (Babalola,
2013; Doğan, 2013).
ROA is a profitability measure that excludes financing decisions and it is purely based on companies’ ability to transform revenues into margins. This measure has been the most widely used in profitability studies among firms of different sizes. While LE use economies of scale through the dilution of overhead costs, SME rely more on flexibility through the adjustment of operational costs.
Thus, through these two variables it is possible to evaluate a firm’s ability to generate results from company's assets. However, the use of net profit also highlights the impact of taxation and firm’s financial choices affecting results (Hall and Weiss, 1967).
ROE is a measure of profitability from the owners' perspective, since it provides information
about the profitability of invested capital by shareholders (Abu-Tapanjeh, 2006; Jónsson, 2007). This variable is measured through the ratio between net income (NI) and owner’s equity.
To study the relationship between firm size and profitability we developed the following models:
𝑅𝑂𝐴_EBIT𝑖, = 𝛽0 + 𝛽1𝑆𝑖𝑧𝑒𝑖, + 𝛽2𝐿𝑒𝑣𝑒𝑟𝑎𝑔𝑒𝑖,𝑡 + 𝛽3𝐿𝑖𝑞𝑢𝑖𝑑𝑦𝑖,𝑡+ 𝛽4 𝐼𝑛𝑣𝑒𝑛𝑡𝑜𝑟𝑦𝑖,𝑡 + 𝛽5𝐺𝑟𝑜𝑤𝑡ℎ𝑖,𝑡 +
𝛽6𝑇𝑎𝑛𝑔𝑖𝑏𝑖𝑙𝑖𝑡𝑦𝑖,𝑡 + 𝛽7Turnover𝑖,𝑡 + 𝛽8Country𝑖 + 𝛽9𝑆𝑒𝑐𝑡𝑜𝑟𝑖 + 𝛽10Year + 𝜀𝑖,𝑡 (1)
𝑅𝑂𝐴_NI𝑖,𝑡 = 𝛽0 + 𝛽1𝑆𝑖𝑧𝑒𝑖,𝑡 + 𝛽2𝐿𝑒𝑣𝑒𝑟𝑎𝑔𝑒𝑖,𝑡 + 𝛽3𝐿𝑖𝑞𝑢𝑖𝑑𝑦𝑖,𝑡 + 𝛽4𝐼𝑛𝑣𝑒𝑛𝑡𝑜𝑟𝑦𝑖,𝑡 +
𝛽5𝐺𝑟𝑜𝑤𝑡ℎ𝑖,𝑡+ 𝛽6𝑇𝑎𝑛𝑔𝑖𝑏𝑖𝑙𝑖𝑡𝑦𝑖,𝑡+ 𝛽7Turnover𝑖,𝑡+ 𝛽8Country𝑖+ 𝛽9𝑆𝑒𝑐𝑡𝑜𝑟𝑖+ 𝛽10Year+ 𝜀𝑖,𝑡 (2)
𝑅𝑂E 𝑖, = 𝛽0 + 𝛽1𝑆𝑖𝑧𝑒𝑖, + 𝛽2𝐿𝑒𝑣𝑒𝑟𝑎𝑔𝑒𝑖, + 𝛽3𝐿𝑖𝑞𝑢𝑖𝑑𝑦𝑖, + 𝛽4𝐼𝑛𝑣𝑒𝑛𝑡𝑜𝑟𝑦𝑖,𝑡 +
𝛽5𝐺𝑟𝑜𝑤𝑡ℎ𝑖,𝑡 + 𝛽6𝑇𝑎𝑛𝑔𝑖𝑏𝑖𝑙𝑖𝑡𝑦𝑖,𝑡 + 𝛽7Turnover𝑖,𝑡 + 𝛽8Country𝑖 + 𝛽9𝑆𝑒𝑐𝑡𝑜𝑟𝑖 + 𝛽10Year + 𝜀𝑖,𝑡 (3)
where 𝑅𝑂𝐴_EBIT𝑖,𝑡 and 𝑅𝑂𝐴_NI𝑖,𝑡 are return on assets of firm i in year t, and 𝑅𝑂E𝑖,𝑡 is return on
32
Size is a dummy variable that assumes value 1 if the company is an LE, or value 0 if the company is
an SME. To measure Size, we use the most common proxy variable in the literature: total operating revenue (Abu-Tapanjeh, 2006; Ehi-Oshio et al. 2009). All companies with operating revenue in 2013 above €50,000,000 are considered LE, while all companies with operating revenue equal to or lower than €50,000,000 are deemed to be SME. If the coefficient of the Size variable is positive, this means that the level of profitability of LE is higher than SME.
Based on prior research (Goddard et al., 2005; Nunes et al., 2009; Doğan, 2013; Denčić-Mihajlov, 2014), we use the following control variables: level of debt (Leverage), level of liquidity (Liquidity), inventory weight (Inventory), growth of annual sales (Growth), asset tangibility (Tangibility) and asset turnover(Turnover). Country, Sector and Year are dummy variables. They are included in the models in order to control for the impact of the different characteristics of countries (law system, accounting practice, economic and financial development, etc.), industries (business cycle, intensity of completion, etc.) and years on profitability levels. Appendix 4 provides variable definition and measurement.
We can expect a negative relation between the levels of debt and ROA based on the general believe that higher debt levels influence performance negatively, by increasing the insolvency risk (Denčić-Mihajlov, 2014) and constraining the capacity of undertaking valuable investments (Goddard et al., 2005). On the other hand, there is theoretical support for a positive relation between leverage and ROE (Modigliani and Miller, 1958). Therefore, we expect a negative relation between leverage and ROA, but a positive one with ROE.
In terms of liquidity, various arguments support the idea that a higher level of liquidity increases profitability. Greater liquidity reduces the risk of being unable to meet short-term financial commitments (Doğan, 2013; Denčić-Mihajlov, 2014); improves the capacity to face environment changes in competitive markets (Goddard et al., 2005); and increases the ability to take advantage of good growth opportunities (Goddard et al., 2005).
Previous studies provide evidence that companies with higher levels of inventory Majumdar (1997) and tangible assets (Nunes at al., 2009) tend to be less profitable. In fact, a higher level of inventories may decrease profitability as more money is invested in inventories and less money is available to invest in business opportunities. In addition, a higher level of inventories increases the risk of stocks becoming obsolete.
Similarly, companies with higher levels of tangible assets, which mean lower levels of liquid assets, tend to be less profitable, since they are less able to explore long-term investment opportunities. Thus, we expect to find a negative coefficient on both Inventory and Tangibility.
Finally, prior research also provides evidence that sales growth and asset efficiency are positively associated with performance (Denčić-Mihajlov, 2014). Sales growth increases production levels, enhances economies of scale and thus improves profitability. Higher values of asset turnover
33 suggest better managing of company assets and consequently higher profitability. Therefore, we expect to find a positive coefficient on both Growth and Turnover.
The multiple regression models were estimated using the Ordinary Least Squares (OLS) regression method and data were formatted according to OLS pooled form (panel not balanced). Through the results of the regressions it is possible to answer Hypothesis 1. Main regressions of the study were also estimated by industry, in order to have a more detailed picture of the profitability behaviour of LE and SME.
To further explore the relationship between size and profitability, we split the sample in two groups - Western Europe and Eastern Europe - and two new variables were introduced in the basic models: the EU-Western dummy variable and the EU-Western*Crisis interaction variable, in order to verify if LE are more profitable than SME in both groups of countries, taking into account that most SME in the sample are concentrated in Western European countries. The variable EU-Western EU-Western takes the value 1 if the firm is from a Western European country, and 0 otherwise. Countries were classified as Western or Eastern European according to the UNESCO criterion.
Finally, to analyse the impact of the financial crisis on profitability of both types of companies, LE and SME, and thus test Hypothesis 2, two additional variables are considered and introduced in the basic models: the Crisis dummy variable and the Crisis*Crisis interaction variable. The variable
Crisis takes the value 1for years of crisis (2009 to 2013) and 0 if otherwise.
As a robustness analysis, we estimated all the three models by industry in order to evaluate if our main findings holds across all industries. We also removed Spanish firms, since Spain is the most represented country in the sample and presents a large imbalance between the proportion of LE and SME, and re-estimated our basic model.
Results and Discussion
Descriptive statistics
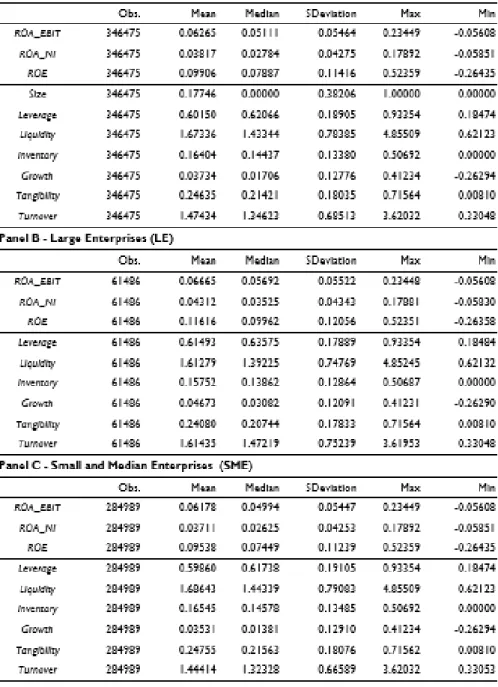
Table 1 presents the descriptive statistics of the variables for the total of the sample (Panel A) and for the two subsamples, LE and SME (Panels B and C, respectively).
In terms of the total sample (Panel A), the ROA_EBIT, ROA_NI and ROE are on average approximately 6.26%, 3.82% and 9.91%, with a median of around 5.11%, 2.78% and 7.89%, respectively. These values do not present large discrepancies, which can also be verified through the standard deviations, indicating a normal distribution of the sample.
34
On average, companies have a level of debt of approximately 60%, a liquidity of 1.67, an inventory weight of around 0.16, an annual sales growth close to 3.7%, a tangibility level of 24.6% and an asset turnover of 1.47.
Results from Panels B and C suggest that LE are more profitable than SME. In fact, results show that in all profitability variables LE present means above those of SME. However, only in the ROE variable does this difference becomes more noticeable, of approximately 2 percentage points (11.62% in LE versus 9.54% in SME). According to Samuels and Smyth (1968), this difference can be explained by the fact that LE suffer more economic pressures from shareholders towards higher profitability levels. Additionally, T-tests were performed to compare the means of profitable variables, in order to assess the statistically validity of the differences found. The results (not reported) suggest that all differences are statistically significant, conveying that LE have, on average, higher profitability levels than SME.
On average, LE show higher profitability, lower inventory weight, higher annual sales growth and greater asset turnover compared to SME. Although SME are on average less profitable, they present higher liquidity levels as well as a lower level of debt and a higher level of tangibility. These results are in line with those of Dhawan (2001), who states that SME have lower levels of debt as they operate with higher interest rates as a result of both their weaker negotiating power and their heavier financial uncertainties.
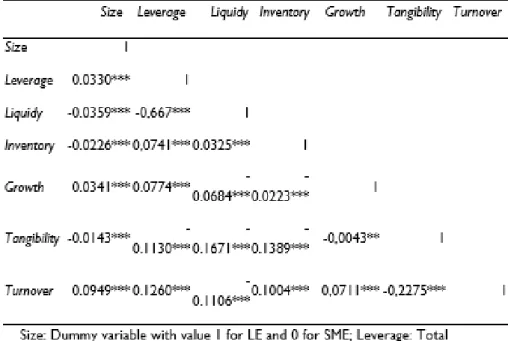
Table 2 presents the correlations between the different independent variables included in the three empirical models. All variables present a weak and statistically significant correlation with each other, except for the correlation between Growth and Tangibility, which was not statistically significant at 1%. The highest correlation (- 0.667) is between Leverage and Liquidity, which indicates that companies with higher levels of debt have lower levels of liquidity.
Results from correlations between profitability measures and independent variables (not tabulated) also suggest that companies with higher level of liquidity, higher annual sales growth, higher asset turnover and lower level of debt, less inventory weight and lower tangibility have higher ROA levels. Regarding ROE, the results suggest that more indebted companies, with higher annual sales growth, higher asset turnover, lower liquidity, less inventory weight and less tangibility are more profitable.
Profitability LE vs. SME
Table 3 shows the main results of the coefficient estimation for the three empirical models. Size has a positive and statistically significant coefficient in all models, which suggests that LE are indeed more profitable than SME. The difference between the profitability of LE and SME is more visible in ROE measure than in ROA measures, since Model 3 shows a higher coefficient for variable Size.
35 Thus, there is statistical evidence that LE are, on average, more profitable than SME, supporting H1, for both ROA and ROE measures. This result is in line with prior studies, such as that of Nunes et al. (2009), Babalola (2013), Doğan (2013) and Denčić-Mihajlov (2014). According to Fiegenbaum and Karnani (1991), this finding might be explained by the superior competition and strategic advantages of LE, associated to greater chances of strategic diversification and stronger bargaining power with customers and suppliers. In fact, LE have a larger market share and thus have the opportunity to make more profits than SME. In addition, LE are more able to take advantage of the opportunity to work in areas requiring higher capital rates, as these companies have more resources, and this gives them the opportunity to work in more profitable areas with little competition. Nunes et al. (2009) also state that potential agency problems in LE are not sufficiently relevant to reduce profitability and that, on the other hand, increasing the possibility of taking advantage of economies of scale means increasing profitability.
The control variables all have statistically significant coefficients and the expected signals. In terms of indebtedness, for each 1% increase in the level of leverage one can expect, on average, an approximate decrease of 6.16% and 7.66% in profitability for ROA_EBIT and ROA_NI measures, respectively. On the contrary, 1% increase in leverage generates, on average, an increase in ROE of 4.91%, all else unchanged. The negative relationship between the level of indebtedness and profitability (measured by ROA) is consistent with other studies (Majumdar, 1997; Goddard et al., 2005; Serrasqueiro, 2008; Doğan, 2013), showing evidence that companies with higher levels of debt are less able to finance value added projects and/or take advantage of good investment opportunities given the pressure to pay off the debt.
On the contrary, the positive relationship between leverage and the profitability (measured by ROE) follows the expected signal suggesting that companies with higher levels of debt experience increased levels of risk thus equity holders require a higher return for their investment (Modigliani and Miller, 1958).
Regarding the other control variables, companies with higher levels of inventories and tangible fixed assets have, on average, lower profitability, ceteris paribus, while companies with more liquidity, higher sales growth and higher asset turnover present higher profitability levels. For instance, when liquidity increases by 1%, profitability, on average, increases by 0.23% and 0.48% in
ROA_EBIT and ROA_NI, respectively, and 0.71% in ROE, while all others remain constant. The
distinctive impact on profitability dependent variables can be clearly observed through the annual sales growth. Although presenting a positive coefficient in all models, an increase of 1% in this independent variable results, on average, in a 5% and 7% increase in ROA_EBIT and ROA_NI, respectively, yet it represents a much more significant increase of 15% in ROE.
36
In short, the results suggest that larger companies with greater liquidity, lower inventory weight, higher annual sales growth, lower percentage of fixed assets and greater assets turnover are, on average, more profitable.
Regarding models validity, Model 2 presents the highest adjusted R2, showing that approximately
26% of the ROA_NI variation is explained by the independent variables included in the model. It is also possible to verify that the hypothesis of joint nullity of the coefficients for the independent variables can be rejected, due to a p-value of zero for the F- statistic, proving that all models are valid in explaining profitability.
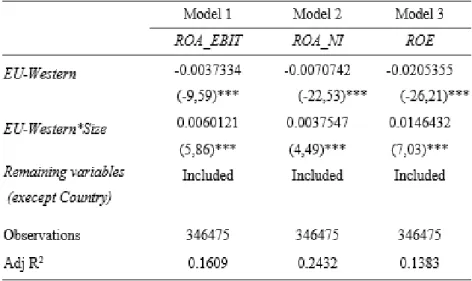
Profitability by group of countries: Western Europe and Eastern Europe
Table 4 summarises results segmented by groups of countries from Western Europe and Eastern Europe. The results suggest that in Western Europe LE are more profitable than SME, since the coefficient for EU-Western*Size is positive and statistically significant in all models. On the contrary, in Eastern European countries, SME are more profitable than LE; however, this conclusion is limited to ROA_EBIT measure, since the variable Size is only statistically significant in Model 1. Therefore, all else unchanged, ROA_EBIT of the LE is, on average, 0.0038 units lower than ROA_EBIT of SME from Eastern Europe.
It is also possible to conclude that Western European SME have, on average, lower returns than Eastern European SME, ceteris paribus, since EU-Western variable has a negative and statistically significant coefficient in all models.
Summing up, LE are indeed more profitable; however, this validity is not generalised, since SME in Eastern European countries are more profitable than their LE counterparts when profitability is measured in terms of ROA_EBIT. Furthermore, Eastern European SME are more profitable than Western European SME, even if the largest number of the European SME is based in Western Europe. This suggests that Eastern Europe has fewer SME, but clearly the more profitable ones.
Impact of the Financial Crisis on Profitability
In order to evaluate the impact of the financial crisis on the profitability of companies, we estimated all the three models considering two additional independent variables: Crisis and
Crisis*Size. Table 5 summarises the results.
The interaction variable Crisis*Crisis has a positive and statistically significant coefficient in all models, suggesting that LE present higher returns than SME during the crisis. Hence, all else unchanged, during the years of financial crisis, ROA_EBIT, ROA_NI and ROE of LE are, on average, 0.0066, 0.0039 and 0.0074 units higher than those of SME. Furthermore, the Crisis variable presents a negative and statistically significant coefficient in all models, which suggests that SME
37 during the crisis years have an ROA decrease, on average, of approximately 0.01 units, in both measures, and an ROE decrease of 0.03 units. However, LE present less significant decreases of profitability during the financial crisis (0.0083 units for ROA_EBIT, 0.0065 units for ROA_NI, and 0.0184 units for ROE).
In short, and regarding hypothesis H2, it is possible to conclude that the financial crisis affected the profitability of companies, especially SME, which present the greatest decrease in profitability between 2009 and 2013. This finding suggests that LE had a better profitability management during the financial crisis, in line with Denčić-Mihajlov’s (2014) argument about the positive association between profitability and size in periods of crisis.
Robustness analysis
ThisIn order to evaluate if our main finding - LE are, on average, more profitable than SME - holds across all industries, we estimate all the three models by industry. Results (not reported) suggest that LE have higher levels of profitability than SME for almost all sectors of activity3. Only
for Sector E (Water supply, sanitation and waste management activities) is the coefficient on Size negative, suggesting that SME, which represent about 84% of the sector, are more profitable than LE. Nevertheless, this conclusion is only valid for ROA profitability, since the coefficient in Model 3 (ROE) is not statistically significant.
As an additional robustness analysis, we estimate all the models without the most representative country - Spain - that accounts for more than 28% of the total sample. Spain has also the largest imbalance between LE and SME. The results from this analysis (not reported) are very similar to those presented in Table 3, which suggest that our mains findings are not affected. The coefficient on Size remains positive and statistically significant in all the models.4
Conclusion, Policy Implications and Future Research
We study the relationship between size and profitability by comparing the profitability of LE and SME, based on a sample of 54,654 enterprises from 21 EU countries for a period of 10 years. Taking into account that the majority of previous studies focus on LE and present a single-country framework, this study adds a relevant value based on a sample of companies from different European countries and belonging to different industries.
3 For sectors B, D, L, P and Q the coefficient on Size is not statistically significant.
4 We also estimate all the models without Italian firms since Italy is the second most representative country
38
Conclusion
Our results suggest that European LE are, on average, more profitable than SME, which is in line with prior research (Nunes et al., 2009; Doğan, 2013; Denčić-Mihajlov, 2014). We thus conclude that size affects profitability, both measured by ROA and ROE. The superior competition and strategic advantages of LE, together with greater potential for strategic diversification and stronger bargaining power with customers and suppliers potentially justify this difference.
Additional analyses on the impact of size on profitability also suggest that Eastern European SME are more profitable than their counterparts in Western Europe, and that in Western Europe, SME have higher ROA than LE. Regarding the sectoral analysis, LE are more profitable than SME in all sectors except Sector E - Water supply, sanitation and waste management activities. Finally, the results suggest that the financial crisis had a negative impact on the profitability of European companies, especially SME, as these showed a greater decrease in profitability compared to LE.
Policy implications
As there is less evidence on non-listed companies in the literature, these conclusions can be of interest for policy makers who develop alternative ways of improving profitability and performance crises. The argument that financial constraints faced by firms, especially SME, affect profitgrowthreinforcesthateasingsuchconstraintscouldbeimportantforfuturepolicyinitiatives. Although SME represent more than 99% of the economy in EU countries, recent economic literature has focused on analysing the role of the largest enterprises in order to understand economic fluctuations. In fact, large enterprises can account for a sizeable portion of a country’s economic output (Eurostat, 2015). For this reason, policy makers are often interested in understanding corporate behaviour, as corporate financial setbacks, especially in larger firms, can have severe consequences for economic activity. For this reason, it is relevant to acknowledge that large firms have faced less decrease in profitability during financial crisis in Europe.
Limitations and future research
Although all the results in the study are robust, they have some limitations. For instance, it was impossible to include industry-specific and institutional variables, used by other authors, namely: uncertainty (Ballantine et al., 1993); market share segmented by industry (Goddard et al., 2005), or, market concentration (Lee, 2009). The use of other determinants of profitability would enrich the explanation of profitability variation between large and small and medium firms. In future research, it would be of interest to get a more comprehensive view of this topic, given the scarce number of studies on the impact of size on firm’s profitability. For example, it would be interesting to analyse the impact at the fiscal level, with the aim of determining whether the results obtained in this study would remain the same for countries with a high (or low) fiscal alignment. It also would be challenging to study how earnings management practices may affect firm’s profitability and the relation between size and profitability levels.
39
Appendixes
40
41
42
43
References
Abu-Tapanjeh, A.M. (2006). An Empirical Study of Firm Structure and Profitability Relationship: The Case of Jordan. Journal of Economic and Administrative Sciences, 22(1), 41–59.
Amato, L. and Wilder, R.P. (1985). The Effects of Firm Size on Profit Rates in U.S. Manufacturing.
Southern Economic Journal, 52(1), 181–190.
Amato, L.H. and Amato, C.H. (2004). Firm size, strategic advantage, and profit rates in US retailing. Journal of Retailing and Consumer Services, 11(3), 181–193.
Babalola, Y.A. (2013). The Effect of Firm Size on Firms Profitability in Nigeria. Journal of
Econonomics and Sustainable Development, 4(5), 90–95.
Ballantine, J.W., Cleveland, F.W. and Koeller, C.T. (1993). Profitability, uncertainty, and firm size.
Small Business Economics, 5, .87–100.
Becker-Blease, J.R., Kaen, F.R., Etebari, A., and Baumann, H. (2010). Employees, firm size and profitabilityinU.S. manufacturingindustries. InvestmentManagementandFinancialInnovation, 7(2), 7–23. Caloghirou, Y., Protogerou, A., Spanos, Y., and Papagiannakis, L. (2004). Industry versus firm-specific effects on performance: Contrasting SMEs and Large-sized firms. European Management
Journal, 22(2), 231–243.
Claver, E., Molina, J. and Tarí, J. (2002). Firm and Industry Effects on Firm Profitability: A Spanish Empirical Analysis. European Management Journal, 20(3), 321–328.
Dahmash, F.N. (2015). Size Effect on Company Profitability: Evidence from Jordan. International
Journal of Business and Management, 10(2), 58–72.
Denčić-Mihajlov, K. (2014). Profitability during the Financial Crisis Evidence from the Regulated Capital Market in Serbia. South-Eastern Europe Journal of Economics, 1, 7–33.
Devi, A. and Devi, S. (2014). Determinants of Firms’ Profitability in Pakistan. Research Journal of
Finance and Accounting, 5(19), 87–92.
Dhawan, R. (2001). Firm Size and Productivity Differential: Theory and Evidence from a Panel of US Firms. Journal of Economics Behavior and Organization, 44(3), 269– 293.
Doğan, M. (2013). Does Firm Size Affect the Firm Profitability ? Evidence from Turkey. Research
Journal of Finance and Accounting, 4(4), 53–60.
Dunlop, W.C. (1992). Small/LargeFirmsinAustralianManufacturing. SmallBusinessEconomics, 4, 45–58. Ehi-Oshio, O.U., Adeyemi, A. and Enofe, A.O. (2013). Determinants of Corporate Profitability in Developing Economies. European Journal of Business and Management, 5(16), 42–51.
Eurostat (2015). Statistics on small and medium-sized enterprises. Eurostat - Statistics explained, European Commission, http://ec.europa.eu/eurostat/statistics-explained/index.php.
44
Fiegenbaum, A. and Karnani, A. (1991). Output Flexibility — A Competitive Advantage for Small Firms. Strategic Management Journal, 12,101–114.
Gaur, J. and Gupta, R. (2011). Comparing firm performance on the basis of age, size, leverage, and group affiliation in Indian IT industry. Romanian Journal of Marketing, 6(3), 8–14.
Goddard, J., Tavakoli, M. and Wilson, J.O.S. (2005). Determinants of profitability in European manufacturing and services - dynamic panel model. Applied Financial Economics, 15(18), 1269–1282. Hall, M. and Weiss, L. (1967). Firm Size and Profitability. The Review of Economics and Statistics, 49(3), 319–331.
Jónsson, B. (2007). Does the size matter? The relationship between size and profitability of Icelandic firms. Bifröst Journal of Social Science, 1, 43-56.
Lee, J. (2009). Does Size Matter in Firm Performance? Evidence from US Public Firms.
International Journal of the Economics of Business, 16(2), 189–203.
Majumdar, S.K. (1997). The impact of size and age on firm-level performance: some evidence from India. Review of Industrial Organization, 12(2), 231–241.
Marcus,M. (1969). Profitability and sizeoffirm. The Review of Economics and Statistics, 51(1), 104–107.
Modigliani, F. and Miller, M. (1958). The Cost of Capital, Corporation Finance and the Theory of Investment. American Economic Review, 48 (3), 261–297.
Niresh, J.A. and Velnampy, T. (2014). Firm Size and Profitability: A Study of Listed Manufacturing Firms in Sri Lanka. International Journal of Business and Management, 9(4), 57–64.
Nunes, P.J.M., Serrasqueiro, Z.M. and Sequeira, T.N. (2009). Profitability in Portuguese service industries: a panel data approach. The Service Industries Journal, 29(5), 693–707.
Porter, M.E. (1980). Industry Structure and Competitive Strategy: Keys in Profitability. Financial
Analysts Journal, 36(4), 335–352.
Samuels, J.M. andSmyth, D.J.(1968). Profits-VariabilityandFirmSize.Economica, NewSeries, 35, 127–139. Schmalensee, R. (1989). Intra-industry Profitability Differences in US Manufacturing 1953-1983.
The Journal of Industrial Economics, 37(4), 337–357.
Schneider, F. (1991). Efficiency and profitability: An inverse relationship according to the size of Austrian firm? Small Business Economics, 3(4), 287–296.
Serrasqueiro, Z. and Nunes, P. (2008). Performance and size: Portuguese SMEs, 31(2), 195-217. Stekler, H. O. (1964). The Variability of Profitability with Size of Firm, 1947-1958. Journal of the
American Statistical Association, 59(308), 1183–1193.
Whittington, G. (1980). The Profitability and Size of United Kingdom Companies, 1960-74. The
45
Tables
46
47
48
Table 4: Profitabilityof Western vs. Eastern Europe