Policy
ISSN: 2146-4553
available at http: www.econjournals.com
International Journal of Energy Economics and Policy, 2017, 7(3), 14-23.
Performance Assessment of Brazilian Power Transmission and
Distribution Segments using Data Envelopment Analysis
Lásara Fabrícia Rodrigues
1*, Matheus Alves Madeira de Souza
2, Thamara Paula dos Santos Dias
31Department of Production Engineering, Federal University of Ouro Preto, Minas Gerais, Brazil, 2Department of Production
Engineering, Federal University of Ouro Preto, Minas Gerais, Brazil, 3Department of Production Engineering, Federal University of Ouro Preto, Minas Gerais, Brazil. *Email: [email protected]
ABSTRACT
In this study, we conducted efficiency analyzes of both power transmission and distribution segments in Brazilian electricity sector. In order to accomplish these analyzes, data envelopment analysis-variable returns to scale models, cost analysis and window analysis approaches were carried out. The results showed that overall efficiency and stability in the distribution sector are higher than in transmission sector, which suggest that distribution companies are better managed regarding their operational costs compared to those within transmission segment. Moreover, it was accounted that approximately R$ 21 billion could have been saved if decision making units (within distribution and transmission systems) analyzed had operated with maximum level of efficiency from 2008 to 2014. Consequently, energy tariff prices paid by each consumer could have also been lower.
Keywords: Data Envelopment Analysis, Window Analysis, Power Transmission and Distribution Segments JEL Classifications: C14, C38, O13
1. INTRODUCTION
In the recent decades, important regulatory reforms have been
implemented in the electricity markets in many countries, aiming to increase the electricity sector efficiency (Çelen, 2013; Erdogdu, 2011; Nepal and Jamasb, 2015; Tovar et al., 2011). According to Erdogdu (2011), Nepal and Jamasb (2015) and Tovar et al. (2011), the reform programs include vertical separation (unbundling)
of energy industry, privatization of the electricity industry and establishment of regulatory authorities. Although, reform programs differ from one country to another and they have been accomplished without paying much attention to the institutional
environment in which they occur (Erdogdu, 2013).
In Brazil, reforms in the electricity sector have begun through the
National Privatization Program created through the Law 8,301 in 1990 (Melo et al., 2011). As a result of these reforms, the
Brazilian electricity sector was divided into: Generation, transport
(transmission and distribution), and marketing; and the National Agency of Electric Energy (ANEEL), the agent responsible for the
regulation and supervision of the electricity sector, was created.
Regarding the electricity sector in Brazil, there are 3,152 generating projects, 64 distribution companies, 77 transmission utilities and 100 marketing agents (ABRADEE, 2015). In this context, the efficiency levels which the operating activities occur impact on the tariff price (related to electricity consumption)
charged to consumers, since operating costs of companies are
taken in account to establish the prices. Thus, it becomes relevant
to assess the performance of companies within power industry. It
might be accomplished through data envelopment analysis (DEA). It is a nonparametric technique used to evaluate relative efficiency of a homogeneous set of decision making units (DMUs) through linear programming (Zanella et al., 2015). Based on input and output values, the efficient frontier is formed by the DMUs of the efficiency reference set (ERS), which are the ones with maximum level of efficiency. Thus, according to Amado et al. (2013), this technique is very effective in determining best practices and it has been extensively used for benchmarking studies.
Many applications of DEA in the electricity sector can be found in a wide variety of countries. In the generation segment, some
Fallahi et al. (2011) in Iran; Chien et al. (2007) in Taiwan; Sarica and Or (2007), Sözen et al. (2012) in Turkey; Barros (2008) in Portugal; Dedoussis et al. (2010) in Greece; Lins et al. (2012) in Brazil; Dogan and Togcu (2015) in G-20 Countries; and Grimm et al. (2016) in Europe. Regarding the power transmission and
distribution segments, there are several studies such as Lins et al.
(2007), Pessanha et al. (2010), Leme et al. (2014), Pereira de Souza et al. (2014), Costa et al. (2015), and Xavier et al. (2015) in Brazil; Khodabakhshi (2010), Sadjadi et al. (2011), Azadeh et al. (2015) and Omrani et al. (2015) in Iran; Çelen (2013) in Turkey; Amado et al. (2013) in Portugal; Meenakumari and Kamraj (2008) and Yadav et al. (2013) in India; and Kuosmanen et al. (2013) in Finland. It is
noteworthy that many studies do not specify if companies analyzed belongs to power transmission and/or distribution segment. It was considered that it is related to the electric sector characteristics in each country. Moreover, it was noted that the variable set vary
from one study to another. The choice of variables depends on the goals of each specific study, as well as the existing characteristics
of the electricity sectors of each country.
The contribution of the current work involves analyzing the efficiency of the power transmission and distribution segments
in the Brazilian electricity sector. In order to measure the
productivity, DEA-variable returns to scale (VRS) models were
applied to evaluate the performance of companies and identify
its benchmarks. An additional contribution seeks to perform a
cost analysis to identify possible cost reduction that impact on
consumer’s charges. Moreover, a window analysis (WA) approach is used to investigate variations related to efficiency levels of companies analyzed throughout years. To do so, a sample of the main 18 firms among both segments (10 distribution and 8 transmission firms) from 2008 to 2014 was employed.
This paper is organized as follows: Section 2 presents the Brazilian electric sector and Section 3 shortly describes DEA and WA techniques. Section 4 shows a case study of a sample of Brazilian electricity power transmission and distribution firms. Section 5
compares and analyzes the results obtained for the transmission
and distribution segments by the DEA-VRS models, cost analysis, as well as WA approach. Section 6 closes the paper with concluding remarks, and possible directions for further research.
2. BRAZILIAN ELECTRIC SECTOR
The Brazilian electric sector privatization process was initiated in 1990, aiming to increase investments within power industry through private capital (Melo et al., 2011; Tovar et al., 2011).
During this period, other countries, including those developed
and under development, accomplished reforms like that regarding their energy markets (Erdogdu, 2011). The main objective of these reforms was mainly to improve their power industry efficiency levels (Erdogdu, 2011; Tovar et al., 2011).
The privatization process occurred within the three segments
of Brazilian power industry: Production, transmission and distribution. Nevertheless, this process of restructuring failed to attract new investments and promote the expansion of power
industry. Moreover, in 2004, Laws No. 10,847 and No. 10,848
(through emphasis on stability and supply security in long term)
were enacted, being both responsible for setting the bases for
the current Brazilian electric sector model (Melo et al., 2011; Nagayama, 2007).
Regarding the Brazilian energy matrix, it is mainly composed of
renewable sources (Santos et al., 2013), being, according to Pao and Fu (2013), one of the cleanest in the world. In this context, hydropower plants are highlighted since they have 70% of the installed capacity of the country (ABRADEE, 2015; Santos et al., 2013) and the lowest electricity generation costs (Silva et al., 2016). Furthermore, thermoelectric power plants are also
used as a source of energy, in order to complement the generation
of hydropower plants (Nogueira et al., 2014).
After being generated, the electricity is transported via high-voltage lines. This transport of energy features the transmission segment, which encompasses a range from 230 kV and 750 kV. According to ABRADEE (2015), there are 77 utilities to perform
the energy transport and together they manage more than one
hundred thousand kilometers of lines scattered throughout Brazil. The power transmission occurs through national interconnected
system and is essential to ensure the continuous supply of electricity in the country, since it allows seasonal and regional
complementation. Transmission segment transports electrical
energy to the distribution sector, where the voltage is lowered to
<230 kV, in order to make the connection to final users. Distribution segment has 64 power distributors firms, being 60% private and 40% public, and achieved approximately 77 million “consumer units” in 2015, of which 85% are residential (ABRADEE, 2015).
In the Brazilian electricity market, the purchase and sale
negotiations occur in two environments: Regulated contracting
environment (RCE) and free contracting environment (FCE). In RCE, distribution companies buy electrical energy from sellers in public auctions under set prices. On the other hand, in FCE,
distributors are free to negotiate their own bilateral contracts with their suppliers outside auctions. In order to deal with those
environments, the chamber of electricity trading (CCEE) was created (Araújo et al., 2007; Melo et al., 2011).
All segments from generation to distribution have impact over
electricity tariff, which, according to Guardia (2007), is composed by: Transmission system usage tariff (TUST), distribution system usage tariff (TUSD), generation and commercialization tariff (TGC) and sectorial charges (SC). TUST involves costs
related to capital expenditures and remuneration, operation and
maintenance of transmission network. Thus, TUST is the sum of each component of the network costs weighted by the proportion of use of the component capacity. Regarding TUSD, it is similar to TUST, however with respect to distribution network. With respect to TGC, it is the result of a negotiation or auction, reflecting market expectations regarding the monetary value of electricity,
i.e., it already includes costs regarding capacity, fuel, operation
and maintenance of generation plants. Lastly, SC were created
by laws to enable the implementation of public policies in the
Brazilian electric sector. Their values are defined by ANEEL and
Taking in account distribution companies, their costs, according to Lino et al. (2011), are divided in non-manageable (energy purchasing, transmission costs and sectorial charges) and manageable (operation, maintenance and repair costs). It means
that the tariff paid by consumers should be enough to cover these
costs and also provide a certain level of profit (set by ANEEL) to each distribution company. The tariff price is also set by ANEEL and reviewed each 5-year period (Tovar et al., 2011). With respect to these costs, they are multiplied by the inflation index discounted by a productivity level called X factor. The discount obtained by the X factor aims to promote efficiency and share productivity gains with consumers (Lino et al., 2011; Lins et al., 2007). Based
on previous assessments regarding improvement of productivity,
ANEEL estimates the X factor for the current tariff review. So,
until the next review, if a company reduces its costs above the
expected this reduction will be added to its profit.
In addition, since 2015 electricity bills started to be based on tariff flags (Silva et al., 2016). In this scenario, the color used is responsible for indicating generation costs, i.e., non-manageable costs. Thus, green, yellow and red flags indicate that costs of generation were considered low, medium or high, in this order. The
main purpose is to aware each consumer when electricity price is higher, motivating reduction in energy consumption.
Therefore, based on all the factors involving the electricity tariff
charged to the consumer, it becomes relevant DEA application
as a methodology for efficiency assessment in this sector. Even
though the electric power system is regulated by ANEEL, it is up to companies to reduce incurred costs through a better use of
resources. It might be accomplished by taking as benchmarks those companies with high levels of efficiency. Thus, corporations within both systems (transmission and distribution) can achieve greater profitability by improving their efficiency, which will consequently
reduce the values of tariffs.
3. DEA
3.1. Brief Literature Review
DEA is a mathematical procedure initially proposed by Charnes et al. (1978) in order to assess the efficiency of DMUs in a context of constant returns to scale (CRS). Thereby, given a set of DMUs,
DEA is responsible for selecting those who play their roles more
efficiently, grouping them in ERSs. Comparisons regarding these
sets might be a manner to identify either failures or malfunctions in other DMUs, enabling improvement of activities, processes and services. Moreover, DEA provides among analysts and decision
makers opportunities of collaboration which has its definition extended, being defined, according to Sherman and Zhu (2006) as
the ratio between inputs and outputs. Nevertheless, propositions such as imperfect competition, government regulations,
financial constraints, organizations size, etc., might lead to the inapplicability of CRS models. Thus, in order to treat these issues Banker et al. (1984) adapted the CRS model to the case of VRS. Coelli et al. (2005) point out that the VRS formulation allows a DMU to take as a benchmark only those that have similar size to yours. Therefore, the projection of this DMU on the efficient frontier will be obtained through a convex combination
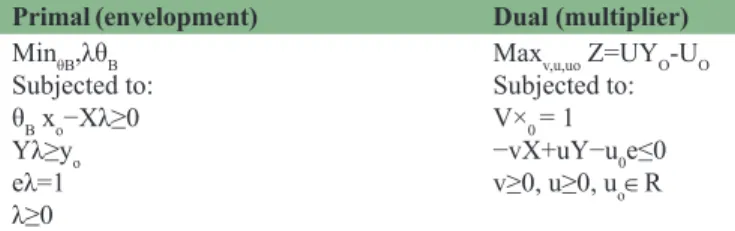
of the companies belonging to its ERS. Regarding this type of modeling, two of the most common formulations are the primal
(envelopment) and dual (multiplier). Both are presented (with input orientation) in Table 1. For a more detailed discussion of DEA models and applications, see Coelli et al. (2005), Cooper et al. (2007) and Cooper et al. (2011).
It is worth noting the importance of µ0 variable. It is responsible
for indicating if the returns to scale are: (1) Increasing (µ0 < 0): The DMU being assessed holds production levels below its optimum capacity, (2) decreasing (µ0 > 0): The DMU is operating at production levels beyond its ability or capacity, (3) constant (µ0 = 0): Any increase regarding the organizational resources, levels
of products and services will be enhanced in same proportion.
3.2. WA
In some cases, it is important to assess the efficiency of a particular DMU over a specific time period. WA is a technique which allows this kind of assessment. Thus, according to Cooper et al. (2011), for each time period (window) each DMU is treated as a different one. In accordance with Yang and Chang (2009), WA generalizes the notion of moving averages to detect efficiency trends and
stability of a DMU over time. Although, as pointed out by Asmild
et al. (2004), a window must be simultaneously small enough
to minimize abusive comparisons and large enough to have an
adequate sample size. Following Cooper et al. (2007), given a number of k periods, the length p of a window will be defined by
p
k+1
2 when k is odd k+1
when k is even = ± 2 1 2 (1)
Furthermore, the number of windows will be w = k−p+1.
4. CASE STUDY
The data used in this paper consists of a sample of Brazilian electricity power distribution and transmission firms. We selected a sample of companies that could provide results sufficiently
relevant in order to carry out further inferences regarding power
distribution and transmission systems. Thereby, the sample is composed by the 8 and 10 major companies with respect to transmission and distribution systems, respectively. The data set
constructed was based on ANEEL and Ministry of Mines and
Energy (MME) reports. They were complemented by information
provided by companies’ annual reports. Regarding the power
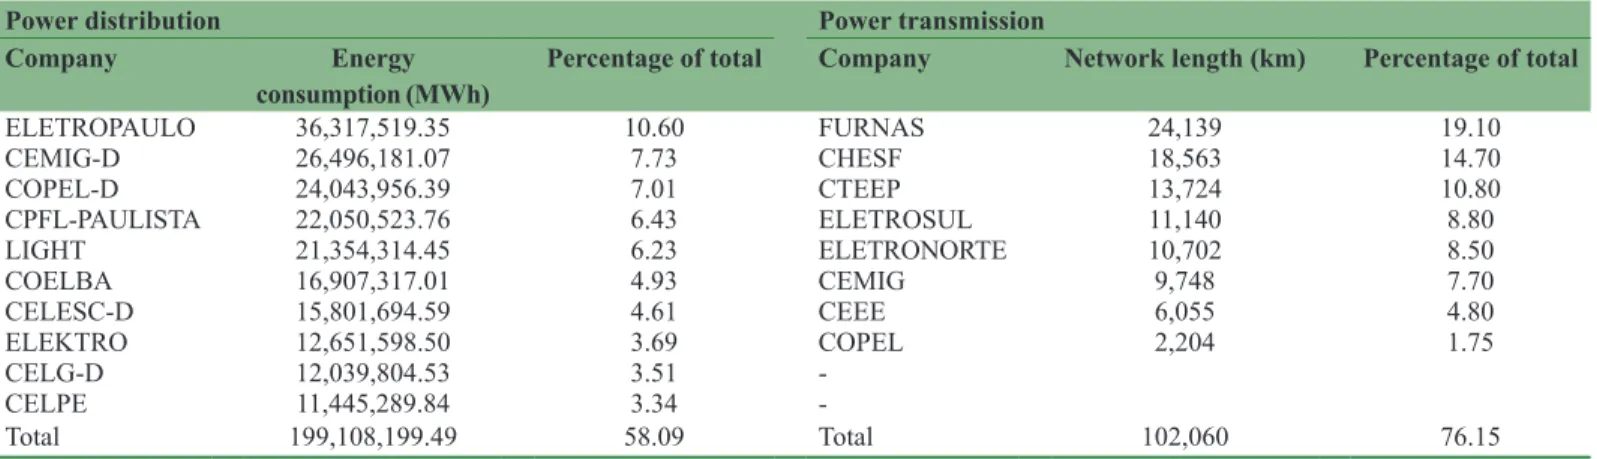
transmission system, the main selection criterion was the network length held by each organization. Thereby, the eight companies
Table 1: VRS formulations
Primal (envelopment) Dual (multiplier)
MinθB,λθB Subjected to: θB xo−Xλ≥0
Yλ≥yo
eλ=1 λ≥0
presented in Table 2 were selected. They represent together 76% of
all network length used for power transmission purposes in 2014.
With respect to the distribution system, energy consumption was
the selection criterion adopted. The 10 distribution companies
included in the study are also shown in Table 2. They correspond
to about 58% of Brazil’s energy consumption in 2014.
Regarding the choice of variables, it was carried out in accordance with the general consensus found in the current literature of
distribution systems (Costa et al., 2015; Pereira de Souza et al., 2014; Leme et al., 2014). The outputs are network extension (km), number of customers and energy consumption (MWh) and the input is operational cost (R$). With respect to power transmission system, as suggested by Pessanha et al. (2010), operating costs (R$) were taken as a single input whereas processing capacity (MVA), network length (km), number of modules and number of transformers were defined as outputs.
Even though analyzes were performed separately for each sector, results are correlated since they both impact over electricity
tariff pricing. Thus, the lower the performance of each segment, the higher will be the price paid by the final consumer. Thereby, considering the time interval from 2008 to 2014, 56 and 70 DMUs
were evaluated in power transmission and distribution systems,
respectively. According to Cooper et al. (2007), the number of DMUs should be at least equal to max {i × o, 3 (i + o)}, where i
is the number of inputs and o is the number of outputs, meaning
that for both scenarios this condition was satisfied.
5. RESULTS
This study approach includes three steps. Firstly, the VRS models
presented in Table 1 were applied for both scenarios (transmission
and distribution) in order to assess the efficiency value for each DMU. This approach differs from the one used by ANEEL
which consider non decreasing returns to scale. As discussed
by Costa et al. (2015), taking in consideration this context, VRS approaches provide a better fit. Banker (2011) has already
presented a report relating this issue but so far new methodologies approaches are still under discussion by ANEEL. Secondly, by
using the efficiency values obtained for each DMU, it was possible
to measure how much could have been saved by each company,
and consequently, to infer about potential cost impact to Brazilian
consumers. Finally, since DEA results might differ depending on the data set used, a WA approach was carried out in order to assess
the stability of efficiency values for each firm in both segments as
well, along different time intervals.
5.1. VRS Models Results
After appliance of the VRS models, efficiency values for companies within transmission and distribution systems were obtained. Furthermore, with respect to each company it was
identified those DMUs belonging to its ERS. Results regarding
transmission and distribution systems are shown in Figure 1 and 2,
respectively. The x-axis represents time in years 2008-2014, whilst the y-axis shows companies performance over this time interval.
Regarding Figure 1, six DMUs achieved maximum values of
efficiency, being symbolized by letters from A to F, as follows: A - CTEEP [2014], B - FURNAS [2014], C - FURNAS [2013], D - CEEE [2008], E - COPEL [2008], F - CTEEP [2008]. With respect to the efficiency results, FURNAS, ELETROSUL, CTEEP, COPEL and CEMIG were considered positive highlights since they either improved their efficiency or achieved high performance along the time interval considered. As contrast, CHESF, CEEE and ELETRONORTE achieved poor results since the first two showed
a performance decline and the third presented a performance
far below the average. Furthermore, FURNAS and CHESF
achieved positive values of µ0 for all years of analysis, indicating decreasing returns to scale. It suggests that if these corporations intend to expand their activities, organizational restructuring will
be required.
On the other hand, companies within distribution system presented better results since twelve DMUs achieved maximum performance, being represented by letter from A to L in Figure 2: A - ELETROPAULO [2014], B - CEMIG-D [2014],
C - CELG-D [2014], D - ELETROPAULO [2013], E - CEMIG-D [2013], F - CPFL-PAULISTA [2013], G - ELEKTRO [2013], H – ELETROPAULO [2012], I - CEMIG-D [2012], J - CELPE [2011], K - COELBA [2010], L - CELPE [2008]. With respect to efficiency results, all performances were considered satisfactory, since all companies either improved their efficiency (such as CELESC-D and CELG-D) or achieved good results along the time interval taken in account. Nevertheless, it is valid to point out that CEMIG-D, CELESC-D and COPEL-D got positive values of µ0
for all analyzes, indicating decreasing returns to scale.
Table 2: Power distribution and transmission companies
Power distribution Power transmission
Company Energy
consumption (MWh)
Percentage of total Company Network length (km) Percentage of total
ELETROPAULO 36,317,519.35 10.60 FURNAS 24,139 19.10
CEMIG-D 26,496,181.07 7.73 CHESF 18,563 14.70
COPEL-D 24,043,956.39 7.01 CTEEP 13,724 10.80
CPFL-PAULISTA 22,050,523.76 6.43 ELETROSUL 11,140 8.80
LIGHT 21,354,314.45 6.23 ELETRONORTE 10,702 8.50
COELBA 16,907,317.01 4.93 CEMIG 9,748 7.70
CELESC-D 15,801,694.59 4.61 CEEE 6,055 4.80
ELEKTRO 12,651,598.50 3.69 COPEL 2,204 1.75
CELG-D 12,039,804.53 3.51
-CELPE 11,445,289.84 3.34
Regarding both scenarios, percentages of contribution to a
corporation in a specific year is also shown and calculated as
follows:
Contribution DMUk k
i n
i
= =
∑
1
100
( ) (2)
Values of λ are those obtained through the envelopment model. In
this case, the greater the contribution of a DMUk, the greater its
organizational proximity (taking in account the other references) regarding the DMU being analyzed. Thus, taking in account the
transmission system in Figure 1, CHESF [2014], for instance,
has more similarities with CTEEP [2014] (contribution of 90%) than FURNAS [2014] (contribution of 10%). It means that, considering the efficiency frontier, CHESF [2014] is much closer to the first reference than to the second. With respect to distribution system, even though some DMUs achieved maximum efficiency,
ELETROPAULO [2014], CELG-D [2014], CEMID-D [2013] and ELETROPAULO [2012]) had no contribution to any of the others
DMUs, being part of none ERS.
5.2. Cost Analysis Results
It is also relevant to assess the operational cost reduction required for each company in order to translate it to the efficiency frontier. Calculations of new input values for inefficient DMUs might be performed by using a procedure presented by El-Mahgary and Lahdelma (1995) and expressed in a generalized form below:
xik j xij j i m
n
= = …
=
∑
( 1, , )1 (3)
In this case, the new value xik of a specific input i related to a DMUk is the summation of the same input i with respect to each DMUj (j = 1,…, n) multiplied by λj. Thus, the less the efficiency
of a DMU, the greater is the input (operational cost) reduction level required in order to make DMUk efficient.
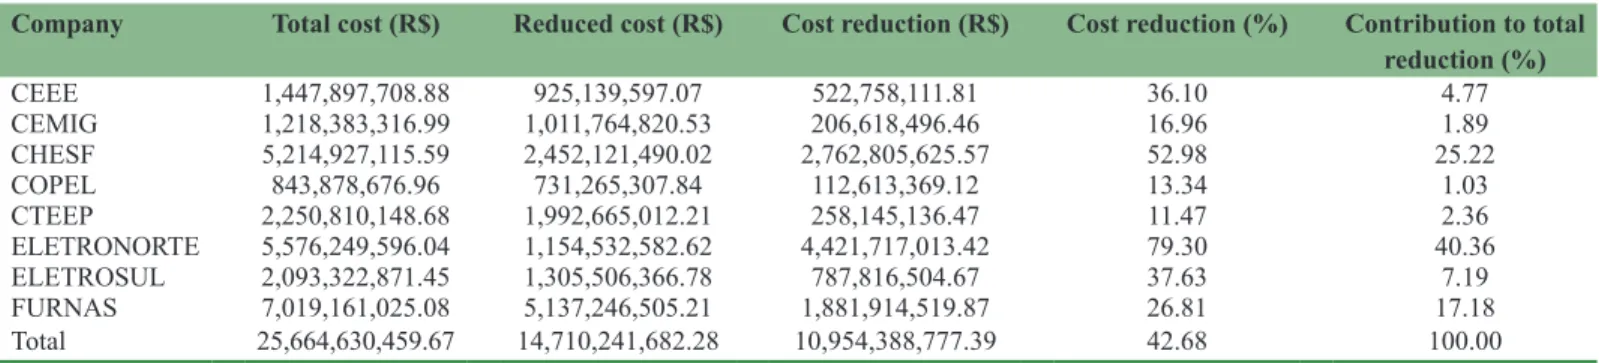
Possible costs saving for each company regarding the whole time interval are presented in Tables 3 and 4 for transmission and
distribution systems, respectively. These tables show how much
could have been saved if inefficient companies within both systems
had operated with maximum level of performance. In both tables, the values regarding each company were accounted by following:
The total cost was obtained by totaling total cost values of each
analyzed corporation, the reduced cost was calculated through
equation 3, cost reduction values were achieved by the difference
between total cost and reduced cost, the percentage reduction was the ratio between cost reduction and total cost, and the percentage of contribution to total reduction was the ratio between each company cost reduction and total cost reduction.
In transmission system, taking in account the whole time interval, the saves could achieve approximately R$ 11 billion. It means
that the low performance of certain companies represented R$
11 billion in charges (through TUST) to consumers from 2008 to 2014. Furthermore, ELETRONORTE and CHESF are both
the organizations that could have achieved higher cost reduction,
about 80% and 53%, respectively. In contrast, CTEEP and COPEL
got top levels of management regarding the relationship between inputs and outputs. Even though some organizations have shown
significant levels of possible reductions, such as CEEE and ELETROSUL, the values found have low impact over the total amount of reduction. On the other hand, ELETRONORTE, CHESF and FURNAS, accounted together approximately 83% or R$ 9
billion regarding the total cost reduction.
Similarly, regarding the distribution scenario, as presented in
Table 4, ELETROPAULO, CEMID-D, COELBA and CELPE were
considered the companies with top levels of management regarding the relationship between inputs and outputs. Analogously to the
transmission system, few companies, CELESC-D, COPEL-D, CELG-D and CEMIG-D, accounted together for approximately 67% of the total possible reduction of R$ 10.1 billion. On the other
hand, the differences between cost reduction and contribution to total reduction are in general lower than those presented for transmission system, meaning that the difference of size among companies is also lower. Furthermore, with respect to distribution
system, only 15% of costs could have been saved whilst this percentage is approximately 42% regarding transmission system. These findings suggest that even though distribution operations are the subsequent steps, they are performed with an overall efficiency
greater than those related to transmission.
5.3. WA Results
A WA approach is also performed to assess stability of results
considering different time periods (windows). Thus, taking in account (1) and a time interval of 7 years, both window length (p) and number of windows (w) are 4. It means that
four different analyses should be carried out, considering four
different time intervals (2008-2011, 2009-2012, 2010-2013, 2011-2014) for both cases (transmission and distribution). Both
results are presented in Tables 5 and 6 where AVG represents the arithmetic average of efficiencies regarding a specific corporation, considering all its results through different windows.
Furthermore, MRY indicates the maximum range for a year within the time interval of analysis whilst MR and STDV are,
Table 3: Individual transmission cost
Company Total cost (R$) Reduced cost (R$) Cost reduction (R$) Cost reduction (%) Contribution to total reduction (%)
CEEE 1,447,897,708.88 925,139,597.07 522,758,111.81 36.10 4.77
CEMIG 1,218,383,316.99 1,011,764,820.53 206,618,496.46 16.96 1.89
CHESF 5,214,927,115.59 2,452,121,490.02 2,762,805,625.57 52.98 25.22
COPEL 843,878,676.96 731,265,307.84 112,613,369.12 13.34 1.03
CTEEP 2,250,810,148.68 1,992,665,012.21 258,145,136.47 11.47 2.36
ELETRONORTE 5,576,249,596.04 1,154,532,582.62 4,421,717,013.42 79.30 40.36 ELETROSUL 2,093,322,871.45 1,305,506,366.78 787,816,504.67 37.63 7.19 FURNAS 7,019,161,025.08 5,137,246,505.21 1,881,914,519.87 26.81 17.18 Total 25,664,630,459.67 14,710,241,682.28 10,954,388,777.39 42.68 100.00
Table 4: Individual distribution cost
Company Total cost (R$) Reduced cost (R$) Cost reduction (R$) Cost reduction (%) Contribution to total reduction (%)
CELESC-D 5,993,180,380.00 3,567,826,750.90 2,425,353,629.10 40.47 24.00 CELG-D 5,509,137,770.00 3,902,334,251.37 1,606,803,518.63 29.17 15.90
CELPE 3,763,264,470.00 3,410,066,231.57 353,198,238.43 9.39 3.50
CEMIG-D 14,653,366,690.00 13,629,672,664.27 1,023,694,025.73 6.99 10.13
COELBA 5,313,644,160.00 4,925,566,304.12 388,077,855.88 7.30 3.84
COPEL-D 8,218,177,020.00 6,438,686,040.17 1,779,490,979.83 21.65 17.61 CPFL-PAULISTA 5,018,188,900.00 4,434,674,926.89 583,513,973.11 11.63 5.77 ELEKTRO 3,428,232,320.00 2,904,100,329.63 524,131,990.37 15.29 5.19 ELETROPAULO 8,603,893,490.00 8,079,786,720.68 524,106,769.32 6.09 5.19
LIGHT 5,133,147,630.00 4,236,908,993.23 896,238,636.77 17.46 8.87
Total 65,634,232,830.00 55,529,623,212.83 10,104,609,617.17 15.40 100.00
Table 5: WA for transmission system
COMPANY AVG STDV MRY MR
CEEE 0.805 0.128 0.196 0.516
CEMIG 0.902 0.099 0.132 0.302
CHESF 0.516 0.147 0.132 0.638
COPEL 0.949 0.058 0.179 0.179
CTEEP 0.968 0.051 0.130 0.194
ELETRONORTE 0.268 0.081 0.070 0.241
ELETROSUL 0.685 0.203 0.122 0.560
FURNAS 0.930 0.124 0.410 0.410
WA: Window analysis, STDV: Standard deviation, AVG: Average
Table 6: WA for distribution system
COMPANY AVG STDV MRY MR
ELETROPAULO 0.973 0.038 0.092 0.094
CEMIG-D 0.944 0.061 0.052 0.170
COPEL-D 0.816 0.041 0.042 0.157
CPFL-PAULISTA 0.922 0.068 0.108 0.180
LIGHT 0.861 0.044 0.069 0.145
COELBA 0.956 0.050 0.017 0.157
CELESC-D 0.626 0.058 0.073 0.240
ELEKTRO 0.908 0.088 0.175 0.258
CELG-D 0.776 0.131 0.324 0.379
CELPE 0.919 0.077 0.057 0.182
respectively, the maximum variation and the standard deviation, regarding all windows.
In Table 5, CTEEP held the highest efficiency average among all
companies, followed by COPEL, FURNAS, CEMIG and CEEE which also achieved high values. However, it is worth noting
that these last three organizations presented greater instability
with respect to CTEEP and COPEL, since their values of STDV were all higher. Thereby, CTEEP were considered the corporation
with both, best performance and highest stability. On the other hand, FURNAS was considered the less stable corporation
regarding a specific year, since its value of MRY was the highest.
Furthermore, with respect to all years and windows being analyzed,
ELETROSUL and CHESF were accounted as the less stable
companies, achieving high values of STDV and MR.
Regarding Table 6, ELETROPAULO achieved the best result
of overall efficiency, followed by COELBA, CEMIG-D, CPFL-PAULISTA, CELPE and ELEKTRO. In addition, ELETROPAULO was considered the corporation with greatest stability, since it achieved the lowest STDV value among all companies. On the other hand, CELG-D was considered the company with worst stability and CELESC-D the one with worst performance, since its values for STDV and AVG are the highest
and lowest, respectively. Moreover, comparing both scenarios, distribution and transmission of electrical energy, it is possible to infer that companies within distribution system presented higher stability compared to those within transmission system, since
values of STVD are overall lower. Overall efficiency can also be assessed by averaging all efficiency values for each window. As
shown in Table 7, distribution system achieved higher values of
overall efficiency regarding all windows. Those findings suggests
that in general corporations within distribution system have a better level of management regarding their operating costs than those within transmission system, verifying the results regarding cost reductions carried out previously.
6. CONCLUDING REMARKS
The objective of this paper is to analyze the performance of the
power transmission and distribution segments in the Brazilian
electricity sector. In order to assess these segments, DEA-VRS
models, cost analysis and WA approaches were carried out for both
cases. The data used in this paper consists of a sample of 18 power transmission and distribution firms of the Brazilian electricity sector over a 7-year period from 2008 to 2014.
The DEA-VRS models were used to assess the efficiency and the benchmarks for each company in transmission and distribution scenarios. The maximum value of efficiency was achieved
by six DMUs in transmission system and by twelve DMUs
in distribution system. Moreover, FURNAS and CHESF, in transmission segment, and CEMIG-D, CELESC-D and COPEL-D,
in distribution segment, presented decreasing returns to scale, indicating that those companies are operating beyond its capacity.
With respect to the cost analysis, it was calculated the reduction in operational costs in both transmission and distribution scenarios
in order to reach the efficiency frontier. The results showed that the cost reduction in the period analyzed (2008-2014) could achieve approximately R$ 21 billion, including distribution and
transmission systems, which means how much could have been saved and not charged to the costumer. Analyzing each company individually, it was calculated the percentage of cost reduction
and its contribution to total reduction. The results showed that ELETRONORTE and CHESF, in transmission system, and CELESC-D, COPEL-D and CELG-D, in distribution system, are
the companies that could have saved the greatest monetary values. Besides that, percentages of cost reduction in transmission system are higher than in distribution system, suggesting that distribution companies are better managed regarding the relationship between
inputs and outputs when they are compared to transmission firms.
Regarding the WA, the distribution systems achieved higher
values of overall efficiency as well as higher stability compared to transmission systems. Those results confirm the ones obtained
by cost analysis and also suggest that those companies have a better level of management regarding their operational costs.
Furthermore, CTEEP (transmission system) and ELETROPAULO (distribution system) are the corporations with highest stability.
Transmission and distribution segments represent an important
share in the tariff price charged to consumers. In medium and long
term, improvement of efficiency level throughout those segments
lead to reduction in consumers’ bills, which may contribute to speed up economy growth and decrease companies’ production
costs. Moreover, it is noteworthy that the significant cost reduction achieved during the analyzed period (2008-2014) regards only the
DMU sampled, which suggest that those results could be much
important taking into account all the companies in both segments (transmission and distribution).
In terms of future research, an interesting line of research would be to conduct a sensitivity analysis in order to better understand the variations within the DMU set. We also intend to use all power distribution and transmission companies and perform a segmentation of the set of distribution utilities as
well as transmission firms using cluster analysis techniques to
establish more accurate comparisons between companies. Another interesting topic for future research might be to incorporate
Table 7: Overall efficiency
Window AVG transmission AVG distribution
Window 1 2008 2009 2010 2011 0.730 0.898
Window 2 2009 2010 2011 2012 0.769 0.873
Window 3 2010 2011 2012 2013 0.768 0.842
Window 4 2011 2012 2013 2014 0.743 0.867
exogenous variables, such as rainfall, temperature and income level within the company region, in order to improve analysis
once these variables may affect the efficiency.
7. ACKNOWLEDGMENTS
The authors would like to thank the PIP/UFOP (Federal University of Ouro Preto Research Program) and FAPEMIG for their financial
support.
REFERENCES
ABRADEE. Associação Brasileira de Distribuidores de Energia Elétrica. (2015), Available from: http://www.abradee.com.br. [Last accessed on 2015 Sep 28].
Amado, C.A.F., Santos, S.P., Sequeira, J.F.C. (2013), Using data envelopment analysis to support the design of process improvement interventions in electricity distribution. European Journal of Operational Research, 228, 226-235.
ANEEL. National Agency of Electric Energy. (2015), Available from: http://www.aneel.gov.br. [Last accessed on 2015 Jun 18].
Araújo, J.L.R., Costa, A.M.A., Correia, T., Melo, E. (2007), Energy contracting in Brazil and electricity Prices, In: 30th Conference of
the International Association for Energy Economics. Wellington, Nova Zelândia.
Asmild, M., Paradi, J.C., Aggarwall, V., Schaffnit, C. (2004), Combining DEA window analysis with the Malmquist index approach in a stydy of the Canadian banking industry. Journal of Productivity Analysis, 21, 67-69.
Azadeh, A., Haghighi, S.M., Zarrin, M., Khaefi, S. (2015), Performance evaluation of Iranian electricity distribution units by using stochastic data envelopment analysis. International Journal of Electrical Power and Energy Systems, 73, 919-931.
Banker, R. (2011), Report on ANEEL’s Proposal for Electricity Distribution Tariff Regulation. Technical Note ANEEL 101/2011, Technical Report.
Banker, R.D., Charnes, A., Cooper, W.W. (1984), Some models for estimating technical and scale inefficiencies in data envelopment analysis. Management Science, 30(9), 1078-1092.
Barros, C.P. (2008), Efficiency analysis of hydroelectric generating plants: A case study for Portugal. Energy Economics, 30(1), 59-75. Çelen, A. (2013), Efficiency and productivity (TFP) of the Turkish
electricity distribution companies: An application of two-stage (DEA&Tobit) analysis. Energy Policy, 63, 300-310.
Charnes, A., Cooper, W.W., Rhodes, E. (1978), Measuring the efficiency of decision making units. European Journal of Operational Research, 2(6), 429-444.
Chien, C.F., Chen, W.C., Lo, F.Y., Lin, Y.C. (2007), A case study to evaluate the productivity changes of the thermal power plants of the Taiwan power company. IEEE Transactions on Energy Conversion, 22(3), 680-688.
Coelli, T.J., Rao, D.S.P., O’Donnell, C.J., Battese, G.E. (2005), An introduction to efficiency and productivity analysis. New York: Springer.
Cooper, W.W., Seiford, L.M., Tone, K. (2007), Data Envelopment Analysis. New York: Springer.
Cooper, W.W., Seiford, L.M., Zhu, J. (2011), Handbook on Data Envelopment Analysis. New York: Springer.
Costa, M.A., Lopes, A.L.M., Matos, G.B.B. (2015), Statistical evaluation of data envelopment analysis versus COLS Cobb–Douglas benchmarking models for the 2011 Brazilian tariff revision. Socio-Economic Planning Sciences, 49, 47-60.
Dedoussis, V., Konstas, C., Kassimis, A., Sofianopoulou, S. (2010), Efficiency evaluation of natural gas power plants using data envelopment analysis. Journal of Applied Operational Research, 2, 94-99.
Dogan, N.O., Tugcu, C.T. (2015), Energy efficiency in electricity production: A data envelopment analysis (DEA) approach for the G-20 countries. International Journal of Energy Economics and Policy, 5(1), 246-252.
El-Mahgary, S., Lahdelma, R. (1995), Data envelopment analysis: Visualizing the results. European Journal of Operations Research, 85, 700-710.
Erdogdu, E. (2011), What happened to efficiency in electricity industries after reforms? Energy Policy, 39, 6551-6560.
Erdogdu, E. (2013), A cross-country analysis of electricity market reforms: Potential contribution of New Institutional Economics. Energy Economics, 39, 239-251.
Fallahi, A., Ebrahimi, R., Ghaderi, S.F. (2011), Measuring efficiency and productivity change in power electric generation management companies by using data envelopment analysis: A case study. Energy, 36(11), 6398-6405.
Grimm, V., Martin, A., Schmidt, M., Weibelzahl, M., Zöttl, G. (2016), Transmission and generation investment in electricity markets: The effects of market splitting and network fee regimes. European Journal of Operational Research, 254, 493-509.
Guardia, E.C. (2007), Metodologia para o Cálculo da Elasticidade da Tipologia de Carga Frente a Tarifa de Energia elétrica. MSc Thesis. Universidade Federal de Itajubá, Itajubá, Brazil.
Jha, D.K., Shrestha, R. (2006), Measuring efficiency of hydropower plants in Nepal using data envelopment analysis. IEEE Transactions on Power Systems, 21(4), 1502-1511.
Khodabakhshi, M. (2010), An output oriented super-efficiency measure in stochastic data envelopment analysis: Considering Iranian electricity distribution companies. Computers and Industrial Engineering, 58(4), 663-671.
Kuosmanen, T., Saastamoinen, A., Sipiläinen, T. (2013), What is the best practice for benchmark regulation of electricity distribution? Comparison of DEA, SFA and StoNED Methods. Energy Policy, 61, 740-750.
Leme, R.C., Paiva, A.P., Santos, P.E.S., Balestrassi, P.P., Galvão, L.L. (2014), Design of experiments applied to environmental variables analysis in electricity utilities efficiency: The Brazilian case. Energy Economics, 45, 111-119.
Lino, P.R., Valenzuela, P., Ferreira, R.S., Barroso, L.A., Bezerra, B., Pereira, M.V. (2011), Energy tariff and demand response in brazil: An analysis of recent proposals from the regulator. In: IEEE PES Conference on Innovative Smart Grid Technologies (ISGT Latin America). Medellin. p1-5.
Lins, M.E., Oliveira, L.B., Silva, A.G.M., Rosa, L.P., Pereira, A.O.P.Jr. (2012), Performance assessment of alternative energy resources in Brazilian power sector using data envelopment analysis. Renewable and Sustainable Energy Reviews, 16(1), 898-903.
Lins, M.P.E., Sollero, M.K.V., Calôba, G.M., Silva, A.C.M. (2007), Integrating the regulatory and utility firm perspectives, when measuring the efficiency of electricity distribution. European Journal of Operational Research, 181, 1413-1424.
Meenakumari, R., Kamaraj, N. (2008), Measurement of relative efficiency of state owned electric utilities in India using data envelopment analysis. Modern Applied Science, 2(5), 61-71.
Melo, E., Neves, E.M.A., Pazzini, L.H.A. (2011), Brazilian Electricity Sector Restructuring: From Privatization to the New Governance Structure. Energy Market (EEM). In: 8th International Conference
on the European, Zagreb, Croatia.
mme.gov.br/. [Last accessed on 2015 Nov 25].
Nagayama, H. (2007), Effects of regulatory reforms in the electricity supply industry on electricity prices in developing countries. Energy Policy, 35, 3440-3462.
Nepal, R., Jamasb, T. (2015), Caught between theory and practice: Government, market, and regulatory failure in electricity sector reforms. Economic Analysis and Policy, 46, 16-24.
Nogueira, L.P.P., Lucena, A.F.P., Rathmann, R., Rochedo, P.R.R., Szklo, A., Schaeffer, R. (2014), Will thermal power plants with CCS play a role in Brazil’s future electric power generation? International Journal of Greenhouse Gas Control, 24, 115-123.
Omrani, H., Gharizadeh Beiragh, R., Shafiei Kaleibari, S. (2015), Performance assessment of Iranian electricity distribution companies by an integrated cooperative game data envelopment analysis principal component analysis approach. International Journal of Electrical Power and Energy Systems, 64, 617-625.
Pao, H., Fu, H. (2013), The causal relationship between energy resources and economic growth in Brazil. Energy Policy, 61, 793-801. Pereira de Souza, M.V.P., Souza, R.C., Pessanha, J.F.M., Oliveira, C.H.C.,
Diallo, M. (2014), An application of data envelopment analysis to evaluate the efficiency level of the operational cost of Brazilian electricity distribution utilities. Socio-Economic Planning Sciences, 48(3), 169-174.
Pessanha, J.F.M., Mello, M.A.R.F., Barros, M., Souza, R.C. (2010), Avaliação dos custos operacionais eficientes das empresas de transmissão do setor elétrico Brasileiro: Uma proposta de adaptação do modelo DEA adotado pela ANEEL. Pesquisa Operacional, 30(3), 521-545.
Sadjadi, S.J., Omrani, H., Shahanaghi, K. (2011), An interactive robust data envelopment analysis model for determining alternative targets in Iranian electricity distribution companies. Expert Systems with Applications, 38(8), 9830-9839.
Santos, R.L.P., Rosa, L.P., Arouca, M.C., Ribeiro, A.E.D. (2013), The importance of nuclear energy for the expansion of Brazil’s electricity grid. Energy Policy, 60, 284-289.
Sarica, K., Or, I. (2007), Efficiency assessment of Turkish power plants using data envelopment analysis. Energy, 32, 1484-1499.
Sherman, H.D., Zhu, J. (2006), Service Productivity Management: Improving Service Performance using Data Envelopment Analysis (DEA). New York: Springer.
Silva, R.C., Marchi Neto, I., Seifert, S.S. (2016), Electricity supply security and the future role of renewable energy sources in Brazil. Renewable and Sustainable Energy Reviews, 59, 328-341. Sözen, A., Alp, İ., Kilinc, C. (2012), Efficiency assessment of the
hydro-power plants in Turkey by using data envelopment analysis. Renewable Energy, 46, 192-202.
Tovar, B., Ramos-Real, F.J., Almeida, E.F. (2011), Firm size and productivity. Evidence from the electricity distribution industry in Brazil. Energy Policy, 39, 826-833.
Xavier, S.S., Lima, J.W.M., Lima, L.M.M., Lopes, A.L.M. (2015), How efficient are the Brazilian electricity distribution companies? Journal of Control, Automation and Electrical Systems, 26(3), 283-296. Yadav, V.K., Chauhan, Y.K., Padhy, N.P., Gupta, H.O. (2013), A novel
power sector restructuring model based on data envelopment analysis (DEA). International Journal of Electrical Power and Energy Systems, 44(1), 629-637.
Yang, H., Chang, C. (2009), Using DEA window analysis to measure efficiencies of Taiwan’s integrated telecommunication firms. Telecommunications Policy, 33, 98-108.