ESTUDO NO BRASIL, CANADÁ E CHINA
DEVELOPMENT OF HIGHER EDUCATION BY THE SPEARMAN MATRIX: A STUDY IN BRAZIL, CANADA AND CHINA
Danilo de Melo Costa
Centro Universitário UNA Belo Horizonte, MG, Brasil Email: [email protected]
Francisco Vidal Barbosa
Universidade Federal de Minas Gerais (UFMG) - Professor Titular da Faculdade de Ciências Econômicas (FACE) Belo Horizonte, MG, Brasil
Email: [email protected]
Daniela Vecchia Costa
Centro Universitário UMA - Professora dos Programas de Pós-Graduação Lato Sensu e Diretora de Pessoas na D3 Consulting Belo Horizonte, MG, Brasil
Email: [email protected]
Iris Barbosa Goulart
LATACI Research Institute Belo Horizonte, MG, Brasil Email: [email protected]
RESUMO ABSTRACT
Em um mundo cada vez mais competitivo, as nações precisam acompanhar o desenvolvimento e o desempenho de seus pares. Esta iniciativa é importante para que um país melhore seus resultados tendo como referência boas práticas já adotadas por outros países. A partir daí, esta pesquisa tem como objetivo analisar o comportamento de doze indicadores que afetam o desenvolvimento da educação superior, tendo como referência o Brasil, Canadá e China. Uma vez selecionados, foi realizada uma análise das correlações dos indicadores, para entender aqueles que têm a maior influência entre si através de uma matriz de correlação de Spearman e um mapa perceptual gerado pela Análise de Componentes Principais. A análise da matriz de Spearman e os mapas perceptivos ratificaram a relação direta entre investimento no ensino superior e sua expansão. Também se notou a influência do terceiro grau na economia do país. Finalmente, foi possível observar que o monitoramento correto desses indicadores pode demonstrar uma importante relação de influências que, se bem analisadas, podem levar o país ao tão almejado desenvolvimento.
In an increasingly challenging world, nations need to follow the development and performance of their peers. This initiative is important for a country to improve its results having as reference good practices already adopted by other countries. From there, this research aims to analyze the behavior of twelve indicators that affect the development of higher education, with reference to Brazil, Canada and China. Once selected, an analysis of correlations of the indicators was performed, in order to understand those who have the greatest influence in each other through a Spearman correlation matrix and a perceptual map generated by Principal Component Analysis. The analysis of the Spearman matrix and the perceptual maps ratified the direct relationship between investment in higher education and its expansion. It also noticed the influence of the third degree in the country economy. Finally, it was possible to observe that the correct monitoring of these indicators can demonstrate an important relationship of influences that, if well analyzed, can lead the country to the desired development.
Palavras-chave: Desenvolvimento. Ensino superior. Análise de componentes principais. Estudo
Comparativo. Matriz de Spearman.
Keywords: Development. Higher Education.
Principal Component Analysis. Cross-compare Study. Spearman matrix.
INTRODUÇÃO
In an increasingly challenging world, nations need to follow the development and performance of their peers. This initiative is important for a country to improve its results having as reference good practices already adopted by other countries.
In this sense, it can be observed that Brazil is a country that seeks to become the 5th world power by 2020; which is trying to increase its Gross Domestic Product (GDP), to improve its position in the ranking of the Human Development Index (HDI) and to lower their unemployment rates, something that plagues the world since the beginning of the second decade of this century (GARNERO, 2005).
From then on, it observes a gap to be explored with regard to the proposition of structural changes and new public policies, taking as reference the results of other countries. For this reason, this study uses as a reference general indicators for development of higher education in Brazil, Canada and China, based on the assertion of Lang and Zha (2004, p. 341) who argue that "Comparisons between pairs can provide a basis for a rational assessment of the differences and similarities, and identification of strengths, weaknesses, and potential opportunities or niches.”.
For this research, twelve indicators that impact the development of higher education were selected. Once selected and analyzed the indicators, an analysis of correlations of the indicators was performed, in order to understand those who have the greatest influence in each other through a Spearman correlation matrix and a perceptual map generated by Principal Component Analysis.
This practice was necessary to trace a map capable of showing which indicators have higher correlation in a comparative analysis of the three countries as well as the indicators that showed a higher correlation for each country specifically, as will be presented throughout this research.
The three countries were chosen because they are linked by several factors. Canada, besides being a developed and strong economy, has one of the most advanced educational systems in the world, and based on good European and American practice (CATTANI, 2006). In addition, Brazil and Canada have a strong agreement for the development of joint research, through the International Partnership of Science and Technology from Canada (ISTPCanada, 2017).
China had one of the largest economic growths in history and also improved the access and retention indicators in education, which can be exemplified by the growth of 337.5% in the gross enrollment rate in tertiary education between the years 1999 and 2006 (UNESCO 2008). China represent one of Brazil's peers and also is a developing country participant in BRICS. For this reason, both countries founded an academic cooperation through the "Seminar on Strengthening Higher Education Internationalization: Opportunities for Brazil and China," organized by the China Scholarship Council (CSC) and the Coordination of Improvement of Higher Level Personnel (Coordenação de Aperfeiçoamento de Pessoal de Nível Superior) (CAPES, 2012).
From this information, this research is relevant because understand the behavior of these indicators in recent years will show the importance of analyzing the countries studied more deeply and also the advantages of Brazil to structure possible partnerships with Canada and China in order to comprehend phenomena and policies that have led to such results and could be adapted to the country.
NATIONS CHALLENGES ACROSS THE WORLD AND THE ROLE PLAYED BY HIGHER EDUCATION
At the end of the first decade and the beginning of the second decade of this century, many nations, especially those developed, have faced one of its greatest financial crises. Continents hitherto economically sound, like North America and Europe are the main affected, especially the United States, which had its hegemony threatened by China (SAWAYA, 2009). That situation makes these continents start to think in structural changes, to seek good growth rates.
Amid the unwanted situations, some instruments are now considered essential to improve economic indicators, including higher education, which is responsible for several factors that have a direct impact on the results of the economy, such as:
a) generation skilled labor, which causes direct impact on productivity and consequently in job creation;
b) innovation discoveries, that if well marketed, can also help in the economic progress of countries and generating jobs;
c) creation of new business and maintain existing business, by training entrepreneurs.
Factors such as these make the nations start to give even more attention to higher education, as the United States, which has always been regarded as an innovative nation, mainly due to Silicon Valley's results. That nation begins to worry not only in generating technological innovations and mainly how to market the innovations that have been developed to reach favorable economic results. This concern is due to the speed at which Asians are playing such innovations and then the marketing for the rest of the world, something easily possible after globalization (ERNST, 2005).
In Europe, higher education is now also one of the main instruments. The main adversity faced by countries concerns to high unemployment, which can be minimized with the generation of skilled labor, influencing productivity, and the training of entrepreneurs (EUROPEAN COMISSION, 2011). Undertake results in job creation, something that is critical to the economic performance of European countries in the coming decades (EUROPEAN COMISSION, 2011).
When analyzing the current situation of the world economic scenario, where rapid and constant changes are taking place every day, driven by new ways of producing, trading and consuming, cooperate and compete, such changes will only be possible from the development of new technologies and these new technologies are devised from generation knowledge. In this scenario, education plays an important role, especially for higher education, which should be adequately funded so it can be expanded to as many people. Thus, the various ways to achieve the development of a nation, one of the main ones is through education, which has its importance since basic education, in which individuals are transformed into citizens, through higher education, which will produce the main input to meet the demands of the countries, which is intellectual capital.
The importance of the variable "education" has been considered by several countries seeking through this major policy for the country's progress. According to studies by the Inter-American Development Bank (IDB), "Entrepreneurship in emerging economies: Creation and Development of New Firms in Latin America and East Asia," the training of potential entrepreneurs is a long process that begins during the first
cycle of education and extends to the university and the first years of work (BID, 2002), demonstrating the need to create public policies that finance higher education in order to meet the aspirations of the country.
This practice, development by investment in higher education, was already confirmed in Canada, which for many years has invested heavily in education, achieving significant rates of young people between 18 and 24 years enrolled in higher education (HADDAD; GRACIANO, 2004). In that scenario, Canada stands out not only quantitatively but also qualitatively, one of the higher quality of countries with respect to higher education worldwide. Such data can be checked when analyzing various world rankings of universities. According to the ranking Webometrics in January 2015, which considers especially contents that are related to processes of generation and scholarly communication of scientific knowledge of each university on the internet, five Canadian universities are among the top 100 in the world, especially the Toronto University (17) University of British Columbia (21) and University of Alberta (64) (WEBOMETRICS, 2015).
Analyzing the Academic Ranking of World Universities (ARWU) prepared by University Communications Shanghai (Jiaotong), what is based on indicators of quality education, quality of teaching staff, articles published in high-impact academic performance of the institution journals, Canada has six universities among the 150 best in the world in 2014 (ARWU, 2015). Finally, the National Taiwan University Ranking (NTURanking), with reference to the latest data released in 2017, Canada had five among the top 100 universities, with emphasis on the Toronto University, occupying the 4th position in the Ranking. These results directly reflect the advanced country's university system (NTU, 2018).
In other regions, such as in Europe, schools and universities now have an important role in the development of the continent, and its importance highlighted even in the "Progress Report on Europe 2020". This participation of educational institutions is of paramount importance to training of new professionals, prepared for the job market. No country will achieve progress if you have no trained hand labor and suitably qualified (EUROPEAN COMMISSION, 2011).
In Asia, you get to watch a real phenomenon, as the continent grows as much as it invests in education. In recent years, the Asian discovered this formula of success and began to invest heavily both in basic education and in higher education. Countries like China are now conducting research within their own universities and then commercialize the results, as well as increasing investment in higher education (MAHMOOD; SINGH, 2003). This new phenomenon begins to generate positive results for the country, which in 2015 has universities Peking University (47), Tsinghua University China (49), Zhejiang University (65), Shanghai Jiao Tong University (83) and Xiamen University (88) one of the 100 largest presence of universities in the internet world (WEBOMETRICS, 2015). Extending the analysis to the 150 best universities in the world, both in the Webometrics, and in the ranks of ARWU and NTURanking, it can be observed the presence of several other Chinese universities (WEBOMETRICS, 2015; ARWU, 2015; NTU, 2018).
In South America, with emphasis on Brazil, the most prominent universities in the aforementioned rankings receive state public funding, not federal: University of São Paulo (USP) and the University of Campinas (Unicamp). This is due to the still inadequate investment in relation to public funding for higher education. This funding is mainly through public policies, such as: Support Program Plan of Restructuring and Expansion of Federal Universities - Reuni (now closed), University for All Program - Prouni; Higher Education Student’s Fund Financing - Fies; Federal Institutes of Education, Science and Technology- IFETs; and Open
University of Brazil - Uab. While investments are happening and should be highlighted, they are still of short need in the country, especially if compared to other countries such as Canada and China.
The information cited above show the significance of the effects of globalization worldwide, with a profound impact on education (especially in higher education) and financing that composes it.
The effects of globalization on higher education
From globalization, there is a worldwide need for higher levels of education, resulting in a large increase in demand and access of students seeking the third degree. Ilon (2010) shows that between 1975 and 1995 there was a considerable increase in students enrolled in higher education in the world, out of 40.3 million, going to 80.5 million, almost doubled in just 20 years.
Delimiting the developed countries, Lazerson (2010) argues that globalization was responsible for promoting competition for financial resources between countries and universities, promoting changes in their funding. These features are achieved by the scientific and technological innovation through the generation of patents, given that represent concrete results to the market. Additionally, students begin to seek higher education courses according to the shortage of skilled labor, making both economy and market beacon offers of higher education.
This type of globalization, from the scientific and technological developments, now called economic globalism as it seeks to produce greater capital accumulation and has a strong influence of capitalism. The economic globalism has the characteristics of the free market, competitive, open communications, individualism, deregulation and privatization of the public sector (TÜNNERMANN BERNHEIM, 2010).
This variation of globalization then goes on to influence higher education, which must conform to this new global reality, in order to produce knowledge that is commercial, affecting traditional academic activities, it began to be guided by the requirements of applicability and market value. Tünnermann Bernhim (2010) criticizes this influence, saying that the instrumental knowledge, if applied indiscriminately, will cause new and complex problems, citing as an example the deterioration of the environment. To Didriksson (2000), is explicit the economic character that has higher education, in that it has a particular relationship with the production of knowledge related to the industry. The author adds saying that many of the knowledge produced aim to contribution to economic output, featuring in a close relationship. As already noted, the scientific and technological innovations depend on many factors that are arising in many cases of research centers, which are beyond the own production system. The existing direct relationship between science, production and technology generates a set of new categorical that suggest major changes in the financing of tertiary education, appreciation of intellectual work and knowledge that are seen as economic value.
As a result of these investments, one third of the world's best universities are located in the Asia Pacific region, been observed a large intervention of the government in emerging Asia (CARNOY; RHOTEN, 2002). Countries like Taiwan, South Korea and especially China are increasing funding to its universities aimed at increasing the number of universities with world-class. Even the Academic Ranking of World Universities, prepared by the University of Shanghai Communications (Jiaotong) was created for Chinese universities can understand what has been done in the world's premier universities. Ilon (2010) shows that the numbers of these countries are amazing when notes that Asia has made almost twice more engineers than Europe, a
professional area that has a certain shortage of skilled labor currently qualified, representing the important role that higher education has played in world economies.
METODOLOGY
According to the objectives, the research was developed by descriptive method. To Barros and Lehfeld (2007), the descriptive research is the study, analysis and interpretation of the facts without the interference of the researcher.
For this study, a data collection by documentary research was carried out, which is a data collection source made from documents (contemporary or retrospective), but scientifically classified as authentic (MARCONI, LAKATOS, 1990). From then on, were used for data collection, Brazil, Canada and China documents, such as management reports from governments between 2003 and 2012, decrees of the respective countries, statistical tables, opinions, minutes, reports, notes, letters, speeches, statements, among others.
Additionally, was collected information from databases worldwide, as the United Nations Statistics Division (UNSD), the World Bank, the United Nations Organization for Education, Science and Culture (UNESCO), the Organization for Economic and Development Cooperation (OECD), the China.Org, the Brazilian Ministry of Education and Culture and the Statistics Canada database.
It was also carried out the collection through literature by material already developed and published on the subject to be searched. The literature search included the reading, analysis and interpretation of single publications, newsletters, newspapers, magazines, books, articles, master theses and doctoral dissertations from around the world, especially in publications of the countries studied (GIL, 1995).
From then on, were collected for the 2003-2012 period, quantitative data for the twelve indicators (macro and micro) previously selected to realize the performance of each of them in their respective countries in order to understand their behavior in the analyzed period and their influence to the higher education system. The criteria for choosing these indicators were due to its global importance and the close relationship they have with public funding for higher education, the core of this research. In addition, these indicators were those related to higher education available in the databases consulted, which allowed the referred comparative study. Other indicators could be used, but they didn't address the three countries in the period of interest, which made this one of the limitations of the research. Below the indicators consulted:
a) GDP per capita in US dollars;
b) Evolution rate of unemployment;
c) Evolution of the HDI (IDH, in Portuguese) - general;
d) HDI (IDH) evolution - education component;
e) HDI (IDH) evolution - income component;
f) Annual population growth;
g) Overall investment in higher education (% of GDP);
h) Overall investment in higher education (% GDP) versus GDP per capita in US dollars;
j) Number of net enrollment (18 to 24 years) of the population;
k) Spending on research and development of the GDP;
l) Researchers in R&D per million people;
The analysis and quantitative treatment were performed with the numerical findings of country performance, from the collection of documentary and bibliographic data, following Barbetta’s assertion (2008, p. 65), which advocates that such procedure allows "[...] introducing techniques to organize, summarize and present the data in such a way that it can interpret them in the light of the research objectives."
After collecting and the registering of the twelve selected indicators, the systematization and standardization of data was performed in addition to the conversion in the USD currency. Later, to make a collelational analysis of the indicators between countries, was performed a correlation between the economic, educational, social and demographic indicators, to facilitate the creation of models that demonstrate the influence of the indicators for the performance of the countries.
For this action, a Spearman correlation matrix was used (HOLLANDER; WOLFE, 1999) and then generated perceptual maps via Principal Component Analysis (MINGOTI, 2007) to enable rapid visualization of the relationship between the variables. Correlation analysis was performed first considering the three countries in a stratified manner and secondarily the three countries together to understand the correlations in all its dimensions. The choice of this technique was due to the classification of correlations through loads presented graphically generated a map able to demonstrate the main influences between them.
CORRELATION ANALYSIS: GENERAL INDICATORS BRAZIL, CANADA AND CHINA
Once selected and analyzed the indicators, it seeks now to perform a correlation of these indicators in order to understand those who have the greatest influence in each other through a Spearman correlation matrix and present a perceptual map generated via Principal Component Analysis.
This practice is necessary to trace a map capable of showing which indicators have higher correlation in a comparative analysis of the three countries as well as the indicators that showed a higher correlation for each country specifically. This action may highlight the main factors influencing the performance of higher education and which requires further attention in a respective nation.
In the Tables 01, 02, 03 and 04, the symbols corresponding to each indicator were defined by:
a) PIBPC: GDP per capita in US dollars;
b) IGESPIB: General Investment in Higher Education (% of GDP);
c) IGESPIBPC: General Investment in Higher Education (% GDP) vs. GDP Per Capita in US dollars;
d) NMB: Number of Gross Enrolment of the population;
e) NML: Number of Net enrollment (18 to 24) of the population; f) DPDPIB: Expenditure on research and development (% of GDP); g) DPDPMP: Researchers in R&D per million people;
h) IDH: HDI Evolution – General;
j) IDHR: HDI Evolution – Income Component; k) ETD: Harmonised unemployment rate; l) CPA: Annual Population Growth.
Thus, it is first presented the correlation analysis between Canada’s indicators, followed by correlation analysis of China's indicators and then correlation analysis of Brazil's indicators. At the end, an analysis of general indicators is presented, considering jointly the three countries.
Correlation analysis between indicators: Canada
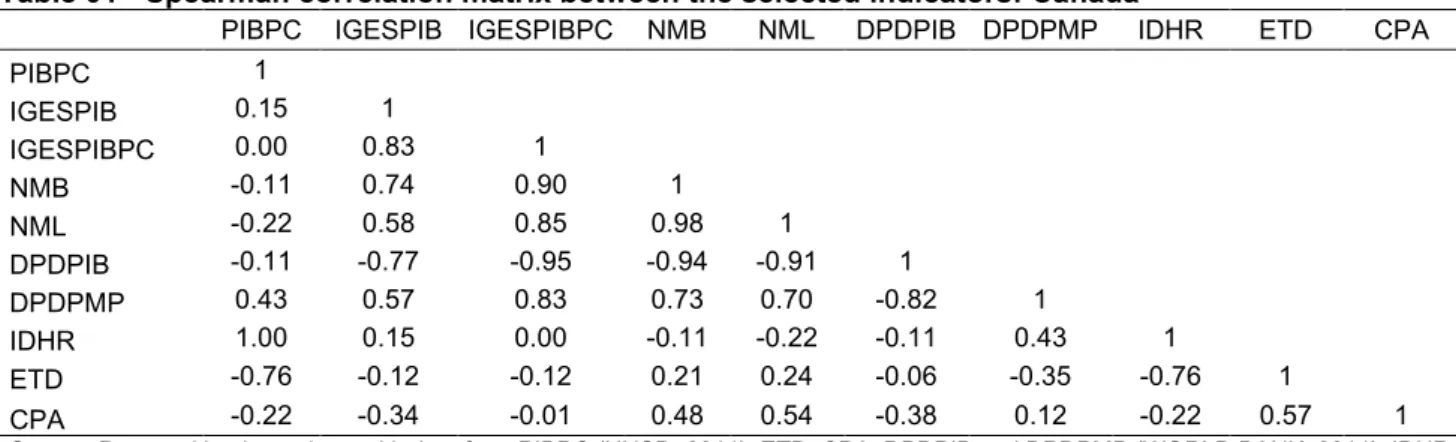
Table 01 presents the values of the Spearman correlations between the economic, educational, social and demographic indicators in Canada. Values greater than 0.60 show significant positive correlation, while values less than -0.60 showed a significant negative correlation. Therefore it is emphasized that:
a) there was a much smaller number of significant correlations than Brazil, for example, indicator GDP per capita in US dollars had a significant positive correlation only with the IDHR indicator and negative with ETD indicator;
b) the IGESPIB, DPDPMP, IGESPIBPC, NML, NMB indicators were positively correlated between them and negatively with DPDPIB;
c) the PIBPC indicator was strongly correlated with the IDHR indicator, and PIBPC and IDHR indicators were negatively correlated with ETD;
d) IDH and IDHE indicators were not evaluated for Canada, because they not presented variability in the analyzed period.
Table 01 - Spearman correlation matrix between the selected indicators: Canada
PIBPC IGESPIB IGESPIBPC NMB NML DPDPIB DPDPMP IDHR ETD CPA
PIBPC 1 IGESPIB 0.15 1 IGESPIBPC 0.00 0.83 1 NMB -0.11 0.74 0.90 1 NML -0.22 0.58 0.85 0.98 1 DPDPIB -0.11 -0.77 -0.95 -0.94 -0.91 1 DPDPMP 0.43 0.57 0.83 0.73 0.70 -0.82 1 IDHR 1.00 0.15 0.00 -0.11 -0.22 -0.11 0.43 1 ETD -0.76 -0.12 -0.12 0.21 0.24 -0.06 -0.35 -0.76 1 CPA -0.22 -0.34 -0.01 0.48 0.54 -0.38 0.12 -0.22 0.57 1
Source: Prepared by the authors with data from PIBPC (UNSD, 2014); ETD, CPA, DPDPIB and DPDPMP (WORLD BANK, 2014); IDHR (UNDP, 2014); IGESPIB (WORLD BANK, 2014; OCDE, 2013); IGESPIBPC (UNSD, 2014; WORLD BANK, 2014; OCDE, 2013); NMB and NML (STATISTICS CANADA, 2014).
Note: Values greater than 0.60 show significant positive correlation, while values less than -0.60 showed a significant negative correlation (p < 0.05).
To facilitate the visualization of correlations between the indicators it was carried out a Principal Component Analysis (PCA), represented in Graph 01.
Graph 01 - Perceptual map of selected indicators generated via Principal Component Analysis: Canada
Source: Prepared by the authors with data from Table 01.
With the perceptual map shown in Graph 01, generated by the PCA, it can be seen that:
a) it could well represent the relationship of the variables with two dimensions, because it was able to explain about 75.8% of the variability of the indicators;
b) evaluating the first component (dimension), it was note that the IGESPIB DPDPMP, IGESPIBPC, NML, NMB indicators were positively correlated between them and negatively with DPDPIB indicator, which shows that spending on research and development (percentage of GDP) they have no direct influence on other indicators for higher education, especially in the number of gross and net enrollment. Interestingly, the percentage of GDP invested in research and development will not directly influence the formation of researchers (number of researchers per million people), which is more related to direct investments in access to higher education;
c) already evaluating the second component (dimension), it was noted that the PIBPC indicator was strongly correlated with the IDHR indicator, and PIBPC and IDHR indicators were negatively correlated with ETD. That is, the change in the unemployment rate did not affect GDP per capita and the IDH income component of the country analyzed during the period.
Correlation analysis between indicators: China
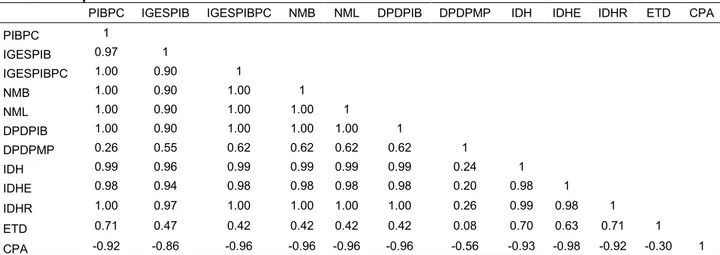
Table 02 shows the values of the Spearman correlations between the economic, educational, social and demographic indicators in China. Values greater than 0.60 show significant positive correlation, while values less than -0.60 showed a significant negative correlation. Therefore it is emphasized that:
a) the PIBPC, IGESPIB, IGESPIBPC, NMB, NML and DPDPIB indicators were strongly positively correlated between them and negatively correlated with the CPA;
b) the PIBPC, IDH, and IDHE IDHR indicators were strongly positively correlated between them and negatively correlated with the CPA;
c) the ETD and DPDPMP indicators were those with the lowest number of significant correlations.
Table 02 - Spearman correlation matrix between the selected indicators: China
PIBPC IGESPIB IGESPIBPC NMB NML DPDPIB DPDPMP IDH IDHE IDHR ETD CPA
PIBPC 1 IGESPIB 0.97 1 IGESPIBPC 1.00 0.90 1 NMB 1.00 0.90 1.00 1 NML 1.00 0.90 1.00 1.00 1 DPDPIB 1.00 0.90 1.00 1.00 1.00 1 DPDPMP 0.26 0.55 0.62 0.62 0.62 0.62 1 IDH 0.99 0.96 0.99 0.99 0.99 0.99 0.24 1 IDHE 0.98 0.94 0.98 0.98 0.98 0.98 0.20 0.98 1 IDHR 1.00 0.97 1.00 1.00 1.00 1.00 0.26 0.99 0.98 1 ETD 0.71 0.47 0.42 0.42 0.42 0.42 0.08 0.70 0.63 0.71 1 CPA -0.92 -0.86 -0.96 -0.96 -0.96 -0.96 -0.56 -0.93 -0.98 -0.92 -0.30 1
Source: Prepared by the authors with data from PIBPC (UNSD, 2014); ETD (WORLD BANK, 2014); IDH, IDHE and IDHR (UNDP, 2014); IGESPIB (to years 2003 and 2004 USCI (2014), to year 2005, CHINA.ORG (2014), to years 2006 to 2012, China Daily (2014)), IGESPIBPC (UNSD, 2014; USCI, 2014; CHINA.ORG, 2014; China Daily, 2014); NMB and NML (UNESCO, 2014).
Note: Values greater than 0.60 show significant positive correlation, while values less than -0.60 showed a significant negative correlation (p < 0.05).
To facilitate the visualization of correlations between the indicators it was carried out a PCA, represented in Graph 02.
Graph 02 - Perceptual map of selected indicators generated via Principal Component Analysis: China
Source: Prepared by the authors with the data from Table 02.
With the perceptual map shown in Graph 02, generated by the PCA it can be seen that:
a) it was possible to well represent the relationship of the variables in two dimensions, since it has explained about 90% of the variability of the indicators;
b) evaluating the first component (dimension), it was noted that the IGESPIB, IGESPIBPC, NMB, NML and DPDPIB indicators were strongly positively correlated between them and negatively correlated with CPA;
c) still analyzing the first component (dimension), the PIBPC, IDH, IDHE, IDHR and ETD indicators were strongly positively correlated between them and negatively correlated with CPA, which shows that, for the analyzed period, population growth also did not affect GDP per capita, the components of the HDI and the unemployment rate;
d) as seen in Canada, the indicators related to access (gross and net enrollment rates), as well as investments in higher education, had a positive correlation with the formation of researchers (number of researchers per million people) in China. However, contrary as observed in Canada, the percentage of GDP invested in research and development showed a significant positive correlation with the training of researchers.
Correlation analysis between indicators: Brazil
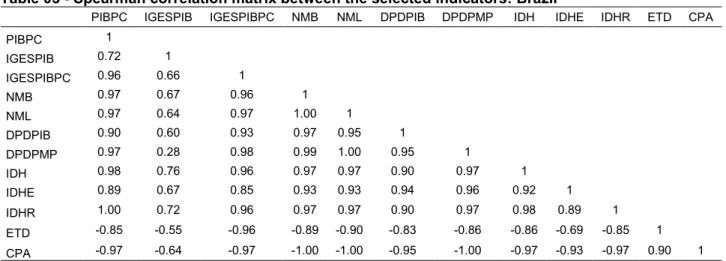
Table 03 presents the values of the Spearman correlations between the economic, educational, social and demographic indicators in Brazil. Values greater than 0.60 show significant positive correlation, while values less than -0.60 showed a significant negative correlation. Therefore it is emphasized that:
a) the GDP indicator per capita in dollar showed significant correlation with all other indicators, and the correlation was positive with IGESPIB, IGESPIBPC, NMB, NML, DPDPIB, DPDPMP, IDH, IDHE and IDHR indicators, and negative with ETD and CPA indicators; b) there was a significant correlation between all indicators except IGESPIB indicator with
DPDPMP and ETD, being that ETD and CPA were negatively correlated with the other indicators.
Table 03 - Spearman correlation matrix between the selected indicators: Brazil
PIBPC IGESPIB IGESPIBPC NMB NML DPDPIB DPDPMP IDH IDHE IDHR ETD CPA
PIBPC 1 IGESPIB 0.72 1 IGESPIBPC 0.96 0.66 1 NMB 0.97 0.67 0.96 1 NML 0.97 0.64 0.97 1.00 1 DPDPIB 0.90 0.60 0.93 0.97 0.95 1 DPDPMP 0.97 0.28 0.98 0.99 1.00 0.95 1 IDH 0.98 0.76 0.96 0.97 0.97 0.90 0.97 1 IDHE 0.89 0.67 0.85 0.93 0.93 0.94 0.96 0.92 1 IDHR 1.00 0.72 0.96 0.97 0.97 0.90 0.97 0.98 0.89 1 ETD -0.85 -0.55 -0.96 -0.89 -0.90 -0.83 -0.86 -0.86 -0.69 -0.85 1 CPA -0.97 -0.64 -0.97 -1.00 -1.00 -0.95 -1.00 -0.97 -0.93 -0.97 0.90 1
Source: Prepared by the authors with data from PIBPC (UNSD, 2014); ETD and CPA, (WORLD BANK, 2014); IDH, IDHE and IDHR (UNDP, 2014); IGESPIB (INEP, 2014); IGESPIBPC (UNSD, 2014; INEP, 2014); NMB and NML (PAIM, 2014).
To facilitate the visualization of correlations between the indicators it was carried out a PCA, represented in Graph 03.
Graph 03 - Perceptual map of selected indicators generated via Principal Component Analysis: Brazil
Source: Prepared by the authors with data from Table 03.
With the perceptual map shown in Graph 03, generated by the PCA it can be seen that:
a) it could well represent the relationship of the variables with two dimensions, because it was able to explain about 91% of the variability of the indicators;
b) evaluating the first component (dimension), it was note that the indicators PIBPC, IGESPIB, IGESPIBPC, NMB, NML, DPDPMP, DPDPIB, IDH, IDHE and IDHR are positively correlated between them and negatively with ETD and CPA. I.e. factors related to investments in higher education, tuition (net and gross), investments in research, and the human development index has a negative correlation with population growth and the unemployment rate in the analyzed period;
c) it is worth noting that the correlation between overall investment in higher education (GDP versus GDP Per Capita), represented by the IGESPIBPC indicator and the number of the gross and net enrollment (NMB and NML) is highly significant, which shows the direct relationship to expand investment in education and therefore to expand access;
d) increasing the percentage of GDP transferred to higher education has also shown profound relationship with the growth of the overall IDH as well as income and education components, proving the social impact that such measure had in the period;
e) unlike Canada and similar to China, the percentage of GDP applied in research and development had significant correlation with the number of researchers per million people. On the other hand, the percentage of GDP applied to higher education had no significant
correlation with the number of researchers per million inhabitants, which suggests a greater focus of the country's investment in undergraduate education.
Joint analysis of correlation between indicators: Brazil, Canada and China
The Table 04 presents the values of the Spearman correlations between economic, educational, social and demographic indicators from Brazil, Canada and China. Values greater than 0.35 show significant positive correlation, while values less than -0.35 show significant negative correlation. Therefore it is emphasized that:
a) GDP indicator per capita in US dollars showed a significant positive correlation with all other indicators, i.e., the higher the GDP per capita, the greater will be the value of other indicators. PIBPC, IGESPIB, IGESPIBPC, NMB, NML, DPDPIB, DPDPMP, IDH, IDHE and IDHR indicators were positively correlated significantly between them;
b) the only indicators that showed no significant correlation were ETD and CPA with the IGESPIB, IGESPIBPC, NMB, DPDPIB and DPDPMP indicators. It should be noted that, although not significant, ETD and CPA, showed negative correlations with IGESPIB, DPDPIB and DPDPMP.
Table 04 - Spearman correlation matrix between the selected indicators for the three countries
PIBPC IGESPIB IGESPIBPC NMB NML DPDPIB DPDPMP IDH IDHE IDHR ETD CPA
PIBPC 1 IGESPIB 0.49 1 IGESPIBPC 0.94 0.67 1 NMB 0.93 0.68 0.99 1 NML 0.95 0.60 0.99 0.99 1 DPDPIB 0.44 0.89 0.64 0.65 0.57 1 DPDPMP 0.51 0.94 0.73 0.76 0.66 0.88 1 IDH 0.98 0.50 0.96 0.95 0.97 0.46 0.51 1 IDHE 0.98 0.48 0.94 0.94 0.96 0.44 0.49 1.00 1 IDHR 1.00 0.49 0.94 0.93 0.95 0.44 0.51 0.98 0.98 1 ETD 0.49 -0.30 0.28 0.26 0.39 -0.30 -0.29 0.53 0.55 0.49 1 CPA 0.64 -0.09 0.32 0.34 0.47 -0.15 -0.07 0.66 0.68 0.64 0.83 1
Source: Prepared by the author with data from tables 01, 02 and 03.
Note: Values greater than 0.35 show significant positive correlation, while values less than -0.35 show significant negative correlation (p < 0.05).
To facilitate the visualization of correlations between the indicators it was carried out a PCA, represented in Graph 04.
Graph 04 - Perceptual map of selected indicators generated via Principal Component Analysis: Brazil, Canada and China
Source: Prepared by the authors with data from Table 04.
With the perceptual map shown in Graph 04 generated by the PCA it can be seen that:
a) it could well represent the relationship of the variables with two dimensions, because it was able to explain about 92.5% of the variability of the indicators;
b) evaluating the first component (dimension), it can note that there was a tendency of all indicators being positively correlated between them, and between PIBPC, IGESPIB, IGESPIBPC, NMB, NML, DPDPMP, IDH, IDHE, and IDHR the correlation is stronger; c) the ETD indicator was positively correlated with the CPA, being that ETD and CPA were
negatively correlated with DPDPIB;
d) when analyzing the three countries together, it was possible to identify a correlation between the percentage of GDP applied in research investment (DPDPIB) and the number of researchers per million of people (DPDPMP), something that has not been confirmed only in Canada;
e) from the above indicators analysis it was possible to prove, absolutely, that general investment in higher education (% GDP) versus GDP Per Capita, has a positive correlation with almost all other indicators, especially with the gross and net enrollment rate and the results for the IDH, proving the importance which this level has to a nation.
FINAL THOUGHTS
From the analysis of correction of the indicators, it was possible to observe those that Brazil should carry out a more precise monitoring and that needs to look for an evolution in the next years. The analysis of
the Spearman matrix and the perceptual maps ratified the direct relationship between investment in higher
education and its expansion. It also noticed the influence of the third degree in the country economy. Through correlation analysis, it was possible to trace structural models in order to expand gross and net enrollment rates in order to meet targets from the National Education Plan 2014-2024 (BRASIL, 2011).
Considering that one of the central challenges of Brazil is to increase the gross enrollment rate of students enrolled in higher education, we tried to structure the main indicators that have propensity in this variable and their respective loads in a model, so that the government can perform monitors as well as work for the improvement of these indicators, since they will inevitably also impact the performance of the Higher
education in the country. Figure 01 shows a structural model for the expansion of the gross enrollment rate,
from the results observed in both Canada, China and Brasil.
Figure 01 - Structural Model: expansion of gross enrollment rate
Note: Values greater than 0.35 show significant positive correlation, while values less than -0.35 show significant negative correlation (p <0.05).
Figure 01 shows which indicators have greater correlation and generate greater impact for the gross enrollment variable. Based on the quantitative results and insights via qualitative research, it intends to analyze the reasons why these indicators received this classification and their importance to the system.
Based on the model, it can be observed that the General Investment Indicators in Higher Education (% GDP) versus GDP Per Capita (IGESPIBPC) and the Net Enrolment (NML) are the ones that most influence
the results of the gross enrollment rate. When analyzing the indicator Net Enrollment (NML), there is a direct
relationship, because as it increases the net rate, thus increases the gross rate, so possible government investments will directly impact on both indicators.
In the other hand, the General Investment indicator in Higher Education (% GDP) versus GDP per capita reinforces what has already been identified in the quantitative analysis: the greater the investment in educational resources, the greater the expansion of higher education. Thus, if the government wants to actually increase enrollment rates in higher education, it needs to effectively increase the percentage of GDP per capita applied to education.
The next level of correlation shows the General HDI indicators with 0.95 (IDH), HDI Education with 0.94 (IDHE), HDI Income (IDHR) and GDP Per Capita (PIBPC), both with 0.93. In regarding of the Human Development Index (IDH), it was shown that there is a direct impact on the evolution of this indicator with the gross enrollment rate. When there is an improvement in the human development index, is a sign that the educational indicators are also improving, which ultimately reflected in an extension of the enrollment rate, especially if this is one of the challenges for progress, which is the case of Brazil. The HDI education component is also related because it specifically measures the results of the sector, and if the percentages are good, is a sign that it has achieved satisfactory results in the area.
It is also interesting to note the roles of the HDI Income (IDHR) and GDP per capita (PIBPC). These indicators indicate that an improvement in the economy, and consequently in the income of the citizen, generates significant results to increase the enrollment rate. This is a feedback because the increase in the enrollment rate generates a more qualified workforce, which will make up the country's professional staff, helping market outcomes and improving the economy. The improvement in the economy will guarantee the state more resources to be applied in education, generating in turn more skilled labor to foster the needs of the nation.
Not as significant as the firsts, but still generating impact on the gross enrollment rate are the researchers indicators on R&D per million people (DPDPMP) with 0.76, General Investment in Higher Education (% GDP) (IGESPIB) with 0.68 and Expenditure on research and development of GDP (DPDPIB) 0.65.
Finally, the correct monitoring of these indicators, also including other countries, can demonstrate an important relationship of influences that, if well analyzed, can lead the country to the desired development.
REFERÊNCIAS
ARWU. Academic Ranking of World Universites 2014. Center for World-Class Universities of Shanghai Jiao Tong University. Shanghai. China. Disponível em: <http://www.shanghairanking.com/ARWU2013.html>. Acesso em 21 de fevereiro de 2015.
BARBETTA, Pedro Alberto. Estatística aplicada às ciências sociais. 7th. ed. Rev. Florianópolis, SC: Editora da UFSC, 2008.
BARROS, Aidil Jesus da Silveira; LEHFELD, Neide Aparecida de Souza. Fundamentos de Metodologia Científica. 3.ed. São Paulo: Prentice‐Hall, 2007.
BID. Empreendedorismo em Economias Emergentes: Criação e Desenvolvimento de Novas Empresas na América Latina e no Leste Asiático. Inter-American Development Bank. Nova York. Março de 2002.
BRASIL. Projeto de Lei. Aprova o Plano Nacional de Educação para o decênio 2011-2020 e dá outras providências. Congresso Nacional. Brasília, 2011.
CAPES. Seminário sobre internacionalização da Educação Superior entre Brasil e China acontece em Pequim. Brasília. 2012. Disponível em: < http://www.capes.gov.br/servicos/sala-de-imprensa/36-noticias/5330-seminario-sobre-internacionalizacao-da-educacao-superior-entre-brasil-e-china-acontece-em-pequim>. Acesso em 26 de fevereiro de 2017.
CATTANI, D. A. Desigualdades socioeconômicas Brasil/Canadá: um estudo a partir dos extremos. Revista Interfaces Brasil/Canadá, Porto Alegre, n.6, 2006.
CARNOY, M.; RHOTEN, D. What Does Globalization Mean for Educational Change. Comparative Education Review, 46 (1), p. 1-9, 2002.
CHINA DAILY. Govt spends chunk of GDP on education. Portal China Daily. Pequim, China. Disponível em:<http://www.chinadaily.com.cn/bizchina/2011-07/16/content_12916109.htm>. Acesso em 18 de setembro de 2014. CHINA.ORG. China Spends 2.82% of GDP in Education. Portal China.org.cn. Pequim, China. Disponível em: <http://www.china.org.cn/english/MATERIAL/194843.htm>. Acesso em 18 de setembro de 2014.
DIDRIKSSON, Axel. La Universidad del Futuro: relaciones entre la educación superior, la ciencia y la tecnologia, 2nd. ed. México: CESU-Universidad Nacional Autónoma de México/Plaza y Valdés. 2000.
ERNST, D. Pathways to innovation in Asia’s leading electronics-exporting countries: a framework for exploring drivers and policy implications. Int. J. Technology Management, Olney, v. 29, n. 1/2, p. 6–20. 2005.
EUROPEAN COMMISSION. Anual Growth Survey: Progress report on Europe 2020. Brussels, COM (2011) 11 - a1/2. 2011.
GARNERO, M. O século do Brasil. Reportagem do Jornal do Brasil, Biblioteca do Senado. Brasília, 15 de fevereiro de 2005.
GIL. Métodos e Técnicas de Pesquisa Social. São Paulo: Atlas, 1995.
HADDAD, Sérgio; GRACIANO, Mariângela. Educação: direito universal ou mercado em expansão. São Paulo Perspec., São Paulo, vol.18, n.3, pp. 67-77, 2004.
HOLLANDER, Myler; e WOLFE, Douglas A. Nonparametric Statistical Methods. New York: John Wiley & Sons, 1999. ILON, L. Higher Education Responds to Global Economic Dynamics. In: RUST, V.; PORTNOI, L.; BAGLEY, S. (Orgs.). Higher Education, Policy and the Global Competition Phenomenon. New York: Palgrave Macmillan, 2010.
INEP. Percentual do Investimento Total em Relação ao PIB por Nível de Ensino. Instituto Nacional de Estudos e Pesquisas Educacionais Anísio Teixeira. Brasília. Disponível em: <http://portal.inep.gov.br/web/guest/estatisticas-gastoseducacao-indicadores_financeiros-p.t.i._nivel_ensino.htm>. Acesso em 18 de setembro de 2014.
ISTPCanada. Brazil Program Overview. Disponível em <http://www.istpcanada.ca/international_programs/Brazil/>. Acesso em 30 de Março de 2017.
LANG, Daniel; ZHA, Qiang. Comparing University: A Case Study between Canada and China. Higher Education Policy, Paris, v.17, n.4, p.339-381, 2004.
LAZERSON, M. Higher Education and the American Dream: Success and its Discontents. Budapest: Central European University Press, 2010.
MAHMOOD, P. I.; SINGH J. Technological Dynamism in Asia. Research Policy, Vol. 32, N. 6, p. 1031-1054. 2003. MARCONI, M. A.; LAKATOS, E.M. Técnicas de Pesquisa. 2nd. ed. São Paulo: Editora Atlas, 1990.
MINGOTI, S. A. Análise de Dados Através de Métodos de Estatística Multivariada: uma Abordagem Aplicada. Belo Horizonte: UFMG, 2007.
NTU. 2017 National Taiwan University Ranking. Taipé, Taiwan. Disponível em: < http://nturanking.lis.ntu.edu.tw/DataPage/OverallRanking.aspx?y=2017>. Acesso em 24 de Março de 2018.
OECD. Education at a Glance 2013: OECD Indicators. Paris: OECD Publishing, 2013.
PAIM, Henrique. Ensino Superior e novas tecnologias: caminhos e desafios. Brasília: Ministério da Educação, 2014. SAWAYA, Rubens R. Crise: um problema conjuntural ou da lógica da acumulação mundial?. Estud. av., São Paulo, v. 23, n. 66, 2009.
STATISTICS CANADA. Education, training and learning. Ottawa. Disponível em: <http://www5.statcan.gc.ca/subject-sujet/theme-theme.action?pid=1821&lang=eng&more=0&HPA>. Acesso em 18 de setembro de 2014.
TÜNNERMANN BERNHEIM, C. La educación superior necesária para el siglo XXI. In: LOPEZ SEGRERA, F.; RIVAROLA, D.M. (Orgs.). La universidad ante los desafios del siglo XXI. Asunción: Ediciones y Arte, p. 25-69. 2010.
UNDP. Human Development Index trends, 1980-2013. Nova York: United Nations Development Programme. Disponível em: <https://data.undp.org/dataset/Table-2-Human-Development-Index-trends-1980-2013/y8j2-3vi9?>. Acesso em 11 de Outubro de 2014.
UNESCO. Education for All: Overcoming inequality: why governance matters. Global Monitoring Report 2009. Reino Unido: United Nations Educational, Scientific and Cultural Organization, 2008.
UNESCO. Data Centre: UNESCO Institute for Statistics. Montreal: United Nations Educational, Scientific and Cultural Organization. Disponível em: <http://data.uis.unesco.org/>. Acesso em 18 de setembro de 2014.
UNSD. Per capita GDP at current prices - US dollars. Nova York: United Nations Statistics Division of the Department of Economic and Social Affairs (DESA). Disponível em: <http://data.un.org/ >. Acesso em 07 de novembro de 2014. USCI. Education and Government Efforts. Los Angeles: University of Southern California U.S.-China Institute. 2014.
Disponível em:
<http://china.usc.edu/%28S%28qgpbj1yqm4431a3l5gsx5m55%29X%281%29A%28KC50L0V20AEkAAAAM2NiOTRhMT QtOWNhZi00YWFjLTk4YzUtMmVjYzg1YTg4OTFjcGO62MXcRjByew2Edf8IOjdExCc1%29%29/ShowAverageDay.aspx? articleID=615&AspxAutoDetectCookieSupport=1>. Acesso em 18 de setembro de 2014.
WEBOMETRICS. Ranking Web of Universities: January 2015 edition. Madrid, Espanha. Disponível em: <http://www.webometrics.info/en/world>. Acesso em 12 de fevereiro de 2015.
WORLD BANK. World Development Indicators. Washington. Disponível em: <http://databank.worldbank.org>. Acesso em 07 de novembro de 2014.