http://dx.doi.org/10.21707/gs.v10.n04a17
I
dentIfIcatIonofurbanheatIslandsasasubsIdy forcreatIonofgreenareasKaIque brIto sIlva1 ; neylor alves calasans rego1 ; José WIldes barbosa santos2 & Pollyanna alves costa1 1Laboratório de Climatologia da Universidade Estadual de Santa Cruz. Mestre em Meio Ambiente. Universidade Estadual de Santa Cruz. E-mail para correspondência: kbritofb96@hotmail.com
2 Professor Pleno do Departamento de Ciências Ambientais da Universidade Estadual de Santa Cruz. 3 Professor Adjunto do Departamento de Ciências Ambientais da Universidade Estadual do Sudoeste da Bahia. 4 Professor Adjunto do Departamento de Ciências Ambientais da Universidade Estadual de Santa Cruz
Recebido em 23 de setembro de 2015. Aceito em 12 de julho de 2016. Publicado em 30 de setembro de 2016. abstract – High temperature in cities appears as one more added difficulty resultant from the environmental problems.
Nowadays scientists from all over the world have been addressing efforts in the sense of understanding the aspects that contribute to the increase of the urban temperature and its effects. In this way, the objective of this work was to identify heat islands in the urban area of the municipal district of Itabuna-Bahia. The used methodological procedure for identifying the heat islands was through the use of the data from the thermal sensor thermal of the satellites Landsat TM 5 and 7, being made the the necessary atmospheric corrections and conversions, allowing the surface temperature being displayed in levels of ash tones. The results showed temperature variations in the urban perimeter with identification of eight heat islands, whose places were characterized by the largest concentration of paved area and vegetation absence. It was also identified fifteen potential areas, for the implantation of green areas looking for the improvement of the temperature conditions in the identified hot points. These results can subsidize the urban planning, as support in the construction of strategies that would minimize the thermal discomfort.
Key Words: TemperaTure , urbanclimaTe, Greenareas
Resumo – Temperatura elevada em cidades surge como mais um agravante resultante das problemáticas ambientais.
Atualmente, cientistas de todo o mundo têm direcionado esforços no sentido de compreender os aspectos que contribuem para o aumento da temperatura urbana e seus efeitos. Desta forma, este estudo teve por objetivo identificar as ilhas de calor na área urbana do município de Itabuna-Ba. O procedimento metodológico empregado para identificação das ilhas de calor, foi através da utilização dos dados do sensor termal dos satélites Landsat TM 5 e 7, onde, posteriormente foram realizadas as correções atmosféricas, e conversões em unidades de temperatura dos níveis de tons de cinza gerados pelo satélite, para valores de temperatura da superfície. Os resultados mostraram variações de temperatura no perímetro urbano com identificação de oito ilhas de calor, cujos locais são caracterizados pela maior concentração de área pavimentada e ausência de vegetação. Foram identificadas quinze áreas potenciais, para a implementação de áreas verdes de formas a melhorar as condições de temperatura nos pontos quentes identificados. Estes resultados poderão subsidiar o planejamento urbano, como suporte a tomada de decisões, na construção de estratégias no sentido de minimizar o desconforto térmico.
Palavras chave: TemperaTura, climaurbano, Áreas-verdes
Resumen – Alta temperatura en las ciudades emerge como otro agravar de los problemas ambientales resultantes. Actualmente,
los científicos de todo el mundo se han dirigido esfuerzos para entender los aspectos que contribuyen al aumento de las temperaturas urbanas y sus efectos. Así, este estudio tuvo como objetivo identificar las islas de calor en la zona urbana del municipio de Itabuna-Ba. El procedimiento metodológico utilizado para la identificación de islas de calor, era a través del uso de los datos desde el sensor térmico de satélites Landsat TM 5 y 7, que más tarde se realizaron correcciones atmosféricas, y las conversiones de unidades de los niveles de temperatura de escala de grises generada por satélite a los valores de temperatura de superficie. Los resultados mostraron variaciones de temperatura en la zona urbana con la identificación de ocho islas de calor, cuyos sitios se caracterizan por la mayor concentración de área pavimentada y la falta de vegetación. Quince áreas potenciales han sido identificados para la implementación de áreas verdes a fin de mejorar las condiciones de temperatura en los puntos calientes identificados. Estos resultados pueden apoyar la planificación urbana, para apoyar la toma de decisiones, en la construcción de estrategias para minimizar la incomodidad térmica.
Palavras clave: TemperaTura, climaurbano, zonasverdes
IdentIfIcaçãodeIlhadecalorurbanacomosubsídIoacrIaçãodeáreasverdes
I
ntroductIonApproximately 1,5 billion people reside in areas considered urban, for the most part in the great metropolises. That occurrence corresponds to 18% of the total population. In a general way, such evidence is considered as the initial stage for the study of several areas of the knowledge that considered the man as a study object, because “the reality of the life is the urban agglomerate” (George, 1982; Pimentel and Burgs, 2015).
However, this reality is potentially considered as a place of environmental problems by the fact that the man transcended the original nature of the geographical space, promoting anthropization that produce changes in the place, and consequently several impacts over the life quality of the population.
The impacts of the urbanization on the air quality is one of the countless existent problems, and have been intensely worked during the last 20 years. Today, most of the population is exposed to the indexes of air pollution largest than what is recommended by the World Organization of the Health - OMS, and the due to this situation it is attributed approximately 400.000 deaths a year (Koken et al. 2003).
Government meetings with environmental focus since the one accomplished in Stockholm, 1972, together with the current reports of IPCC on World Climatic Changes foment the studies related to the climatic alterations in several areas. The heterogeneous composition of the intra-urban atmosphere emerges as harmful potential to the environmental quality and human health.
The air temperature of the first 2 m above the surface has been object of study of several works: Carnahan and Larson (1990), Katsouyanni (1993), Harvell (2002), Kuhn et al. (2002) and Garske et al. (2013) discussed about urban environmental health; Koken et al. (2003) correlated the temperature of the urban air with atmospheric pollution; Laaidi (2012) discussed the urban atmospheric pollution as being responsible for the morbidity risk.
However, the current center of the discussions about the elevation of the temperature in urban atmospheres is the phenomena known as heat islands. This islander concept appears with the intention of explaining the occurrence of urban places that presents higher temperatures. The heat formation is influenced directly by the presence of several factors, such as: the verticalization, the albedo, the absence of green areas and the intense circulation of vehicles (Santana, 2014).
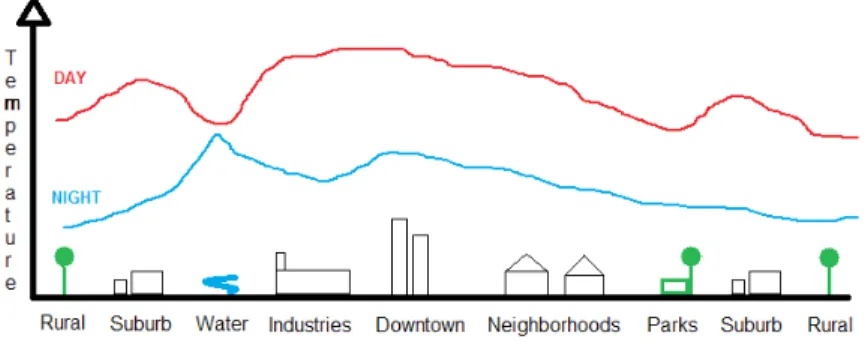
The occurrence of the heat islands intensifies in the centers of the great urban agglomerates, because of the larger amount materials of low reflection (albedo). In more off-center locations, the tendency is decrease of the temperature (Figure 1).
Other characteristics that influence in the formation and intensity of the heat islands are: geographic location, topography, geomorphology, meteorological conditions of the day, population density, among others (Carnaham and Larson, 1990; Santana, 2014).
In this way, several researches not only contemplate the surface temperature, but also strictly study the occurrence of heat islands. Lombardic (1985) studied the formation and consequences of heat islands in São Paulo; Kimura and Takashi (1991) studied the anthropic effects in the formation of hot places in the city of Tókio; Nichol (1994) studied the urban micro clime heating derived from new constructions in the city of Singapura; Mihalakakou and Santamouris (2004) made simulations heat islands occurrence in Mediterranean climates; Van and Bao (2010) accomplished a study on the impact of urban development in the elevation of surface temperatures using remote
sensing in the city of Ho Chi Minh, Vietnam; Sousa (2012) used data of terrestrial temperature to identify heat islands in the city of Goiânia.
To detect these “hot points” of temperatures, monitoring possibilities exist through meteorological stations installed in the urban agglomerate. But, in the last 30 years, tools related to the search of the atmospheric landscape data appeared, with more accessible costs compared to the in locus monitoring. The detection of heat islands is now possible through remote sensing techniques, resultant from the thermal sensor of the Landsat TM satellite.
The appropriate tool for handling the thermal data is the GIS’s - Geographical Information Systems. In this environment it is possible to visualize, correct and cut out thermal images and to overlay the studies areas, originating space representations (maps and cartograms) of the heat concentrations. It can also study focuses and burned displacement (Boschetti; Padilla, 2015).
Figura 1 – Temperature diagram in cities
Green Areas
The buffers creation and overlay layers in GIS’s also allow the creation of alternatives to reduce the effects high temperatures in punctual places. In this conception, the green areas emerge as the main solution to the occurrences of hot points in great centers.
Several authors discuss the definition of green areas. For Cavalheiro et al. (1992) the green areas are spaces with vegetation that were projected together with the urban equipments such as: parks, gardens, boulevards, forests, squares of sports, playgrounds, spas and margins of rivers, ponds and dams. Milano (1995) considered green areas as free areas in the city with characteristics predominantly natural, independent of the vegetation load. Guzzo (2006) affirmed that green areas are where there is the prevalence of arboreal vegetation in the urban way, ideal when there is the presence of water bodies.
The environmental and social benefits that the green areas provide are: the decrease of the pollution, reduction of the albedo, evapotranspiration increase the amount of shades, regulation of the air humidity and temperature, thermal comfort, protection against erosion and sedimentation of urban rivers, reduction the levels of noises and buffering the noise of the cities (Loboda and Angelis, 2005).
The study area of this research is the city of Itabuna (BA) characterized by the accelerated economical growth noticed through the appearance of an extensive urban area and verticalization
processes in zones of real estate valuation. However, the development does not consider, based on previous studies, the importance of the presence of green areas for mitigation the phenomena of the heat islands and atmospheric pollution (Laaidi, 2012).
The objective of this work was to use GIS tools to describe a method for identification of heat islands and to propose mitigation measures, considering the creation of new green areas in appropriate locations.
m
ethodologyStudy Area
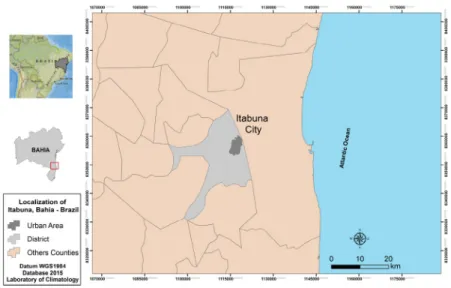
The study area of this work is the city of Itabuna (Figure 2). Located in the south area of the State of Bahia, is about 450 km of it distances of the capital Salvador. The area of the municipal district is of 433,198 km², with approximately 220.000 inhabitants (IBGE, 2010). It presents a demographic density of 461 inhab/km², and is the 5th more populous city of the state.
The centroid of the urban area has geographical coordinates of 14°47’09”S and 39°16’48”W. The local climate, according to Köppen (1936), is Tropical of Forest (Af) presenting total average annual precipitation of 1.629 mm. The native biome is the Atlantic Forest. The geomorphologic domain is defined like “range of hills’’ (Ab’ Saber, 1966) characterizing the city by mounds and hills up to 70 m of altitude
Figure 2 – Location of the municipality of Itabuna and its urban area.
Source: Cartographic Base of Climatology Laboratory of UESC.
The city is crossed by the Cachoeira River and became important for the state due the cocoa production during the first half of the XX century. Nowadays the economy is ruled by industries and businesses.
Due the growth of the city, existing today 81 neighborhoods arising from the geographical process called of urban swelling. In neighborhoods of high real estate value, the verticalization phenomenon has been intensifying since the first decade of the present century, promoting an artificial landscape. In compensation, the number of effective green areas (14 in the total) is still relatively low, resulting in an occurrence of 0,17 by neighborhood.
Temperature from the Thermal Sensor
The heat islands were obtained through the data of the sensor thermal of the satellites Landsat TM 5 and 8, respectively the bands 6 and 11, schedules of the day from point 70 of the orbits 215 and 216, among the years of 2011 and 2014 (Table 1).
The Landsat 5images were available in the site of the National Institute of Space Researches - INPE, and images of the Landsat 8 in the site of the American Geological Service - USGS.
Tabela 1 - Satellite images data
Orbits
Sensors Data Time
Landsat 5 28/06/2011 12:25
Landsat 8 21/04/2013 12:41
Landsat 8 24/04/2014 12:43
The thermal band has only the function of capturing temperature data, and it presents sensibility to thermal contrasts, being able to detect thermal properties of rocks, soils, vegetation and water.
The crossings of remotely obtained information produce a thermal image based on the presence of the infrared waves on the terrestrial surface, with a space resolution of 120m. In this way the resulted temperatures corresponds to a certain surface point. That group of spectral data is reproduced in geo-referenced or raster files with the thermal values represented in different ash tones.
Data Geoprocessing
Obtained the thermal data, it became necessary the accomplishment of atmospheric corrections and conversions in conventional units of temperature, considering that several variables exist in the remote sensing that can mischaracterize the reality of the landscape. Such variables are atmospheric elements as clouds, orbital inclinations, rays of solar storms, sediments in suspension and gases of combustions.
In first moment, atmospheric corrections were accomplished using the software IDRISI Taiga. With the imported rude images, the modules “ATMOSC” (correct automatically atmospheric influences) and “THERMAL” (convert the ash tones into spectral radiance values) were used.
Later, the corrected images were treated in the software SIG, being realized the conversion of the spectral radiance values to degrees Kelvin using Equation1 developed by Markham and Barker (1986), and available in the software ArcGis 9.3, Tollbox> “conversiontolls Landsat image”.
(Equação 1) Where:
T = temperature in ° Kelvin;
K2 = Calibration constant in ° Kelvin; K1 = Calibration constant in W/(m².sr.μm);
L
λ= sensor spectral radiance.
The calibrated values of the constants K1 and K2 (Table 2) are linked in the images TM parameters and given in the txt image files.
Table 2 - Calibration attributes
Calibration Constants TM Thermal
Units W/(m².sr.μm) Kelvin
Constant K1 K2
Landsat5 671.62 1284.30
Landsat8 774.86 1321.08
The Landsat images usually present a surface covering of approximately 32.000 km², being considered a regional scale covering. The great difficulty, in general, for the use of these images it is the cloud sometimes larger than 25%.
For a better speed in the processing of the thermal data, the extraction of the studied area of the initial image was accomplished, obtaining a polygon of the corresponding urban area of Itabuna (about 170 km²), concentrating the temperature information for study area.
That area extraction was accomplished in ArcGis 9.3 using Tollbox “Spatial Analyst>Extract by mask”. On to thermal images it was overlaid a layer of the 14 effective green areas of the Itabuna city (Itabuna, 2000).
Proposal of new Green Areas
After the identification of the urban heat areas of the Itabuna city, it was accomplished the search of places with potential to become green areas in the future.
It was observed works as the one of Burgess et al. (1988) and Carrus et al (2004) that described the importance of the applied space correlation among the “hotspots” and places with
Lλ
T= K2
potential for green areas creation. This arrangement is set up in the sense of turning the new areas close to the heat islands areas, as well permanent presence of persons and vehicle circulation.
That concern in relation to the proximity of the green areas with the urban actors was also mentioned by Vieira (2004) explaining that a success of a green area is noticed when it permeates four functions: social, educational, ecological and esthetic (Figure 3)
Figure 3 - Ideal scope of a green area.
The social function of a green area is the socialization possibility among the individuals in the proximity, without ranking. A place that can be used for leisure, sport and other entertainments. It can be pointed out the importance of the trees in filtering pollutants responsible for breathing diseases.
The aesthetic function feels in the sense of composing a beauty scenic for the city. The species of trees, the forests and the geographical position should evidence that portliness in the landscape.
The educational function is the use of those spaces to promote knowledge on the importance of the nature for the environmental balance in all the geographical scales.
Finally, the ecological function is the one that contemplates the importance of a green area in the environmental support of the area which is inserted. The contribution to mitigate the impacts of the atmosphere is the most important. Depending on the dimension and position in the city, it also favors the presence and circulation of fauna species and colonization of flora species.
This conception also embraces the fact that not always it is possible to find favorable places for forestation in the heat islands, but following the atmospheric circulation, places relatively close can soften this adversity.
In this way and observing the methodology presented by Vieira (2004), it was chosen for the identification and selection of squares, public lands and abandoned parks and not forested relatively close to the points of high temperatures.
In that stage of the work, it was performed two field campaigns in order to geo-reference the proposed places, using the following equipments: 1) apparels GPS’s Garmim Oregon 650 with accuracy of 2 m; 2) maps with the identified heat islands for environmental recognition and search for potential places for new green areas as proposed by Carrus (2013).
r
esultsanddIscussIonsHeat Islands
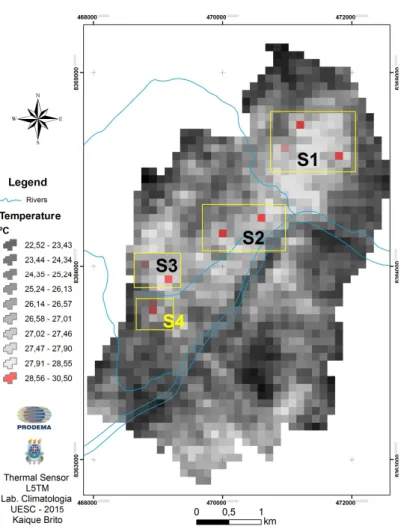
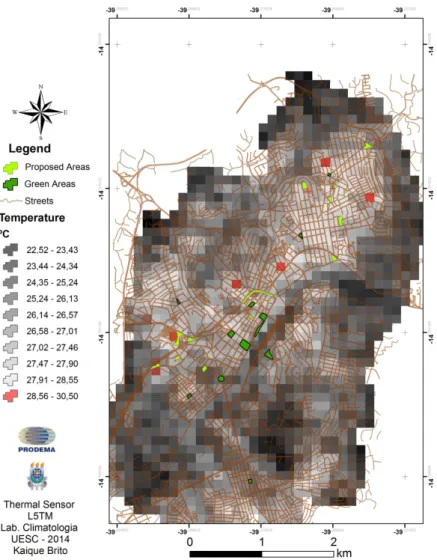
The overlay of the images from 2011, 2013 and 2014 allowed the identification of eight urban heat islands. This island concept is derived from the notion of an isolated point surrounded by a homogeneous landscape, and can be noticed in Figure 4. The images presented points of heat in common, observed more clearness in the sections S1 and S2. In this way, a pattern was observed in the occurrence of temperatures due to the environmental configuration of the places.
Figura 4 – Heat islands in the Itabuna city
As shown in Figure 3, the high temperatures differ from the environmental temperature pattern, both represented by colorations of caloric intensity proceeding from the black to the red, in a scale of degrees Celsius. This thermal behavior is connected to the local urban landscape.
Corroborating with the statements of Cifuentes (2001) and Barczak and Duarte (2012) that alerted for the negative environmental impacts from areas without the presence of elements that reestablish the natural atmospheric composition of the heat islands like the wind circulation, water retention and evapotranspiration. At the same time, asphalt implantations and constructions of dark color, absorb all the wave of the electromagnetic spectrum as well as the infrared, reproduced in the form of sensitive heat.
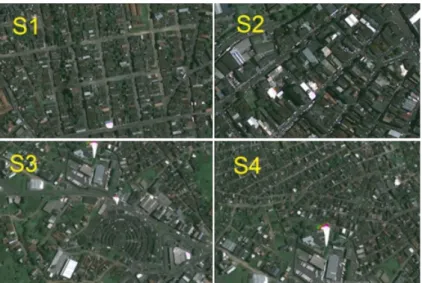
The heat islands presented regionalized occurrences and four groups can be observed in neighborhoods with high construction indexes, represented as S1, S2, S3 and S4 an Figures 4 and I landscape showed in Figure 5.
Figure 5 – View of the identified groups
Source: Esri Imagery, 2015
The group S1 occurs in the north zone of the city, specifically in the neighborhoods Fátima and California, that are respectively, the 3rd and 4th more populous neighborhoods of the municipal district. In this area of the city, occurs a condensed of houses with the absence of effective green areas. Besides, the symmetrical organization of the streets did not contemplate squares, parks and there are no water bodies in the region. These can explain the occurrence of the heat island in the zone.
The S2 group is located in the financial center of the city. The phenomenon of “space verticalization” is present in this area, what is responsible for the formation of the “urban canyons”, characterized by high constructions that difficult the air circulation and the dispersion of atmospheric pollutants. There is only a channeled stream crossing the area and the effect of the surface heating due the asphalt covering also define the occurrence of the heat island in the zone. The groups S3 and S4 (respectively the neighborhoods of Commercial Center and Santo Antônio) present a landscape of open areas used as parking lots. It is also noticed the presence of extensive coverings of commercial buildings of asbestos and aluminum.
It is important to point out that geomorphologic composition of the municipal district influences directly in the concentration of sensible heat due to the reduction of the circulation of air because the city is established in the bottom of fluvial valley of the River Cachoeira with an altimetry amplitude of about 87 m. The areas S3 and S4 show an increase of temperature, which fall in the peripherals regions.
The air temperature longitudinal profile in graphics (Figure 6) shows the lower temperatures in the surrounds areas of the city and higher in the places S1, S2, S3 and S4. Between S1 and S2 there is an area close to a small stream called Macuco, with lower temperatures due the presence of water. In S3 and S4 the temperatures were high, decreasing in the direction of the peripheral areas.
.
Figure 6 – Longitudinal temperature profile drawn between sectors 1 and 4.
New Green Areas
As already mentioned, there are 14 green areas Itabuna, according to the definitions of Cavalheiro (1992), Milano (1995) and Guzzo (2006). These areas are squares and some forests named in the downtown, for instance, Beira Rio’s Square, Garden of Ó and the Squares Olinto Leone and Camacan. Historically, such points were always portrayed as leisure places and scenic beauty.
Seeking for ideal places for proposing the installation of green areas with social, aesthetics, educational and ecological functions, it was identified 15 places with potential for forestation following the criteria presented in the methodology. There was also concern in identifying areas relatively close to the heat islands (Figure 7).
However, the proximity of the heat islands was committed due to the urban characteristics of the visited places. Even so, it was chosen in prospecting and to propose creation of green areas in adjacent zones considering the great population of the close neighborhoods, the presence of schools and eventual landscape improvement.
The S1 zone presented four areas with potential for green spaces, specifically around the in I spill him/it of the centroid of the rectangle (Figure 4). Even not having a spatial proximity
of such areas with the hot points, these zones could reduce the heat island considering an atmospheric microcirculation aided by the presence of a stream, stressing that evaporation and evapotranspiration are mitigating processes.
The zone S2 just presented one area with potential for the creation of a new green area located in a square following one of the main avenues of the city, Amélia Amado. In the sense of contemplating the proximity of the green area with the heat island, the circulation of people and vehicles is satisfactory in the proposed place regarding the social and ecological function presented by Vieira (2004)
In zones S3 and S4 the proposed areas for implantation of green spaces overlapped the heat islands.
f
InalconsIderatIonsThe presented method that uses tools of the Geographical Information Systems (GIS) and remote sensing presented effectiveness and operation simplicity in the identification of urban heat islands and can be used in any city that presents characteristics developing high temperatures spots. The identification of the 8 urban heat islands in the city of Itabuna using GIS techniques was suitable with the environmental characteristics of the visited places. The identified places consolidated the occurrence of high temperatures, sometimes noticed by the population and discussed in an empiric way.
According to the analysis of the longitudinal profile of the observed temperatures, as larger the urban agglomerate, larger the probability of finding hot points in the atmospheric landscape, specifically closer to the center of the cities. It is noticed by the several mentioned works and also of the presented results, that the occurrences of urban heat islands are coupled with the absence of any natural elements that reestablish a local micro-clime.
The proposed places for creating green areas they were relatively close the heat islands being able to mitigate the effects of the high temperatures.
The results of this work can subsidize the local authorities in organizing the urban spaces of the city in the way of softening the problems of the thermal discomfort in some areas of the city, improving the population health.
a
cKnoledgemnetsTo the Fundação de Amparo a Pesquisa do Estado da Bahia - FAPESB for the financing; to the Master Program in Environment and to the Laboratory of Climatology of State University of Santa Cruz for the available infrastructure.
r
eferencesAB’ Saber AN. 1966. Domínio dos “Mares de Morros” no Brasil. Geomorfologia. São Paulo, (2): 1-9.
Barczak R and Duarte F. 2012. Impactos Ambientais da Mobilidade Urbana: Cinco categorias de medidas mitigadoras. Revista Brasileira De Gestão Urbana, 4(1): 13-32.
Boschetti L. 2015. MODIS – Landsat fusion for large area 30 M burned area mapping. Remote
Sensing Of Environment, 12(1):, 33-47.
Burgess J, Harrison CM and Limb M. 1988. People, Parks And The Urban Green: A Study Of Popular Meanings And Values For Open Spaces In The City. Urban Studies, 25(7): 455-473 Carnahan WH and Larson, RC. 1990. An Analysis of an Urban Heat Sink. Remote Sensing Of
Environment, 33(1): 65-71.
Carrus G, Passafaro P and Bonnes M. 2004. Ambientalismo, Etnocentrismo e Dautoritarismo: Una Scala Di Atteggiamento Verso Verde Urbano. Bollettino Di Psicologia Applicata, 24(2): 3-12.
Carrus G. 2013. Relations between naturalness and perceived restorativeness of different Urban Green Spaces Las Relaciones entre La Naturalidad y el potencial restaurador percibido De Dife-rentes Zonas Verdes Urbanas. Psyecology, 4: 227–244.
Cavalheiro F and Del Picchia PCD. 1992. Áreas Verdes: Conceitos, Objetivos E Diretrizes Para O Planejamento. Anais do 1º Congresso Brasileiro Sobre Arborização Urbana, 2(5): 29-38.
Cifuentes L. 2001. Assessing The Health Benefits Of Urban Air Pollution Reductions Associated With Climate Change Mitigation (2000-2020): Santiago, São Paulo, Mexico City, And New York City. Environmental Health Perspectives, 109(3): 419-425
Dockery DW. 2001. Epidemiologic Evidence Of Cardiovascular Effects Of Particulate Air Pollu-tion. Environmental Health Perspectives, 109(4): 483-486
Garske T, Ferguson N and Ghani, A. 2013.Estimating air temperature and its influence on Malaria transmission across Africa. Plosone, 8 (2): 64-87.
George P.1983. Geografia Urbana, São Paulo: Difel, 195 p.
Gouveia N.1999. Saúde E Meio Ambiente Nas Cidades: Os Desafios Da Saúde Ambiental. Saúde
E Sociedade, 8(1): 49-61.
Guzzo P. 2006. Cadastro Municipal De Espaços Livres Urbanos De Ribeirão Preto (Sp): Acesso Público, Índices E Base Para Novos Instrumentos E Mecanismos De Gestão. Revista Da
Socie-dade Brasileira De Arborização Urbana, 13(2): 1-1513(2)1-15
Harvell C. 2002.Climate Warming and disease risks for terrestrial and marine biota. Science, 296 (5576): 2158-2162.
Itabuna. 2000. Lei Nº 1324. Normas e Diretrizes Do Desenvolvimento Urbano Do
Mu-nicípio De Itabuna. Itabuna: Jornal Oficial, 20 Dez. 0: 1-8.
Katsouyanni K.1993. Evidence for interaction between air pollution and high temperature in the causation of excess mortality. Environmental Health: An International Journal, 48(4): 235-242.
Kimura F, Takahashi S. 1991.The Effects Os Land-Use And Anthropogenic Heating On The Sur-face Temperature In The Tokyo Metropolitan Area: A Numerical Experiment. Atmospheric
En-vironment, 25(2): 155-164.
Koken P, Piver WYF, Elixhauser A, Olsen L and Portier C. 2003. Temperature, Air Pollution, And Hospitalization For Cardiovascular Diseases Among Elderly People In Denver. Environmental
Health Perspectives, 111(10): 1312-1317.
Koppen W. 1936. Das Geographisca system der Klimate, In: Handbuch Der Klimatologie. Editado Por: Koppen, W. And Geiger, G.1-44.
Kuhn K, Campbell D and Davies C. 2002. A Continental risk map for Malaria Mosquito (Diptera: Culicidae) vectors In Europe. Journal Of Medical Entomology, 39(4): 621-630.
Wave. Environmental Health Perspectives, 120(2): 254-259.
Loboda CR and Angelis BLD. 2005. Áreas Públicas Urbanas: Conceito, Uso E Funções.
Ambiên-cia, 1(1): 125-139.
Lombardo MA. 1985. Ilha De Calor Nas Metrópoles: O Exemplo De São Paulo – São
Paulo: São Paulo, Hucitec, 100 P.
Markham BL and Barkerj L. 1986. Landsat Mss And Tm Post-Calibration Dynamic Ranges, Exoat-mospheric Reflectances And At-Satellite Temperatures. Earth Observation Satellite. Landsat Tech. Unites States.
Milano M S. 1995. Arborização Urbana. In: Universidade Livre Do Meio Ambiente. Curso
So-bre Arborização Urbana. Curitiba.
Mihalakakou G and Santamouri M. 2004. Simulation Of The Urban Heat Island Phenomenon In Mediterranean Climates. Pure and Applied Geophysics, 161(2): 429-451.
Nichol JE. 1994. A Gis - Based Approach To Microclimate Monitoring In Singapore’s High-Rise Housing Estates. Photogrammetric Engineering & Remote Sensing, 60(10):1225-1232. Padilla M. 2015. Comparing The Accuracies Of Remote Sensing Global Burned Area Products Using Stratified Random Sampling And Estimation. Remote Sensing Of Environment, 160: 46-67.
Pimentel D and Burgess M. 2015. World Human Population Problems. In: Reference Module.
Earth Systems And Environmental Sciences, p. 122-142.
Santana NC. 2014. Investigação De Ilhas De Calor Em Brasília: Análise Multitemporal Com En-foque Na Cobertura Do Solo. Revista Brasileira De Geografia Física, 07(06): 1044-1054. Sierra MPV, Teran LM. 2012. Invited Reviews Series: Air Pollution And Lung Health.
Respiro-logy, 17: 1031-1038.
Sousa, SB. 2012. Temperatura Superficial: Procedimentos E Técnicas Utilizadas Para
Processar E Gerar Dados De Temperatura Superficial Terrestre (°C) Para O Municí-pio De Goiânia-Go. Laboratório De Processamento De Imagens E Geoprocessamento. Texto
Explicativo.
Van TT and Bao, HDX. 2010. Study of the impact of urban development on surface temperature using remote sensing in Ho Chi Minh City, Northern Vietnam. Geographical Research, 48(1): 86-96.
Vieira, P. B. H. 2004. Uma Visão Geográfica Das Áreas Verdes De Florianópolis, Sc:
Es-tudo De Caso Do Parque Ecológico Do Córrego Grande (Pecg). Universidade Federal