Big data analysis for accurate decisions
Internship at Neoway
Thiago Turini Alves Pinto
Internship Report presented as the partial requirement for
obtaining a Master's degree in Data Science and Advanced
Analytics
NOVA Information Management School
Instituto Superior de Estatística e Gestão de Informação
Universidade Nova de Lisboa
Big data analysis for accurate decisions
Internship at Neoway
by
Thiago Turini Alves Pinto
Internship Report presented as the partial requirement for obtaining a Master's degree in
Data Science and Advanced Analytics
Advisor: Flávio Luís Portas Pinheiro
iii
DEDICATION
This report is dedicated to all my friends and family who helped me in this new phase of my life, helping me in my career transition in Portugal.
I would also like to thank my colleagues at Neoway, my classmates and professors at NOVA IMS, essential to my evolution in the Data Science universe.
In particular, I would like to thank my mother and my sister for their emotional support and help in all the difficulties in different scales, natures and reasons.
iv
ACKNOWLEDGEMENTS
I would like to thank my great friend, co-worker, João Bornhausen for the opportunity and for all the moments lived in Portugal. For his intelligence and dedication, which contributed to the
advancement of Neoway in Portugal and helped me to grow professionally. I cannot forget to mention the support of Neoway's visionary founder and CEO, Jaime de Paula and also the great fanatic, excellent salesman and also a partner in the company, Rodrigo Barcia.
In addition, I would like to thank Ph. D. Flávio Pinheiro for guiding me in this paper and contributing his excellent and pertinent observations.
v
ABSTRACT
It is commonly shared that data is very valuable today and that big data is a trend term and a concern in business. However, transforming data into information that supports decisions is not a simple task, and this is the basis of work for Neoway, a Brazilian company with an office also in the United States and a recently created in Portugal. This report is based on the construction of a viable product for potential customers in Portugal and also my experience in perspective as a Data Scientist in this endeavor. Experience in which I was able to apply a lot of knowledge learned in the Master of Advanced Analytics and I was also able to verify in practice all the challenges in the creation of variables through concepts of Data Mining, Machine learning and statistical studies.
KEYWORDS
vi
INDEX
1. Introduction ... 1
1.1. Neoway ... 2
1.2. Neoway in Portugal ... 3
1.3. Proof of concept ... 4
1.4. Internship motivation and definition ... 4
2. Theoretical framework ... 6
2.1. Data Mining ... 6
2.1.1. Definition ... 6
2.1.2. Data Mining and Machine Learning ... 8
2.1.3. Machine Learning ... 9
2.1.4. Data Mining Process ... 9
2.2. Big Data ... 11
2.2.1. Definition ... 12
2.2.2. Technologies ... 12
2.2.3. Challenges ... 13
3. Tools and technology ... 14
3.1. SIMM ... 14
3.2. Python ... 16
3.3. Databricks ... 16
3.4. DataGrip ... 17
4. Projects ... 18
4.1. Data capture and integration ... 19
4.1.1. Business understanding ... 20
4.1.2. Data sources – Marketing Intelligence ... 21
4.1.3. Data sources – AT e SS ... 23
4.2. Segmentation Variables ... 25
4.2.1. Business Understanding ... 26
4.2.2. Preprocessing ... 28
4.2.3. New variables ... 31
4.2.4. SIMM ... 41
4.3. Portugal 2020 ... 41
4.3.1. Business Understanding ... 41
vii
4.3.2. Introduction of NLP ... 43
4.3.3. Results ... 43
5. Conclusions ... 45
5.1. Overall evaluation of the internship ... 45
5.2. Lessons learned ... 46
viii
LIST OF FIGURES
Figure 1. Neoway offices. Source: Neoway ... 2
Figure 2. Neoway in numbers. Source: Neoway ... 2
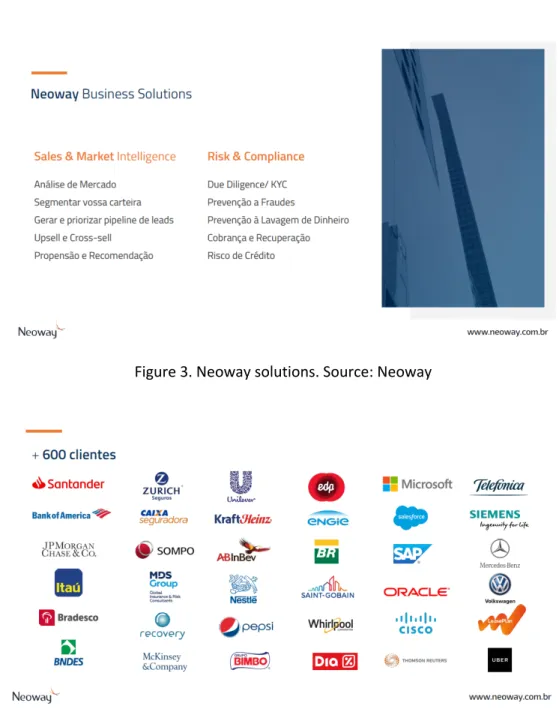
Figure 3. Neoway solutions. Source: Neoway ... 3
Figure 4. Neoway global clients. Source: Neoway ... 3
Figure 5. Neoway’s timeline. Source: Neoway ... 4
Figure 6. Adaptation Data mining adopt techniques from different domains. Source: Han,
Kamber, & Pei, 2012 ... 8
Figure 7. SIMM overview. Source: Neoway ... 14
Figure 8. Feature Search on SIMM. Source: Neoway ... 14
Figure 9. Maps on SIMM. Source: Neoway ... 15
Figure 10. Pathfinder on SIMM. Source: Neoway ... 15
Figure 11. Neoway's data process. Source: Neoway ... 18
Figure 12. Data inputs for SIMM. Source: Neoway ... 20
Figure 13. Neoway in Neoway data funnel in Portugal. Source: Neoway ... 25
Figure 14. POC timeline. Source: Neoway ... 26
Figura 15. CAES. Source: Neoway ... 27
Figure 16. Preprocessing. Source: Neoway ... 30
Figure 17. Outlier analysis. Source: Neoway ... 31
Figure 18. Propensity variable. Source: Neoway ... 32
Figure 19. Cluster analysis. Source: Neoway ... 34
Figure 20. Different numbers of clusters. Source: Neoway ... 34
Figure 21. Propensity classification. Source: Neoway ... 35
Figure 22. Classification problem. Source: Neoway ... 36
Figure 23. Propensity imbalanced data model. Source: Neoway ... 36
Figure 24. Variáveis preditivas. Source: Neoway ... 39
ix
LIST OF TABLES
Table 1. Marketing intelligence data captured ... 22
Table 2. Classification models and parametes ... 37
Table 3. Regression models and python algorithms ... 38
Table 4. IAPMEI rules for businesses. Source: https://www.iapmei.pt/ ... 40
x
LIST OF ABBREVIATIONS AND ACRONYMS
SIMM Sistema de Inteligência Multi-MercadoPOC Proof of concept
PaaS Platform as a Service
ETL Extract-Transform-Load
IDLE Integrated Development and Learning Environment
HDFS Hadoop Distributed File System
SVM Support Vector Machine
1
1. INTRODUCTION
Big data is a term that refers to a collection of text, numbers or symbols in raw or unorganized whose size, complexity and rate of growth make them difficult to be extracted, managed, processed and analyzed. And Big Data is transforming our society. In a variety of applications, in the sciences, arts, politics, sports, business. It contributes to many verticals in different industries and is often common in large company daily routines that lead to better decisions and strategic business moves.
When Big Data is successfully extracted, processed, and analyzed, organizations and individuals are able to gain a more complete understanding of their environment, customers, products, competitors. Which can lead to efficiency improvements, increased sales, better customer service, lower costs, lower risks. In order to discover new information, gain important patterns and insights, data management goes through a process commonly called Big Data Analytics which is one of the last steps in a procedure such as Extract-Transform-Load (ETL) in order to know, explore, make associations and find out more about the data that was obtained.
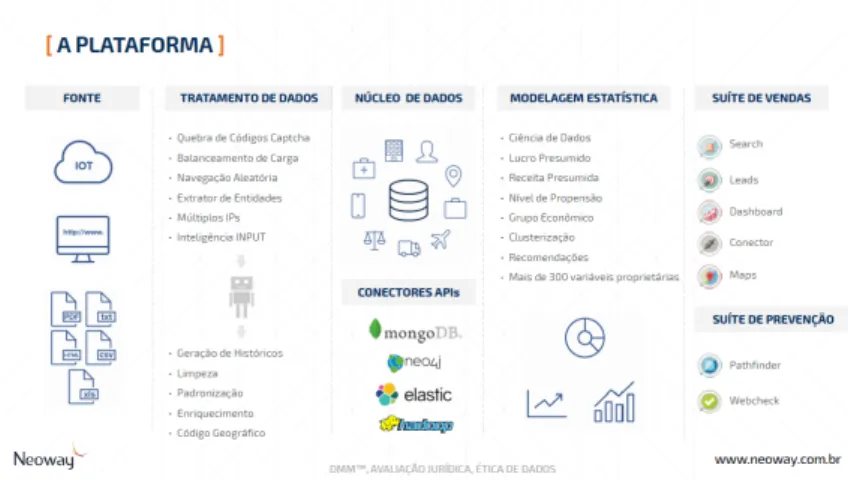
Neoway, company founded in Brazil, specializes in building market intelligence solutions through its scalable Big Data Analytics platform known as SIMM (Integrated Multimarket System). It combines software tools, databases and statistical models to help customers obtain information relevant to their business. The platform SIMM it is a PaaS, platform as a service, which refers to cloud-based platform services that provide developers with frameworks which can use to create customized applications. All servers, storage, and networking can be controlled by a third-party provider. Leading to more effective development, testing and deployment processes.
Neoway's proposal is to provide a Big Data Analytics platform to help its customers gain more information and knowledge on two main fronts, marketing analytics and loss prevention. Helping the company gather external data and integrate it with internal data, transforming that huge amount of data into useful, easy-to-view and assimilate information to support business decisions.
This whole system, in which this information obtained from this meeting from external and internal data sources is transformed into knowledge is involved by professionals from different areas. The constant advancement in automation and the ease of manipulating this information on the platform creates the illusion that this result is achieved with distant human help. Among many professionals who work so that there is no mistake in this process, there is a professional who needs to understand the needs of a business, turn them into questions that can be answered through the data, also certify what transformations are necessary for this data to be included and subsequently presented. This professional at Neoway receives the title of Customer Data Scientist.
This paper will describe an experience as a Customer Data Scientist at Neoway in in 2018/2019. The internship report is presented as a as partial requirement for obtaining the Master’s degree in Advanced Analytics.
During this experience the author was able to work with different projects for different companies. This article focuses on the most important projects developed for the largest customer during this period. The objective of the paper is to present a complete Customer Data Scientist experience, showing a broad view of the main activities developed and commenting on the difficulties and lessons learned.
2
1.1. NEOWAY
Figure 1. Neoway offices. Source: Neoway
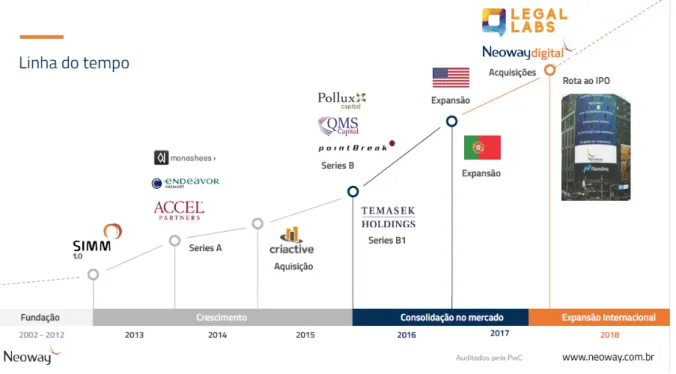
Headquartered in Florianopolis, with commercial offices in Sao Paulo, New York and Lisbon, Neoway was born in a University. In 2002, the electrical engineer Jaime de Paula, founder of the company, developed a doctoral thesis on the integration of different databases in a single platform. He created software for the Santa Catarina Public Security Bureau that identified patterns between police occurrences to help to find criminals. The case came to the attention of the New York Police, who invited him to talk about it. In the United States, Jaime was impressed by the technologies that allow you to analyze huge amounts of data at an amazing time.
Later then he decided to start a new project combining big data with a geo-referencing tool. Since then the company has worked with over 3.000 databases from 600 sources and has received investments from some of the world's leading funds such as Accel Partners, Monashees, Temasek, PointBreak, Pollux, and Endeavor Catalyst. During the year of 2019 had over 400 employees.
3 Neoway is considered the largest company in Latin America for Big Data Analytics and Artificial Intelligence for business. It offers intelligent solutions that transform information into knowledge and generate productivity and accuracy for marketing strategies, compliance, loss prevention, among others.
Figure 3. Neoway solutions. Source: Neoway
Figure 4. Neoway global clients. Source: Neoway
1.2.
N
EOWAY INP
ORTUGALThe beginning of my activity as Data Scientist at Neoway coincided with the beginning of Neoway in Portugal. In order to expand to European markets and also generate more value for the brand, the company landed on Lisbon in order to assess the country's environment, analyze opportunities and get leading customers in its industries to test its business model.
4 My work routine has gone beyond an average Data Science internship. I also had the opportunity to experience the challenges for the process of Neoway internationalization, a combination of startup routine based on many testing and validation with internal meetings with Brazil and USA. Which fortunately required me on all the levels of decisions in terms of Data Science, allowing me to have flexibility and also opportunities to apply my previous business experiences and knowledge to help the Portuguese office in needs of management, planning, strategies and tactics.
Figure 5. Neoway’s timeline. Source: Neoway
1.3. PROOF OF CONCEPT
During my first month at Neoway we were still defining the best product/market fit. There were some negotiations in progress, but nothing yet concluded. After some meetings where we presented the product to potential companies, we decided to offer a proof of concept (POC) for some of them. The POC featured a short, simple and incomplete implementation that preceded the final version of the product and thus seek to validate the software still in its conceptual stage.
The first company to close a deal was our biggest client in 2019, which we developed our biggest project, the one I was working most of my time. In this company that for reasons of reliability contract need to remain anonymous we developed the POC project for 6 months. We set the main objectives for each of the areas, the main risks and alternatives, as well as the deadlines and key performance indicators to measure our work and achievements. After the interest of both sides a presentation was conducted to present the results obtained for the continuing of the partnership.
1.4.
INTERNSHIP MOTIVATION AND DEFINITIONMy idea of working at Neoway was to gain hands-on experience in the Data Science field, especially to understand how the market matches the theoretical lessons we had in our first year of Masters. Neoway has enabled me to understand customer needs, challenges, problems and desires. I could
5 gain a more holistic view of the difficulties, interests in this segment, beyond the specific techniques and knowledge I had implemented.
I also had a challenge to become the technology spokesperson at Neoway Portugal. And in a meeting with clients and prospects in Portugal, I was the person who represented the entire company when it came to more technical details. This interested me and served as motivation, because I also intend to complement my management and business experiences to work with management to assume positions of higher hierarchy in the future.
My work as a Data Scientist at Neoway did not have a strict and defined scope with activities, deadlines and other details. In this startup environment, the work required me considerable flexibility to meet the most important needs that arose. The most important thing was always to build value beyond the platform we delivered to customers, according to the specific demands, understanding needs and problems, and customizing the solutions for each situation and customer. Analyze the context in which the platform would be implemented to extract more value from the frequent use of our clients.
I worked developing web scraping codes, leading meetings, creating algorithms for machine learning, defining subjective measures to apply new created variables, searching for new data sources, developing partnership proposals, alternating between formal and informal clothes, computers and huge rooms. meetings. All the most relevant will be detailed in this report.
6
2. THEORETICAL FRAMEWORK
2.1. D
ATAM
ININGData Science has gained a lot of prominence recently, and more and more people are talking about Data Science, Artificial Intelligence, whose theoretical basis has been studied for a long time. Much for the results obtained, for the direct relation with the successes in the organizations and for the availability of data. This science that is often related to the new century had its roots in the last century, with other views, interpretations and applications. Much of what is seen today relates to what was studied some time ago, the term Data Mining itself does not have the same popular appeal, but all the problems, solutions, questions that the subject brought up a few years ago are mixed with what we see today. We can say that data mining studies are fundamental for
understanding what data science is today.
The concepts of Data mining are broad and differentiate many times, this is also because over time it has undergone changes, innovations and improvements. The basis is simple, the derivatives are different, we see the authors citing common bases, but we also see authors adding new techniques, methodologies, applications that obviously appeared within an area that is constantly improving. The intention of this chapter is through the literature review provide an overview of the main terms in such a way that is connected to my experience at Neoway, exposing the different views on the subject and the reasons for why it has become more commonly used.
2.1.1. Definition
Data mining in essence is the practice of examining data that has already been collected. This act of examining is done through different types of algorithms, in order to generate new information and find patterns, in the end to help make more correct decisions. And to achieve this objective, some steps and processes are developed, steps of different natures and with different objectives, such as finding similarities, associations and anomalies. There are several different methodologies and for each project, the procedures and details are unique, requiring professionals who can translate the final interests into the choices of the best stages, processes and tools.
The importance of Data Mining was better noticed as soon as the use of information started to be more widely used, this coincided with this transformation of the data sciences, a digital
transformation that provided a greater amount of data and also a greater possibility of applications. This shows that the intelligence and process of Data Mining, despite being known, had an evolution where more professionals started to get involved, efforts on the part of the market started to reflect on more technologies and methodologies. The need, the most significant results that were made possible by cross-cutting areas, further boosted studies involving data mining.
It is important to consider what experts say on the subject, especially when they associate
technology with human intelligence, Weiss & Indurkhya for instance suggest that Data mining is “the search for valuable information in large volumes of data. It is a cooperative effort of humans and computers. Humans design databases describe problems and set goals. Computers sift through data, looking for patters that match these goals.” (2018, p. 1). And in a simple and summarized way, Data
7 mining is the process of extracting previously unknown, valid, and actionable information from large databases and then using the information to make crucial business decisions. (Cabena, Hadjinian, Stadler, Verhees, & Zanasi, 1998)
Despite the same main ideas, related to data extraction and transformation into knowledge, the definitions over time were subject to minor additions regarding the new technologies that were added and that made possible new applications. “Statisticians were the first to use the term ‘data mining’. Originally, ‘data mining’ or ‘data dredging’ was a derogatory term referring to attempts to extract information that was not supported by the data. Today, ‘data mining’ has taken on a positive meaning. Now, statisticians view data mining as the construction of a statistical model, that is, an underlying distribution from which the visible data is drawn”. (Leskovec, Rajaraman, & Ullman, 2016, p. 1)
Today, through applications made available on mobile phones, they capture data and return
information in real time. And most importantly, they provide gains in principle for all parties, for the user, for the tool, for internet providers, vendors of software, software and possible advertisers. Because one of the ideas of Data mining is to better characterize a segment and for example better understand a niche of consumers. Therefore, the use of data will be created to better serve
customers, in a more customized, more specific way, providing content, returning more accurate and efficient results.
Data mining can also be considered a transformation process. It is a metaphor for the final stages of a factory that aims to deliver reliable and quality information. These final processes involve a
transformation not only of individual resources, but that involve the complete set of these resources. It is not possible to do Data Mining with a unit of the data obtained, so all that have been extracted and transformed are used. In this sense, the collective view of these data becomes extremely important, which also shows the complete dependence on the predecessor stage and associates the quality of the data mining process with the quality of this collective.
Weiss & Indurkhya, in 2008 reinforces this idea. “Although data mining is an emerging field, it draws many of its basic principles from mature concepts in databases, machine learning and statistics.” (p.1). With the accumulation of data and information currently generated, mainly due to Big Data issues, another area highlighted later on, a lot of useful knowledge can end up being lost. It is necessary to analyze this data and look for patterns, rules, associations, look for relationships that at first sight do not appear, but after a lot of exploration, correct questions, methodologies and
knowledge in the field of statistics, artificial intelligence and also management and other
complementary areas they can be discovered. The professional in this area uses a lot of technical knowledge and creativity to be able to extract the maximum amount of information that today is extremely valuable for later creating strategies, products and plans for different proposals.
The concept of Data Mining evolves with the measure of new knowledge that is being applied, not only with the discovery of new technologies, but with the application of these technologies on a large scale.
8 Figure 6. Adaptation Data mining adopt techniques from different domains. Source: Han, Kamber, &
Pei, 2012
Data mining as a transformation process, like the final stages of a factory can produce different forms of information. It all depends on what the objective is in the construction of this factory and also the by-products generated. Therefore, the applications are different and very wide, since it is an area with a lot of potential and that allows many extractions.
Thinking about the collective use of these data, the applications allude to the different ways they relate. And non-evident relationships that will be discovered through a wide range of methodologies and techniques. The different types of supervised and unsupervised methods divide two large groups of applications that are still further specified. For example, anomaly detection and segmentation through clustering, belong to the same group of unsupervised methods but with different objectives. The different methods later in this report will give a better example of these applications.
2.1.2. Data Mining and Machine Learning
Machine learning aims to build and study systems through algorithms that can learn from data and improve data mining strategies for different problems. It is inserted in the universe of data mining, so they do not represent the same thing, they are different concepts. Often confused, because they are two areas that contribute to the transformation of data into information, however Data Mining is related to a stage of this transformation of data into knowledge and machine learning is a type of intelligence used to optimize these transformations. Human intelligence is limited, for different reasons, time, priorities, objectives, capacity, to find relationships, rules, trends, associations. Machine learning is an alternative to help human intelligence to obtain better results in the questions and answers dealt with by Data Mining.
The advances in artificial intelligence, machine learning, together with the increase in references, techniques and methodologies used by data mining, have made it easier for data science
Statistics Data warehouse Database systems Information retrieval Data Mining Applications
Machine learning Pattern recognition
Algorithms Visualization
High-performance computing
9 professionals in the search for improvements in the evaluations of the models created, many
algorithms have been developed and are constantly adapting. This combination allowed the development of data analysis in a broader way, even though its process was not fully described and with apparent relationships not obvious by a human. This artificial intelligence is more an ally to human beings in the development of any projects involving data, this makes it clear that the human being remains the fundamental piece, defining the questions, creating the plans, interpreting the analyzes, structuring the processes that involve all the design and data mining.
2.1.3. Machine Learning
Any system that needs to make a decision can benefit from Machine Learning, especially when we have to make decisions based on huge amounts of data. I like the succinct definition of Murphy (2013) that Machine Learning is a set of methods that can automatically detect patterns in data, and then use the uncovered patterns to predict future data, or to perform other kinds of decision making under uncertainty.
Machine Learning has inverted or reinvented a data work order, unlike traditional software
development for example. Instead of creating a consistent logic to define an object, machine learning understands what make up the objects being investigated, so in the addition of a new object it can define based on the characteristics studied.
Machine Learning is basically to enable systems to learn how to make decisions based on certain algorithms that perform data analysis, which must be structured, well formatted and organized to avoid passing wrong information to the computer in the phase known as training.
There are countless places where we can apply Machine Learning, the use in health is increasingly present, in the search for disease treatment and epidemiological control. But also, in everyday use, in recommendation systems, such as media streaming services, cell phone applications, banking
systems, work tools, always making it possible to develop ever more intelligent systems so that in the end they help our lives in a way general. The application extends to countless possibilities, always connected to this macro structure of capture, data transformation and analysis.
2.1.4. Data Mining Process
Each data mining process is different from the other and there are great differences between them, however there are methodologies and studies that try to make these processes more organized, which seek to define a chain of activities to obtain more value in the transformation of initial resources. A standard data mining system basically involves understanding the environment, preparing the data, modeling, evaluating modes and implementing
Understanding is the first step, which aims to analyze the business, the environment, understand the context, define the questions to be answered and verify that the data is sufficient to answer them. The understanding of the data is extremely important in this sense, also using the visualization tools, the exploration and the understanding of the variables and different types. This step takes into account all challenges in the management area as well.
10 Data preparation also known as pre-processing aims to make modeling possible, improve model performance and make the process faster. This involves different types of approaches ranging from analysis of the missing data and the collinearity of the variables obtained.
Following the preparation processes, mathematical models are created and used to find patterns in the data using specific tools. The models vary according to the highlighted problems, according to the planning elaborator initially. Findings are evaluated and compared to business objectives to
determine whether they should be implemented in the organization. And in the last step, discoveries are shared in operations and transformed, for example, into processes.
Roiger & Geatz (2017) define data mining as a four-step process: 1. Assemble a collection of data to analyze
2. Present these data to a data mining software program 3. Interpret the results
4. Apply the results to a new problem or situation
Before you actually begin developing a data mining system, you will first need to think about how to model the data in order to get the most from your information sources. Data modeling is done in order to translate the raw data structures into a format that can be used for data mining. The models you create will determine the types of results that can be discovered in your analysis. By
characterizing your data in terms of types and formats, you will know from the outset what your data modeling options are, and therefore what types of discoveries you can expect to make. (Westphal & Blaxton 1998)
But it is very important to highlight an essential step for a Data Mining project, a step prior to any involvement with the techniques and tools. The planning, a step to identify the questions that will be asked and that will be answered throughout the project, to help in the organization of work and to use efficiently and effectively the resources to fulfill the objectives. The contributions of humans to data mining are often neglected. Results are dependent on the predictive value of the features. It is the human who specifies the set of features, who usually knows to discard the junk and who investigates how to transform the original features into better features. The human has a critical design role to play in data mining.
The success of the effort is dependent on the problem design. Once some results are found, the human must react to these results. The data may be transformed in the many different ways. Every possible variation cannot be tried, but those that are tried can be effectively evaluated. No universal best approach is describable for data mining, making good decisions is part art, part science. Our task Data mining has a major separation into two main processes: supervised and unsupervised learning. The goal of supervised learning is prediction or classification. Unsupervised tasks focus on
understanding and describing the data to reveal underlying patterns within it.
In 2017, according to Roiger & Geatz, data mining strategies can be broadly classified as either supervised or unsupervised.
• Supervised learning builds models by using input attributes to predict output attribute values. Output attributes are also known as dependent variables as their outcome depends
11 on the values of one or more input attributes. Input attributes are referred to as
independent variables.
• Unsupervised learning, the output attribute does not exist. Therefore, all attributes used for model building are independent variables.
A process is considered supervised learning if the purpose of the model is to predict the value of an observation. The easiest way to conceptualize this process is to look for a single output variable. Common analytical models used in supervised data mining approaches are linear and logistic regressions, time series, classifications made by decision trees and neural networks for example. Recommendation systems employ unsupervised learning to track user patterns and provide personalized recommendations to improve the customer experience. Common analytical models used in unsupervised data mining approaches are clustering, association analysis, principal component analysis.
Within the supervised learning strategies, the most common way of dividing, also addressed by Weiss & Indurkhya (2008), there are two central types of prediction problems, the classification and regression. Hand, Mannila, & Smyth contribute to make it even simpler, in classification the variable being predicted is categorical, while in regression the variable is quantitative. (2012)
Unlike classification and regression, which analyze, class labeled data sets, clustering analyzes data objects without consulting class labels. Clustering is an example of association mine technique in unsupervised learning strategy. And perhaps the most well-developed and commonly used form of combinatorial data analysis, which we might characterize as those methods concerned in some way with the identification of homogeneous groups of objects, based on whatever data are available, Arabie, Hubert, & Soete, 1999)
To contribute to the description of the model that was widely used in the project, cluster analysis has been widely used in many applications such as business intelligence, image pattern recognition, web search biology, and security. In business intelligence, clustering can be used to organize a large number of customers intro groups, where customers within a group share strong similar characteristics. Techniques are used to discover interesting associations between attributes contained in a database. (Han, Kamber, & Pei, 2012) (Roiger & Geatz 2017)
While it is possible to use each approach independently, it is quite common to use supervised and unsupervised methods during an analysis. Each approach has unique advantages and combine to increase the stability and overall utility of data mining models. Supervised models can benefit from nesting variables derived from unsupervised methods. Since unsupervised approaches reveal the underlying relationships in the data, analysts should use the insights of unsupervised learning as a starting point for supervised analysis.
2.2. B
IGD
ATABig Data is a term like Data Mining that is very simple but allows for different interpretations and is increasingly receiving attention and different approaches. Big data reflects a very significant change in our society. And therefore, as my experience took place in a company whose main product is a platform for Big Data analytics, it is important to mention its main concepts, technologies and challenges.
12
2.2.1. Definition
As a valuable process, data mining is hampered by the increase in the quantity and complexity of Big Data. When millions of data of all types are collected by organizations at all times, it is necessary to find different ways to extract, analyze and gain insights.
The term Big data is widely characterized by different 'V', often by 3 or 4 main ones: volume, variety, velocity and veracity. Volume describes the challenge of storing and processing the huge amount of data collected by organizations, correct data and that help in the processing of data mining tools. Variety covers the many different types of data collected and stored. The velocity details the increasing speed at which new data is created, collected and stored, the challenge associated with the rapidly increasing rate of data generation. And veracity recognizes that not all data is equally accurate, the data can be confusing, incomplete, improperly collected and even biased. The challenge is to balance the quantity of data with its quality.
Some have defined big data in terms of the three Vs (volume, variety, and velocity); others have added even more Vs (veracity, value—perhaps venality). Big data refers to data that is too big to fit on a single server, too unstructured to fit into a row-and-column database, or too continuously flowing to fit into a static data warehouse. The point is not to be dazzled only by the volume of data, but rather to analyze it to convert it into insights, innovations, and business value. (Davenport, 2014) The term Big Data always goes hand in hand with data analysis. The concept as it was introduced here makes a big picture of the current panorama, in relation to the difficulties of doing, for example, data mining projects. The essence of the analysis and the objective therefore remain the same, the differences are in the operationalization. The ideal would be to use the same methodologies, techniques for small amounts of data as the big ones, however as evidenced by the different 'v' this is not possible. The evolution of Big Data tools is a reflection of these intentions, both to make operationalization simpler, as well as to integrate analyzes and not need other tools for this.
2.2.2. Technologies
There are several technologies and products related to Big Data and it is usually necessary to use several of them to compose a solution. The choice of technology set is influenced by technical factors such as data types, source formats and sources of information, objective to be achieved and type of application, as well as non-technical factors, such as cost, support, ease of use, availability of specialized labor, learning curve and product maturity level.
A big data platform is typically the collection of functions that comprise high-performance processing of big data. The platform includes capabilities to integrate, manage, and apply sophisticated
computational processing to the data. Typically, big data platforms include a Hadoop (or similar open-source project) foundation as a big data's execution engine. Hadoop uses a processing
framework called Map Reduce not only to distribute data across the disks but also to apply complex computational instructions to that data. In keeping with the high-performance capabilities of the platform. Map Reduce instructions are processed in parallel across various nodes on the big data platform, and then quickly assembled to provide a new data structure or answer set. (Davenport, 2014)
13 Big Data platforms, in addition to differentiating themselves by main objectives, on major fronts such as analysis or operationalization, can also be different in relation to the types of data used. As the applications are diverse and Big Data mentions the variety of data, there are tools that can be more specific for data captured from social networks, internal corporate data or data from IoT devices. In a super dynamic market with many opportunities and different players, many types of software have been created and are still being developed.
2.2.3. Challenges
There are technical and management challenges in the Big Data universe. Mainly due to the different types and the data that is being generated more and more, but also the needs to develop
technologies and processes to extract knowledge.
One of the biggest challenges about Big Data, which has reformulated new models and business strategies is does not refer only to the volume of data, but rather to analyze it to convert this volume into insights, innovations, and business value.
The challenges are not restricted to technical difficulties related to the fundamentals that conceptualize Big Data. And due to the dynamism and the constant updating of tools,
methodologies, an organization must always be attentive to constant innovations. This adaptability also requires companies to plan to have professionals in their workforce who are up-to-date and able to work together, just as there must be a division of labor, a procedural organization, and efficient project management. Therefore, Big Data indirectly impacts the entire business structure of a company, both for consultancies and for retail companies, for most industries. If there is an interest in a continuous search for information through data science, this ever-changing complexity requires better internal structuring. Big Data platforms, in addition to differentiating themselves by main objectives, on major fronts such as analysis or operationalization, can also be different in relation to the types of data used. As the applications are diverse and Big Data mentions the variety of data, there are tools that can be more specific for data captured from social networks, internal corporate data or data from IoT devices. In a super dynamic market with many opportunities and different players, many types of software have been created and are still being developed, which often makes it impossible for large companies to create processes and reinvent themselves internally. And it opens opportunities for startups and complementary services that offer platforms, consultancies that aim at this adaptation and consequently to enjoy the benefits of Big Data.
14
3. TOOLS AND TECHNOLOGY
3.1. SIMM
Neoway's Multi-Market Intelligence System (SIMM) is a big data intelligence platform that integrates through intelligent algorithms a big amount of data, revealing through a unique solution, the links and information that were previously incomprehensible or hidden, aligned with the customers' needs and strategies. SIMM provide information such as best partners, risks and competitors, ideal customers, business opportunities, logistics planning and even fraud and loss prevention. The platform allows the examination of groups by economic activity, turnover, up-to-date information about your market, corporate structure, region, or any variable relevant to a company's strategic vision. SIMM is the main product of Neoway and has different features, the main ones are described below.
Figure 7. SIMM overview. Source: Neoway
Search is the common feature for all the SIMM clients. It is a search bar that enables countless filter combinations for multiple purposes. It’s a marketing intelligence feature, allowing for example to define with a lot of focus and depth new targets for a new product.
15 Maps is another feature that complements Search in the marketing strategies, serving as an
important decision-making mechanism. It gives the user a more analytical and visual uses of data. It is the geolocation feature where to expand the market, attract new customers, create new points of sale, plot infrastructure network, assign new parameters, layers, socioeconomic and demographic information for better sales planning. Data display can be of various types: geographic map, street map, satellite view, terrain elevation or traffic. And it also allows you to load KML files, draw strokes, points, lines, and polygons, insert text associated with drawings, count entities in a polygon, and display information for a specific entity.
Figure 9. Maps on SIMM. Source: Neoway
Pathfinder is the analysis feature for risk and fraud, the loss prevention vertical in addition to the marketing intelligence with Search and Maps. It was designed to allows analysis of network relationships between people and companies in different levels, for then to find links that can be translate into risks and also to identify links with entities registered in a blacklist or in another any list provided.
16
3.2. PYTHON
Python is a high-level programming language, often classified as object-oriented, a form of
programming that seeks control and stability of large projects. However, in the Python language it is also possible to program more simply, where lines of code are executed sequentially, and you can call functions and use various structures until your code reaches the desired goal.
The place where a program is written is called Integrated Development and Learning Environment (IDLE) which has a number of features to help you develop your Python programs including powerful syntax highlighting. PyCharm and Spyder are popular among them and were used during my
experience at Neoway.
Python Programming Language has numerous applications and is used by many successful
companies and established institutions in the industry. It has high modularity, meaning that libraries have been made that have specific functions and add the most different features and tools. Among the popular libraries there are some that most used in my projects: NumPy, Pandas, Scikit-learn, Matplotlib, Seaborn.
v NumPy is primarily used to perform calculations on multidimensional arrays. Provides a large set of library functions and operations that help programmers easily perform numerical calculations.
v Pandas is the widely used library for data transfer, manipulation, reading and data
visualization. It contains high-level data structures and tools to make data analysis faster and easier.
v Scikit-learn is a machine learning library. Providing functions for every step of the process, from preprocessing to model evaluation. It features various classification, regression and clustering algorithms and has a simple and more complete use.
v Matplotlib is library which produces publication figures in a variety of formats and environments. You can generate plots, histograms, bar charts, scatterplots. Seaborn is a graphic library built on top of Matplotlib to develop the attractiveness of graphics for design purposes.
In addition, new libraries are under development that enrich their usability. So, it is possible to develop projects with the most varied themes and levels of complexity. The language has a lot of potential in the market thanks to its responsiveness, thousands of modules, coupled with the ease of programming.
3.3. DATABRICKS
Databricks is an analysis platform based on Apache Spark, a Big Data tool that aims to process large datasets in a parallel and distributed manner. It extends the programming model popularized by Hadoop, making it easy to develop big data processing applications.
17 Overall, Apache Spark is built on top of the MapReduce framework. Then, whenever a task is started, the scheduler distributes parts of the data to the cluster computers, which individually process their parts. The following step consists of gathering all the processed data and presenting the final result of each task.
Databricks enables interactive workspace and simplified workflows for all professionals involved in a big data project, from the data engineer to the business analyst. Databricks has support for Python, Scala, R and SQL, as well as libraries and deep learning frameworks such as TensorFlow, Pytorch and Scikit-learn and integration with cloud providers including Amazon AWS and Microsoft Azure. Databricks is a platform that seeks for speed, security and integration. You can run large amounts of data and manage it more efficiently; the platform invests in an easy and user-friendly interface. It is not a free tool. Although there is a trial version, the use of clusters is paid and according to the amount processed. Despite the available libraries and integrations Databricks does not have the same variety of algorithms and applications as programs developed on open source alternatives. It is a really powerful tool with its disadvantages and advantages to complement the Big Data Analytics work.
3.4. D
ATAG
RIPDataGrip is a database Integrated Development and Learning Environment (IDLE) designed to work for the specific needs of SQL developers and database administrators developed by JetBrains. It is a multi-engine database environment, that supports MySQL, PostgreSQL, Microsoft SQL Server for example. It is a paid software and includes an editor that provides coding assistance for editing SQL code, analysis and navigation and it also features a query console for running and profiling queries. Some of these features:
v Insert, delete, access, view, select, sort, join or merge records; v Copy and delete files;
v Change field structures;
v Insert, remove and establish relationships between tables; v Import or export data between other databases;
v Create primary and foreign keys;
v Conduct queries, prepare forms and reports in the database; v Create users with different access permissions.
To work with different relational databases safely, quickly and efficiently, we have DataGrip as our database management software.
18
4. PROJECTS
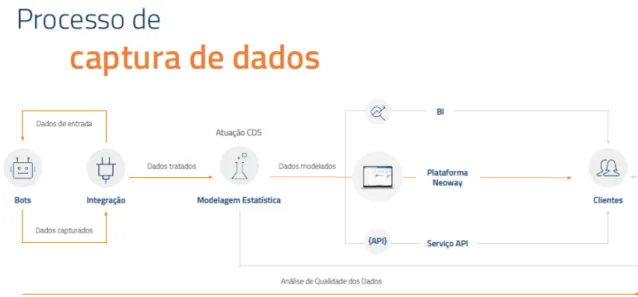
During my experience as a Data Scientist for Neoway I worked essentially on two major fronts. The first front was relative to transforming and enhancing the platform SIMM, the company's main product, and the second one to meeting customer needs and delivering customized data for marketing intelligence and risk and compliance purposes.1
Figure 11. Neoway's data process. Source: Neoway
Neoway's platform is on the way but is not fully scalable yet. Today the platform's most important asset is the data it contains, and for the product to be more viable, it would be interesting to look for data sources for each country that tends to be analyzed if there is interest in internationalization. Therefore, in addition to adjusting the different features of the platform for futures clients in Portugal, the most important activity in this aspect was initially to get as many data sources as possible to make the product more attractive.
To develop a more desirable platform in Portugal during the initial phase of the company we had the help of a team from Neoway Brazil and Neoway in United States. A team of professionals from different fields, using different approaches helped our team in Portugal to map data sources that might be interesting to be captured and transformed. When a new customer is interested in a new data source, the data is analyzed and added according to the needs and to the opportunities to expand it commercially.
1 Due to the confidentiality of Neoway and clients rules it was decided not to publish the results and
more detailed information in this report. Nevertheless, any request can be evaluated under specific terms and conditions.
19 My second work stage was dedicated to the customer demands. This was the moment I most applied Machine Learning knowledge to create new relevant variables for our clients. The work was to understand how companies could benefit from matching external data with their internal data, looking for potential new consumers for example. A project output that goes beyond the
functionality and use of the platform, to be integrated into our customers' daily main uses of the software.
This customization work was institutionalized by Neoway and is already a common practice in Brazil and in the United States.
I’ve noticed during my whole experience there is still an unknown explored potential of work to be done with artificial intelligence. Therefore, in addition to the technical work and advanced
knowledge of algorithms and tools, there is a big essential work of awareness and education for any project customization. It is important to act as a business-data science translator, and to understand the peculiarities of both sides to develop achievable goals and align with company strategies. As well to complement with user experience knowledge to reduce rework and deliver a functional project. During my experience at Neoway, there were three outstanding macro projects, the ones I
highlighted in this report. The first refers to the collection and integration of key data from the SIMM platform, the second refers to the main custom project developed for one of our clients that involved the creation of outputs through statistical modeling and machine learning. And the last was a project that emerged to add more value to the platform, which involved a basic knowledge of natural language processing and text mining in order to bring information from the governmental project of Portugal, called PT2020 to our customers.
4.1. D
ATA CAPTURE AND INTEGRATIONAs previously introduced, the service offered by Neoway briefly consists of a platform that allows the public data of a particular country to be easily and visually accessed in an integrated manner, with specific customizations carried out by the Data Scientist.
Neoway's arrival in Portugal coincided with the reformulation of data policy in Europe, due to the implementation of the General Data Protection Regulation (GDPR). The GDPR is a set of rules created to give European Union citizens more control over their personal data. The objective was to simplify the regulatory environment of companies in relation to this universe, so that citizens and companies can have more control and understand more about their responsibilities and rights in that context. Due to the fact that in Brazil a similar regulation will be implemented in the near future, the Lei Geral de Proteção de Dados Pessoais (LGPD or LGPDP) that regulates the activities of processing personal data, Neoway was already prepared. And even before the company's operations had started in Portugal, a law firm was hired to provide legal support and guide for any possible doubts and changes in the business model.
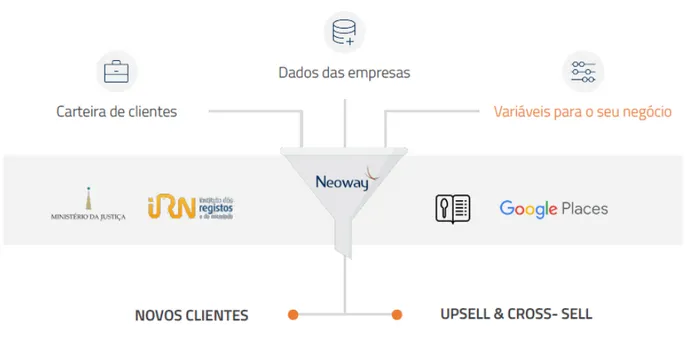
The "cardápio de dados" as we commonly called it in Neoway refers to the main sources and respective extracted data. And was designed initially with the following sources:
20 • SICAE (http://www.sicae.pt/)
• Ministério da Justiça (http://publicacoes.mj.pt/)
• Autoridade Tributária (https://static.portaldasfinancas.gov.pt/) • Segurança Social (https://static.portaldasfinancas.gov.pt/) • Google Places (https://www.google.com/business/)
4.1.1. Business understanding
Data capture is one of Neoway's greatest differentials compared to the platform's competitors. The whole process was designed and redesigned for a long time and the stages are always reformulated due to the lessons learned, the new technologies available and the new interests of the company. A department in Brazil is responsible for all new sources to be captured, acting to meet the updates of the sources and the demands of the customers.
In Portugal, part of this team contributed to structure the database together with the knowledge obtained in practice and experience as a user. All the details of the user experience were carried out for later web scraping work. Therefore, the development of the algorithms was not the part I most spent time, the understanding of the sites, the possible answers and the possible errors were made in long weeks. As well as data quality control and insertion in the platform, they were also
coordinated jointly with the team in Brazil.
21 The idea of the platform obviously is to bring this data in an easy and practical way. Anyone who works with data knows that this seems simple but in fact it is not as it seems. For different and innumerable reasons. Integration is a delicate process, as is the construction of the data structure for maintenance and possible future changes. The integration takes place through the field of a tax identification number, abbreviated as NIF, it is a sequential number intended exclusively for the treatment of tax and customs information. It consists of 9 digits, the first of which has different meanings:
• NIF starting with 1 or 2 (natural person or sole trader) • NIF starting with 5 (legal person)
• NIF starting with 6 (public legal person)
• NIF starting with 9 (irregular legal person or provisional number)
NIF numbers were captured, transformed and included in the system, except the NIF numbers with the initials 1 and 2, because of GDPR resolutions.
All the other data was added and integrate to the NIF number field, as a primary key. It is important to note that the customer could add any other database on the platform. And this could be done in two ways, one with the help of Data Science and the technology team in Brazil, and the second way through a feature of the platform called Connector, which transferred the data to the customer's cloud and made the integration with the data already there available.
This integration of internal data with external data is extremely essential for the success of projects developed by customer Data Scientists, it is from these internal data that it is possible to obtain for example the target variables.
4.1.2. Data sources – Marketing Intelligence
The perfect use of customers by the SIMM platform could be on two business fronts. The main one, for Marketing Intelligence issues and the second one for Risk and Compliance.
By Market Intelligence, we can consider the processes related to the capture, treatment and analysis of data and, subsequently, knowledge about a given market. It can be used to assess market entry opportunities and formulate market development plans and performance strategies. More specifically for:
• Reach new customers and prospects • Increase sales (upsell and cross selling) • Improve services and products
• Develop new products/processes
22 Marketing intelligence uses several sources of information to create a more complete picture of the market, customers, problems, competition and the company's existing growth potential for new products and services. The data sources for this analysis include registration, sales records, surveys and social media, among many others.
There are several tools within the scope of marketing intelligence to assist companies of different sizes, areas and proposals. And these tools work on data analysis, management, planning, control, coordination, social networks, among others.
SIMM is a platform that in this context helps by providing information for all the objectives
highlighted above and has already helped several companies with different interests. It was built to assist in prospecting, segmentation, strategic planning and other fronts directly linked to marketing intelligence, which does not and does not prevent other companies from using the platform for other purposes, such as building routes, defining the area performance, market penetration analysis. For the first months of operation, we defined the main data from our sources already mapped and captured that would be extracted and transformed to be inserted in the platform. The most important thing at that time was to bring as much data as possible to the universe of Portugal. The idea for the customer is to give the possibility to understand the market, its share, potential customers, their respective categories, areas of operation, their location and contact. Subsequently integrate them with the financial data related to your accounting statements and be able to further segment the research niche according to your specific interests.
For this initial work, the areas and the variables captured, transformed and integrated were:
Table 1. Marketing intelligence data captured
FIELD
VARIABLES (exemples)
CADASTRO
NIF Situação
Nome da Entidade
Data de Início da Actividade Capital Social CAE Código CAE Principal CAE Secundário LOCALIZAÇÃO Morada Freguesia Distrito Concelho CONTACTO Telefone Site SÓCIOS Nome NIF Qualificação
23 Gasto com o Pessoal
Pessoas ao Serviço da Empresa Remuneradas e Não Remuneradas
Fornecimentos e Serviços Externos Resultado Líquido do Período
The variables described in the table refer to the data collected by the sources mentioned above. For better organization and usability, these variables were named and made available on the platform. They were also classified in different areas due to different sources, but also in order to help customers' searches.
As mentioned, variables are used as filters for searches. Being liable to any possible combination. The answers are presented both individually and collectively for macro analysis. This flexibility makes it possible to transform this data into information to support decisions in different areas, mainly related to clients marketing strategies.
4.1.3. Data sources – AT e SS
For Neoway's other vertical of risk and compliance, new variables were added. Another feature of the SIMM platform called Pathfinder can be made available in order to help the client to detect possible risks and fraud.
This feature was built not long ago due to a specific need of a customer, then it was incorporated into the platform mainly for banks, insurance companies, financial institutions.
The idea is to map public sources with the data of debtors, possible fraudsters and integrate them allowing a better assessment. The feature also allows aggregating complementary data and making a network view, allowing to identify more efficiently not only the specific subject, but a possible group of fraudsters, the different possibilities of fraud and their tracks.
Like the other SIMM features, pathfinder allows customization and helps customers to list their own lists and make deeper analyzes of these groups. APIs and other systems have also been developed to make analysis faster and more automated for companies that work with a lot of research and cannot do all of them manually. Thus, pathfinder has become an essential feature for large companies. In Portugal, the data sources mapped and later the deepening of the analyzes determined that the most important data for this risk and compliance work, of an initial nature to do some tests with the SIMM feature would be obtained through the
• Autoridade Tributária e Aduaneira • Segurança Social.
The Autoridade Tributária e Aduaneira (AT) is an agency of the Ministry of Finance of Portugal, whose function is to administer taxes, customs duties and other taxes in Portugal, as well as to exercise
24 control over the external border of the European Union and the national customs territory. It is the availability of the list of debtors to Finance online.
The list of debtors to Finance includes taxpayers who owe debts to the tax administration because they have exceeded the voluntary payment period without fulfilling their obligations and who, for this reason, do not have their tax status regularized. The list is organized according to the type of taxpayer, single taxpayer or collective taxpayer and by debt level.
This list includes the Contribuintes Singulares (individuals) and the Contribuintes Colectivos (entities). Neoway organized itself to make available the list of Contribuintes Colectivos, whose global value of the outstanding debt falls within the following levels:
• From 10 thousand euros to 50 thousand euros; • From 50,001 euros to 100 thousand euros; • From 100,001 euros to 500 thousand euros; • From 500,001 to one million euros;
• From 1,000,001 to five million euros; • More than five million euros.
Segurança Social (SS) is a system that aims to ensure basic citizens’ rights for all Portuguese or foreign citizens who exercise professional activity or reside in the Portuguese territory. It comprises initiative actions by public authorities and society, aimed at ensuring the right to health, pension and social assistance. The system is public and mandatory in nature, so it covers all citizens. No one can abdicate him, whatever his professional or personal situation.
The list of Segurança Social includes debtors who, because the voluntary payment period has ended without having fulfilled their obligations and, within the legal term and terms, have not requested and framed the payment of the debt in installments, provided a guarantee or requested their release, their contributory situation regularized.
And just like AT's debts, they are classified by intervals. These are the Segurança Social levels: • From 10 thousand euros to 50 thousand euros;
• From 50,001 euros to 100 thousand euros; • From 100,001 euros to 250 thousand euros; • From 250,001 euros to 500 thousand euros; • From 500,001 to one million euros;
• From 1,000,001 to five million euros; • More than five million euros.
25 The work involving the capture of AT and SS data was very important for Neoway's Portugal. The web crawler developed for the capture of information was developed almost autonomously, without dependence on the team system or any bureaucratic process in Brazil, which gave us autonomy to the development of the project and consequently demanded a lot of, efforts, work, time and specific knowledge, acquired throughout the project.
Updates to the lists were made and reports were created periodically to analyze taxpayers who switched lanes, left or entered the lists. This post analysis was an example of the complementary work outside the scope of Neoway Customer Data Scientist, that from a seemingly unpretentious work, helped to develop ideas, add more value to projects and gain insights from data that were later extremely valuable.
Figure 13. Neoway in Neoway data funnel in Portugal. Source: Neoway
4.2. S
EGMENTATIONV
ARIABLESIt is important to note that not all information on this project can be made available here in this report. Neoway and the client in which the project was carried out did not agree to provide more details and the result of the project, due to security and privacy issues.
However, it was the most important project during my experience at Neoway. It was where I was able to apply and learn more about what I saw in the master's degree, for several reasons. And undoubtedly during its progress, many difficulties, overcoming and learning have been achieved. It had a little bit of everything, including flexibility to test new methodologies and explore new techniques in the universe of artificial intelligence.
26
4.2.1. Business Understanding
The project with this client was the biggest project of the Portugal office and consisted of making the SIMM platform available with all available features and further customization to create new variables for the marketing department.
We received the following complaint from our client regarding his work before the platform: “The current collection processes are mostly manual, they are not centralized, they are not automated, and they are not refreshed with the desired frequency. The crossing of information, external and internal, with the objective of identifying relationships”
In general terms the objective of the project was: • Capture new data
• Treat and centralize information • Cross and discover new relationships • Keep data up to date
• Test platform and propose use cases
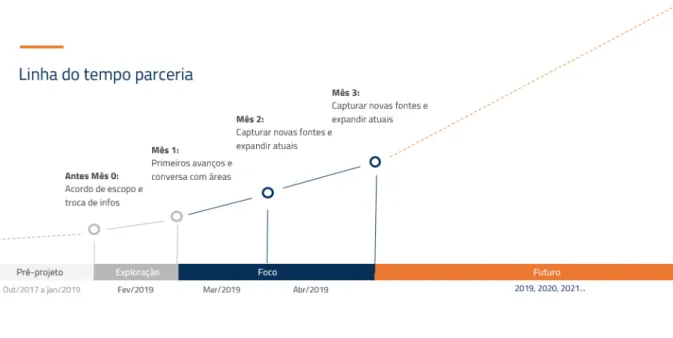
The project started as a POC, a proof of concept during the first 3 months. Beginning in February until May 2019. And contemplated different departments of the company, in the technology area, in the data analysis part and mainly in the sales and marketing area.
27 During the first days we tried to get to know the reality of the company, the processes, the people, the difficulties. Make an assessment of what could be done in favor of the activities performed. Later, work for the different areas had started. In this report I will focus more on the work with the data and marketing department.
At the beginning of the project, we list key performance indicators (KPI) to monitor and measure the quality of the results delivered. And the idea was to make a final presentation with what was planned and accomplished. A group of 10 people in Brazil contributed to the development of the project in other areas, including a Project Manager. We had a weekly meeting to coordinate activities, with weeks when meetings needed to be daily
I was in charge of all the technological part of the project. Responsible for the platform and for all data related deliveries to the customer in Portugal. This required a lot of contact with the client, a lot of skill in understanding the needs, what could be accomplished and how. It was a huge challenge to have to answer and take responsibility for a project of this dimension.
The CAE (Classificação Portuguesa das Atividades Económicas) is a compilation of the companies’ areas of activity. For the realization of the POC, we decided together with the client to choose data from specific CAEs companies in Portugal. Many companies have more than one registered CAE, and we use the first one, theoretically the most important and relevant for the company. The idea was to have a better focus and to be able to more accurately analyze the results obtained during the
project. And also have greater control over the implementation of the changes proposed.
Therefore, for the project we analyzed more accurately 8652 companies with an active situation in Portugal, through 337 variables, obtained from different sources extracted and made available on the SIMM platform. These 8652 falls under the CAE of Cafés, Hair Salons or Beauty Institutes.
28 The customization project that involved artificial intelligence developed for the specific client was created essentially in the python environment. The construction of the models and the predecessor stages, as well as the statistical analysis and other creation of algorithms were carried out with codes developed in this language with the help of libraries mentioned in the tools section.
4.2.2. Preprocessing
There are countless techniques and technologies for working with data and because of that there are different formats necessary to perform a better work with databases. Preprocessing is a set of activities that involve data preparation, organization and structuring. It is a fundamental step that precedes the performance of analyzes and predictions.
The sensitivity of a model to its predictors was closely linked to the type of technique and tool that is used and the way that they are used. The amount of preprocessing was determined by the type of final model that will be worked on.
The preprocessing steps did not necessarily follow a fixed order, obviously understanding the data and variables was the first and most important step. But it was often important to test different combinations in order to understand the database, to test and evaluate the results. The most logical and most commonly used order follows this pattern:
• Basic data analysis • Missing values analysis • Analysis of variables • Collinearity analysis
• Analysis of categorical variables • Sales analysis
• Analysis of distributions • Outliers analysis
• Analysis of the importance of variables • Principal component analysis (PCA) • Imbalanced data analysis
• Train, validation and test databases
The previous analysis of the data consists of understanding the database in a more macro
perspective. How many observations, how many variables and details of the datatypes, distribution, the quantiles, the maximum, the minimum. I would say that understanding the size of the base is the most important at this moment to be aware of the next steps and understand, for example, whether it would be necessary to use other tools and also to consider further changes in the preprocessing phase.