Repositório ISCTE-IUL
Deposited in Repositório ISCTE-IUL: 2018-07-17Deposited version: Post-print
Peer-review status of attached file: Peer-reviewed
Citation for published item:
Ventura, J. V., Paio, A., Beirão, J. N., Nunes, L. & Pezzica, C. (2017). Multidimensional study of urban squares through perimetral analysis: three Portuguese case studies. In Teresa Heitor, Miguel Serra, João Pinelo Silva, Maria Bacharel e Luísa Cannas da Silva (Ed.), 11th International Space Syntax Symposium, SSS 2017. (pp. 85.1-85.20). Lisboa: Instituto Superior Tecnico, Departamento de Engenharia Civil, Arquitetura e Georrecursos.
Further information on publisher's website:
--Publisher's copyright statement:
This is the peer reviewed version of the following article: Ventura, J. V., Paio, A., Beirão, J. N., Nunes, L. & Pezzica, C. (2017). Multidimensional study of urban squares through perimetral analysis: three Portuguese case studies. In Teresa Heitor, Miguel Serra, João Pinelo Silva, Maria Bacharel e Luísa Cannas da Silva (Ed.), 11th International Space Syntax Symposium, SSS 2017. (pp. 85.1-85.20). Lisboa: Instituto Superior Tecnico, Departamento de Engenharia Civil, Arquitetura e Georrecursos.. This article may be used for non-commercial purposes in accordance with the Publisher's Terms and Conditions for self-archiving.
Use policy
Creative Commons CC BY 4.0
The full-text may be used and/or reproduced, and given to third parties in any format or medium, without prior permission or charge, for personal research or study, educational, or not-for-profit purposes provided that:
• a full bibliographic reference is made to the original source • a link is made to the metadata record in the Repository • the full-text is not changed in any way
The full-text must not be sold in any format or medium without the formal permission of the copyright holders.
Serviços de Informação e Documentação, Instituto Universitário de Lisboa (ISCTE-IUL) Av. das Forças Armadas, Edifício II, 1649-026 Lisboa Portugal
Phone: +(351) 217 903 024 | e-mail: administrador.repositorio@iscte-iul.pt https://repositorio.iscte-iul.pt
Title 1
94
MULTIDIMENSIONAL STUDY OF URBAN SQUARES THROUGH
PERIMETRAL ANALYSIS:
Three Portuguese case studies
__________________________________________________________
ABSTRACT
This paper addresses one of the most symbolically and socially meaningful elements of the public open space: the urban square (Portuguese: praça). Besides their urban centrality, these spaces’ potential for liveliness depends on multiple factors and their identity as a place may only be grasped by formal methods that embrace that latent complexity and address the multi‐scale and multivariate correlations of factors that defy human cognitive capabilities. This paper will present a synchronic multidimensional analysis of three Portuguese historic squares: Praça da Oliveira, Praça de Santiago (Guimarães) and Praça do Giraldo (Évora), representative of the national historic heritage.
KEYWORDS
Public Open Space, Urban Squares Morphology, Public‐Private Interface, Syntactic Analysis, Multidimensional Analysis
1. INTRODUCTION
The word square by which we translate the Latin – platea – derived terms (piazza, plaza, praça, piață) is used to identify an urban space of exceptional character in the morphology of the public open space. Although usually designating a designed formal space, in this context we use the term in a broader sense including informal formations that share a set of particular morphologic and cultural semantic‐symbolic values rooted in history that make them more than mere urban voids, pedestrian paths or focal points. In Portuguese this covers toponymies like largo, terreiro or rossio.
The liveliness and the success of interventions in these spaces is defined not only by its centrality but by local features like the permeability of its defining planes, on notions of comfort, security, use and appropriation affordances of a micro urban morphology
Title 2 (Habraken&Teicher, 1998). To address this complexity, we present a methodology that collecting contributions from the disciplines of urban morphology and site analysis, resorts to multivariate statistical analysis and inductive patterns search techniques in large datasets by data mining. The notion of interface as the potential of a boundary to work as a threshold is at the very basis of the configurational and morphological analysis, as well of the design of the built environment itself (Hillier&Hanson, 1984). Discretizing the boundary space of the squares we delve in its potential as interface between architecture and public open space observing as an a priori set of heterogeneous attributes manifest themselves along its perimeter. The selection of attributes takes an agnostic attitude melding analytical themes (morphologic, environmental, syntactic and functional), scales (global and local) and standpoints (cognitive‐unbounded and perceptive‐bounded). This strictly data driven approach is methodologically important in the sense that the inductive data mining methodology proposed is eminently theory agnostic, local (conclusions belong to the data set analysed), and resorts to case‐based reasoning (Ahu et al, 2011).
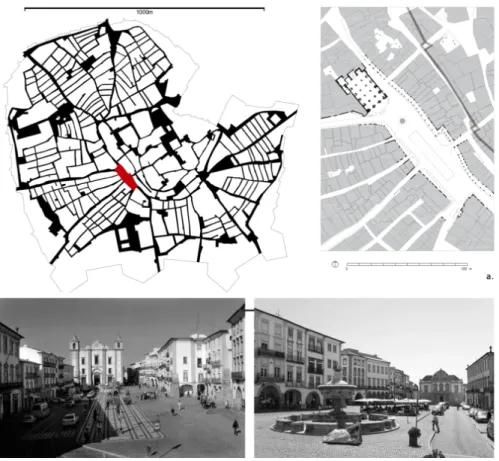
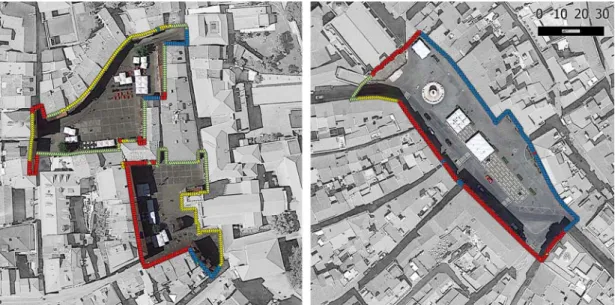
The two cities where the case studies are located (Guimarães and Évora) are paradigmatic examples of the north‐south and coast‐interior dichotomies of the Portuguese territory, entrenched between Atlantic and Mediterranean cultures (Ribeiro, 2011). At the present time tourism and the location of university centres are crucial factors for development of these two medium‐sized cities, compelled by UNESCO classification of their historical centres. The three case studies are squares of essentially informal genesis, located in the cities’ consolidated historical fabric within well preserved medieval walls. Nowadays they are carefully preserved symbolic and leisure spaces, in mainly pedestrianized neighbours where car circulation is not disruptive of their tourist and civic event activity. Besides a considerable difference in area between Praça do Giraldo (Évora) and the examples from Guimarães (Largo da Oliveira and Praça de São Tiago), their historic function was distinct. The Praça do Giraldo (fig.1) is an example of an ancient rossio a multifunctional space contiguous to the external side of a city gate (in this case in the disappeared roman city wall), and considered a hallmark of the Portuguese medieval urbanism. These spaces were focal points of irradiation for subsequent urban expansions (Coelho, 2008).
Title 3
Fig. 1: From the top to down : Évora city center, Praça do Giraldo planimetry and photos, Guimarães city center. Praça de Santiago (b.) and Largo da Oliveira (c.) planimetry and photos. a. and d. in Silva (2009).
Title 4
The Largo da Oliveira as a more formal and symbolic character functioning as the forecourt of the church that dominates and gives its name to the place, and Praça de São Tiago is a classic medieval market square (previously named Praça do Peixe ‐ Fishmarket Square) surrounded mainly by typical habitational houses. These form an interesting system as they are connected through the archway of the open floorplan of the elevated medieval building of the city hall. Here administrative power is literally between the religious and the economic one. In the present investigation they are studied as separated spaces, where each one is part of the context of the other (fig. 1).
2. OBJECTIVES
The main objectives of the present investigation are: (i) to describe and classify the squares’ perimetral space through a non‐supervised method that naturally groups sampling points around their perimeter taking in account a set of heterogeneous attributes simultaneously; (ii) to determine the attributes that better explain functional distribution and morphological diversity along the square perimeter; (iii) to assess how these correlations of factors vary from case study to case study; and finally (iv) to observe how they relate with site surveys and empirical knowledge on those spaces, from the perspective of urban morphology and human behaviour (Gehl, 2011).
3. BACKGROUND AND MOTIVATION
Meanwhile theory integration between space syntax and urban morphology is mainly carried out at the urban macro scale, like in Place Syntax (Stahle et al, 2005), most of its successful and well known practical applications lay at the intermediate scale, between architecture and the city (e.g. Trafalgar square). This follows the schism between planning and design and hinders the development of relations with typo‐morphologic and architectonic stands on the micro morphologic analysis of the city form that could promote a more sustainable evidence‐based urban design.
As pointed out by Palaiologou et al (2016) the primacy of movement in space syntax theory as the main space usage, rooted in the axial analysis and concepts like natural
movement (Hillier et al, 1993) or movement economy (Hillier, 1996), came at the price of privileging the generic city “over the complex and culturally specific street‐building interface; the lived space in which individual action becomes social practice. Problematizing this idea of street‐building interface and claiming for a recalibration of scales the authors make a stand on the role of constitutedness to shape its own field of encounters, at the
Title 5
threshold of architecture and urban scales, and make a specific contribution to the virtual community concept (Hillier, 1996).
The syntactic exploration of the relations between street interface and liveliness has been carried out by authors like van Nees (2007) and Beirão&Koltsova (2015), driven by space syntax seminal ideas like the formalization of the interface relation between private and public realms and the morphogenetic model of the aggregation that gives rise to the beady
ring structure, or the constitutedness of space and the interface map (Hillier&Hanson,
1984). At this micro analysis scale the linking between syntax, morphology, typology and architecture becomes natural and the (tridimensional) form and specific aspects gain prominence over the generic and location ones. Totalizing generalization gives way to explanatory power on culturally ingrained practices.
The relational or configurational nature of urban space syntax, as the study of the field of possibilities over a discretized system, has the partitioning of the continuum of the public open space at the heart of its theory foundations. Lacking the formal clarity of the axis, the convex space or the isovist (Benedikt, 1979), the translation of urban morphology fundamental elements, like “square”, to a formal language is an ill‐defined problem, even if stripped of all its semantic values. Although perceptive and cognitive explorations my cast some light on this threshold problem (Turner, 2003; Thiel, 1961; Lynch, 1960). At this micro level, the type of interface between public open space and private space becomes important, culturally specific and culturally determinant of the public space use. One could say that the regularity and the character of the interface porosity culturally shape the dynamics of the public space.
Accepting the square as an urban element per se authors like Campos (1997) and Campos and Golka (2005) investigate the relationship between patterns of use, network configuration and visibility by studying the penetration of axial lines and the effect of visual fields on the space of London squares. Cutini (2003) studies Tuscan historic squares (piazzas), focusing on the relationship between centrality, potential of enclosure, and extension, proposing a new compound visual graph analysis (VGA) index that depicts the hierarchy and performance potential of convex spaces to work as a square.
The classic methods of urban morphologic and syntactic analysis, usually limited to the analysis of single or pairs of variables, so as to respond to human cognitive and perceptive limitations, restrict the simultaneous expression of features that give spaces their
Title 6
uniqueness and characterize them as places. Serra, Gil and Pinho (2013) compile the shortcomings of traditional typomorphological approaches, namely their time‐consuming methods restraining the amount of examples and dimensions considered, and theoretical partiality. Some recent formal approaches try to escape these limitations by relating attributes and classifying examples through clustering in multivariate tri or quadrangular graphs (Berghauser & Haupt, 2010).
The identified deficiencies can be handled by the use of new computational methods that allow for multidimensional analysis and typological classifications based on data mining. This interdisciplinary subfield of computer science can be understood as the practical application of machine learning, itself a subfield of Artificial Intelligence (AI) dealing with automatic learning from data (Witten&Frank, 2005). Data mining, also known as knowledge discovery in databases (KDD) (Han&Kamber, 2001) main objectives are knowledge extraction, prediction and hypothesis generation from data, favouring an inductive (bottom‐up) approach. This approach is in opposition with confirmatory techniques that require a priori hypotheses formulation that restrict hidden information discovery (Miller&Han, 2001). The automatic learning may be divided in three methods: (i) unsupervised, when there is no a priori labelled data (e.g. used in segmentation, clustering and dimensionality reduction); (ii) supervised, when there is a priori labelled data (e.g. used in predictive models like regression, classification and rule induction); and semi‐ supervised, when data is partially labelled. Nowadays these techniques are relatively easier to implement by computational methods and are widely applied to many fields of science, engineering and business. When spatial data his involved, like in geographic information systems and geoscience, it is designated by spatial data mining (Demsar, 2006).
Within urban morphological studies, they support analyses at different scales: from Laskari et al. (2008) study on urban identity through quantifiable attributes on blocks’ shape at district level, to street patterns in metropolitan areas. Gil et al. (2012) in an unsupervised classification of the urban fabric of two neighbourhoods of Lisbon, focusing on street and block elements, mention the possible integration of these techniques in design. Ahu et al (2011) explores the potential of supervised learning as a methodology of knowledge discovery in micro urban feature analysis on the historical fabric of a neighbourhood in Istanbul. Chazar and Beirão (2013) point the potential of extending the methodology to deal with non‐formal spatial qualities, leading to a better understanding of the public open space morphology.
Title 7
Although multidimensional morphologic analysis of the urban void are rarer, Laskari (2014) analyses the blocks’ residual void space in a neighbourhood of Athens, through a set of 13 properties and by different clustering methods. The work of Hanna (2009) on the principal component analysis of graph spectra and self‐organizing maps (SOM), and of Al‐Sayed (2013) with artificial neural networks (ANN), analysing both design process and the configuration of urban grids, are examples of the application of related techniques in the field of syntactic analysis.
4. DATASETS AND METHODS
Resorting to previous investigation on a general methodology for the multiscale and multivariate analysis and classification of public open space (Lopes et al, 2015), the first step was to choose a subset of the proposed indicators that seemed significant in the scope of the present analysis. The attributes were divided in nine main themes: Geolocation, Connectivity, Isovists, Visual graph analysis, Façade attributes,
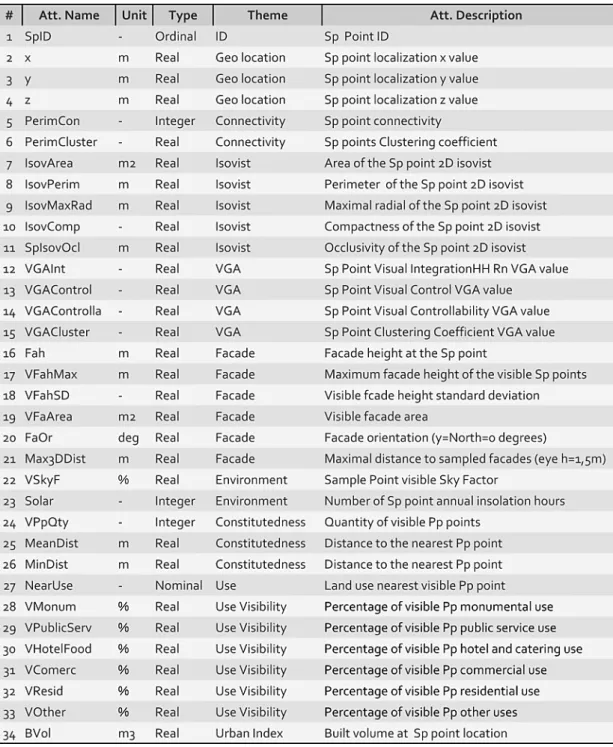
Environmental features, Constitutedness, Use, and Urban indexes. They comprise 34
attributes representative of morphological (space shape/built form), syntactic and visibility (connectivity/VGA/isovists), environmental (topography/solar exposure) and functional (permeability/uses) traits (Tab. 1). Attributes can be global or local and the expression of a property at a sampling location or aggregations of values as presented to visibility at that point.
Title 8
Tab. 1 : Attribute list metadata and description
Consequently besides isovists we have taken another approach on visibility (akin to the VGA method) as a discrete connectivity graph of the sampling points. Recording the data structure of that graph we can more easily query on connected sampling points’ attributes and aggregate them in a meaningful way that may represent the way they present themselves to visibility. Another practical advantage is that some attributes may be extrapolated and not analytically or geometrically calculated.
Title 9
The method implies the definition over the square’s models of (i) a square working perimeter and (ii) two sets of points:
(i) The square working perimeter
As a generic rule the perimeter of the square is the minimal polygon (not necessarily convex) enclosed by its built frontage edges and defined by the horizontal and vertical projections of their main façades. As this is an ambiguous description, some assumptions are made clear: existing public ground floor galleries are considered but do not define the perimeter; accessible fenced public spaces that are adjacent to the square are considered part of the square; built façades that partially face the square are considered as a whole unit belonging to the square. The proposed perimeters are working perimeters and other definitions may be used, but an effort was made to keep consistency across the case studies.
(ii) Two sets of points
a) Physical permeability points (Pp)
Points located at the centre of ground floor openings (the interface between public and private) in and around the square (with a buffer of approximately 50 meters). These points will record the use they serve. Other building openings for lighting, ventilation or views are not considered in this study.
b) Sampling points (Sp)
Points evenly distanced 1,0 m, approximating human scale, numbered and ordered along the squares’ defined perimeter. They work as a neutral referential from which tables are built. The altimetry of these points will depend on the attribute being recorded.
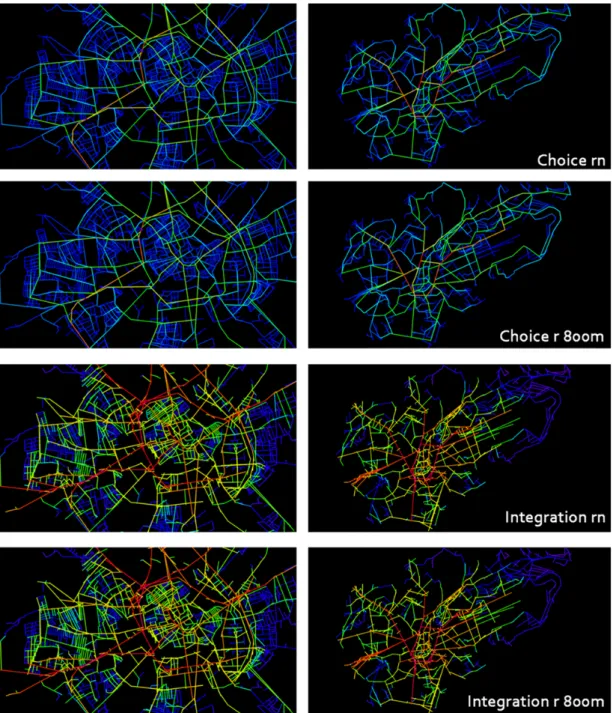
The method implies an initial global configurational analysis of the expanded urban system where the squares are embedded. In the presented case studies, constructed upon Guimarães and Évora municipal georeferenced official cartography, an axial and segment analysis at the urban perimeter scale (Fig.2), and a VGA analysis at their historical centres were conducted (Fig. 3). The importance of the three squares in their urban system can be depicted on the syntactic maps, and made clearer by mapping Cutini’s interaction index k (Cutini, 2003) of the set of squares of those central urban areas (Fig. 3).
Title 10
Title 11
Fig. 3: Évora and Guimarães VGA analysis (1m grid resolution): a. Integration HH, b. Connectivity, c. Clustering Coefficient, d. Control, e. Interaction Index (Cutini, 2003).
Then, the focus is to put on urban micro‐morphology analysis and local properties, as they are expressed and recorded along the perimeter of the square, using the methodology described above, and in the use of data mining techniques for the visualization and
Title 12 exploration of the datasets so produced.
Fig.4: From the top: 3D model of Pr. Giraldo; overlapping isovists (from the left: Pr. Giraldo, L g. Oliveira; Pr. São Tiago); mapping of uses and attributes (Pr. Giraldo).
The first step was to get a sense on the data and validate its quality. Besides data exploratory techniques and descriptive statistics, the mapping of the information is
Title 13 essential for checking out errors and dealing with outliers. This pre‐processing phase includes the normalization of the numeric attributes as identical weight was given to all of them.
Following our objectives the data was modelled by exploring mainly unsupervised learning techniques: (i) dimensionality reduction, by principal components analysis (PCA), and (ii) partitioning clustering.
PCA allows the determination of a smaller set of artificial variables (the components, formed by a linear weighted composition of the original attributes) that summarize the original data with minimized loss of information. There are as many components as attributes, ordered by their contribution to variance. The first few normally attend for the larger amount, allowing working in a lower dimension and clearer representations in 2D plots. Analysing the composition of those components one can filter the most important attributes for further analysis (Witten&Frank, 2005).
Clustering is an unsupervised classification process that assigns objects to groups (clusters), so that the objects of each group are more similar to one another than with the objects of other groups. There are many clustering algorithms; we are using k‐means with the Euclidean distance function (used to express dissimilarity), whose results are easier to interpret. It discovers natural groups of objects or variables, identifies extreme and archetypal examples and suggests interesting hypotheses about relationships (Witten&Frank, 2005). We use a derivative algorithm, X‐Means, that determines the correct number of clusters based on a Bayesian Information Criteria (BIC) partition heuristic, and balancing the trade‐off between precision and model complexity (Pelleg and Moore, 2000).
To assess strong predictors on the location of uses along the square perimeter, we used Predictor Screening (SAS, 2009), a supervised learning method of screening many predictors for their ability to predict an outcome based on random decision trees (bootstrap forest partitioning).
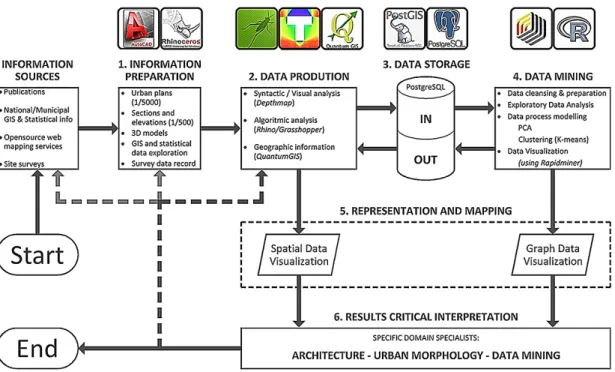
The workflow (Fig. 5) implied the functional surveying and mapping of Pp points in the neighbour of the sites, and the creation of 2D and 3D (topographic and volumetric) CAD models suitable for the scale and analysis at hand. The large scale syntactic analyses were produced in DepthmapX (UCL and Tasos Varoudis), and the morphologic local ones using algorithm design software (Rhino/Grasshopper and its plugins Ladybug/Honeybee for
Title 14 environmental analysis) as a mean of gaining control over the analytical tools (Fig. 4). Data was collected by the different scripts and converted in a multidimensional vector on a table. We used simple spreadsheets as our case studies are few, but the ideal workflow includes the data storage in a central spatial object‐relational database (like PostgreSQL extended with PostGIS). For the mining and plotting of the data we resorted to student versions of Rapidminer (RapidMiner, Inc) and JMP (SAS Institute Inc.) and for visualization and mapping to QGIS and Rhino/Grasshopper. Data visualization is essential for error checking and to the critical interpretation of the results.
Fig. 5: Workflow diagram illustrating the interactive nature of the ideal process.
5. RESULTS
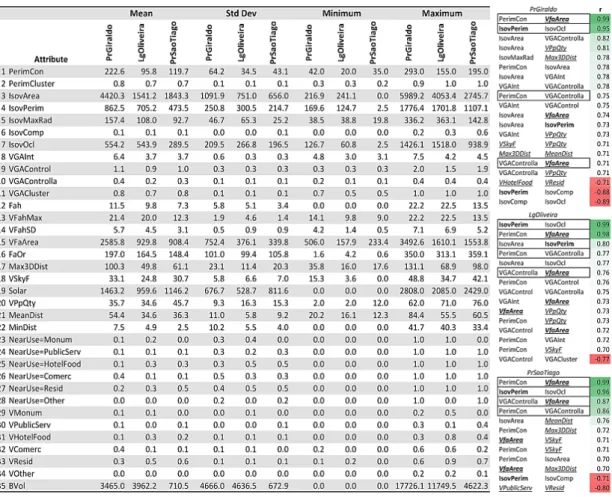
The statistical summary in Tab. 2 shows aggregated values of the raw data. Some blocks of values appear with Praça do Giraldo concentrating the generality of the highest mean values, as it is the larger space and data is unscaled, and Largo da Oliveira the lowest attribute mean values related with isovists area, connectivity and VGA, while Praça de São Tiago the ones related with isovists perimeter and façades. This last case study although with high standard deviation has the highest mean and maximum values of isovist compactness and visible Pp points. These and environmental attributes make these Guimarães case studies diverge. The distinct functional character of the case studies is also depicted in the mean values of attributes related with proximity and visibility to Pp
Title 15 recorded uses: Praça do Giraldo with commerce, Largo da Oliveira with leisure and monumental buildings and Praça de São Tiago with residential use. Maximum and minimum values are related with size of the squares, the detail of the defined perimeter and the type of attribute (NearUse appears as a 0 or 1 binominal attribute).
The correlation analysis (Tab. 2, left) shows two pairs of attributes with value above 0.95 and a selection was made on them (IsovPerim and VFaArea were dropped in the analysis). That table shows the pairs of attributes correlated above 0.7, and these are mainly the known cases of correlations between VGA, isovists and connectivity, and cross relation with non‐syntactic attributes can be depicted. The negative correlation on the location of residential and leisure and public services uses is also highlighted. The data presents some outliers but as they don’t come from measure errors but from idiosyncratic aspect of the sites, the detail of analysis and the selected perimeter they were not discarded.
In parallel with clustering a PCA analysis was conducted, revealing that, in all squares, for an explanation of 95% of the variance of the data about 15 components are necessary , which means a general weak correlation. The first two components explain an average value of 36% of variance and are used in the scatter plot visualization of the clustering results.
Title 16
Tab. 2 : Statistical summary (Pr.Giraldo: N= 352; Lg.Oliveira: N= 249; Pr.São Tiago: N= 280). Left absolute values of correlation (r) over 0,7. In bold: discarded attributes;
underlined italics: attributes not directly related to isovists or VGA; in box: pairs that appear in all squares. The clustering process of the Sp points was made in the non‐positional attributes (x, y, z), normalized using z transformation (or statistical transformation, where the final data has a normal distribution with zero mean and unit variance) and by the X‐Means algorithm. The characterization of the clusters (the most distinctive attributes of their class) is made by the comparison of the mean value of the attributes in each cluster (its prototype or archetype) with the mean of all the examples in the dataset, which with the utilized normalization is by definition zero. So high and low values mean, values significantly above and below the mean values of the all dataset. Fig. 6 shows a table of the set of attributes that include the top five ranking of their normalized absolute value and the plotting of examples in the first two principal components, and Fig. 7 their mapping on site. The numbering of the cluster has no special meaning and they cannot be compared across case studies by their designation.
Title 17 Praça do Giraldo. In this square two clusters (C1 and C2) domain the results and their values concentrate around the global mean. Cluster C1 collects all the highest values of solar exposure, VGA control and minimal distance to Pp points. Façade orientation takes low values (good solar south‐west exposition), with contrary signal to cluster C2, which concentrates all the highest values of perimetral connectivity, isovist occlusivity and VGA clustering coefficient, meaning higher degree of convexity and jaggy visual fields simultaneously (Sp points face the northern gallery). Clusters C3 and C4 gather the extreme examples with values way off below the median regarding connectivity, isovists and VGA, especially isovist area, global VGA integration and controllability as their Sp points are located in a segregated area of transition between street and square, with the highest values of visibility to residential use. Moreover C3 differs from C4 by the inverse relation in the attributes dominated by the nearby church: VMonum and VFahSD, which records the skyline variability.
Largo da Oliveira. In this case study the attributes related with isovists, VGA, proximity to commerce and visibility to monumental buildings separate clusters C1 and C2 from C3 and C4. Extreme high values of the last two features, as well of visual axis, isovist area and occlusivity, with low value of visible Pp points and related perimetral connectivity dominate cluster C1. The latter are attributes that disentangle C2 from the other clusters, which collect all the high values in the syntactic measures, corresponding to the more central stable space. Clusters C3 and C4 locate mainly in the East side of the square, due more to morphologic and functional aspects than from the value of façade orientation (like in Évora). The proximity to public services and the built volume of the surroundings, the old convent and church, dominate C3 and distinguish it from C4, what is reinforced by the opposite values of visibility to restaurants and cafés doorways, located across the square, and the skyline silhouette.
Praça de São Tiago. This square is dominated by two clusters (C3 and C4) that are the closest to the global mean of this square. C3 collects all the high values of isovists and VGA except the ones related with clustering coefficient (perimetral and extended VGA), due to the concave shape of its urban frontage, as well as solar exposure, along with positive values of visibility to public and touristic services, distinctive traits to C4. The latter collects all the high values of visibility to high façades, with low values of VGA integration.
Title 18
Fig.6: Clustering on each square’s Sp points and on the prototypes of all the squares (bottom right). In parentheses the number of examples.
Title 19 Fig. 7: Mapping of the clusters on site (representations are local to each square and fallow Fig. 6 legends). Performing another X‐means clustering on the cluster prototypes of all the squares three clusters are highlighted (Fig. 6, bottom left). One of the clusters is an outlier with only one example: cluster C1 of Largo da Oliveira. This comes from the extreme positive values of isovist attributes, exclusive proximity to commerce and visibility to the church that diverges highly from the mean of the all dataset. It’s located in a vestibular space to the square and a museum entrance with low visibility to the central space but through which penetrate long axial lines from south and across to the nearby Praça de São Tiago.
The clustering in the total set of the Sp points of the three squares also produces four clusters individualizing Praça do Giraldo main central space, with the highest mean of Sp’s VGA integration, isovist area and visibility to commerce (Fig. 8, above). The outlier cluster of Largo da Oliveira (C2 in this analysis) keeps its independence and Guimarães case studies share clusters C3 and C4 which separate the more segregated and irregular spaces from the main urban frontages. The key features that individualize those clusters are the opposite signs of VGA controllability, sky factor and the quantity of visible Pp points. It’s also possible to observe in the plot of Fig. 8 that Guimarães squares locate in the negative half plane of the data PC1, and are well separable from the main cluster of Évora.
Title 20
Fig.8: Analysis on the joined datasets. Above: X‐means clustering (the plotted squares are not at the same scale); below: predictor screening on the use location variables.
In another exploratory experiment using Screen Predictors, we analysed the normalized dataset of all the points in the discovery of strong predictors on the distribution of uses. Discarding the unidentified uses (Near=Other and VOther) we defined as our response variable the NearUse and all the others as explanatory ones (Fig. 8, bottom). The results are not surprising for Near=Monum (mainly churches in our case studies) as the main predictor is its characteristic extraordinary built volume; public buildings and commercial use have direct configurational related predictors, perimetral connectivity and VGA integration, respectively, corroboration long established space syntax findings; touristic/restaurant activity as well residential use have visibility as their strong predictors. The former has its own visibility as its main predictor, pointing to a clustering phenomenon on its location, and the latter has visibility to commercial use.
Title 21 6. RESUME OF RESULTS AND DISCUSSION
In a critical resume of the results we can assert:
1. Main correlations exist between visibility configurational related attributes (connectivity, visibility and VGA), and this studies shows that its relation to morphologic or environmental ones (e.g. façade area or sky visibility) is highly local.
2. Given the heterogeneity of the attributes, general correlation is low and sharp cluster are not predominate, however their number (four), if even automatically determined, is constant across the analysis of Sp point datasets.
3. Cluster description by prototype attribute values is heterogeneous but cross relation are highlighted, capturing some of the site idiosyncrasies.
4. Main discriminating attributes for clustering (appearing in all case studies prototypes definitions) are mainly direct or indirectly configurational.
5. Prototype clustering shows an outlier where the functional features are fundamental for its description, and not only physical or configurational aspects. 6. General analysis also produced four clusters, separating Évora example from
Guimarães ones, even if no spatial data was used. It shows some capacity for generalization as clusters appear across squares, but only extremely divergent cluster remain from the local to the global analysis.
7. Attributes related with physical proximity to Pp points (Use attributes) have low expression in clustering. This has to be investigated deeper as in an experiment using a normalization by range [0,1] they gain a greater predominance.
8. Within our dataset universe, strong predictors analysis on use location corroborates the predominance of configurational related attributes as main predictors. An interesting finding is the clustering phenomena of touristic and leisure activity that tends to cluster as its strong predictor is its on visibility.
The empirical analysis of the relation of people's appropriation of space with the spaces defined by the clustering of Sp points seems to corroborate the preference to highly clustered convex spaces of the location of terraces for instance (Fig. 7). Although these spaces are highly conditioned by the potential of transformation of built typologies, mainly their ground floor, and peripheral car circulation which tends to segregate the more domestic sides of the squares.
Title 22 7. CONCLUSIONS
Going beyond a perimetral syntactic analysis, as it can be made in Depthmap, or a shape analysis by perimetral connectivity, like in Psarra and Grajewski (2001), the present study illustrates a specific method for the analysis of the urban square which tries to capture its latent complexity. Taking a stand on the micro urban morphologic analysis and the individuality and potential of the perimetral space to work both as interface between public ‐ private and architecture ‐ urban space, this space is sincroniquelly and multidimensionally analysed in three Portuguese case studies resorting to data mining techniques. These seem most appropriate to support a data‐driven approach that tries to blend standpoints, scales and themes of analysis, reasserting the centrality of the study object, the urban space/square, in the realm of the varied field of the urban studies.
The basic concepts in which we delve are, beyond shape and proximity, visibility and permeability which in the space of the square have a particular character. While in the channel space of the street the intervisibility of façade and permeability are defined mainly by bilateral frontality, in the square that affinity is augmented by the presence of third elements in lateral relation. This kind of relation mediated by a third element is exactly at the root of configurational analysis and complexity itself (Poincaré’s three‐body problem).
We should stress that the analysis is highly sensitive to the a priori definition of the perimeter and to the method of data normalization. In future work these should be addressed as well clustering quality measures and the analysis of the frontier between clusters.
Although our approach is eminently analytical its application to design can be envisaged in a strategic level. It can help in promoting a more evidence‐based design and to gap the barriers between analysis, decision and project resorting to case‐based reasoning that is inherent to the presented methodologies.
New tools (concrete and conceptual) impelled the space syntax project in the 1980’s, namely graph and network theories, and backed up its structuralist approach (Hillier, 1996). As the theory fundamentals get stabilized its boundaries get more convulsed, and in the midst of a data driven society a new set of tools seem necessary to support our cognitive limitations and open new frontiers. Data mining and machine learning are here proposed as methods not only of systematic analysis on urban data and hypothesis testing but also hypothesis creation and speculative devices.
Title 23 ACKNOWLEDGMENTS
The first author is supported by FCT grant SFRH/BD/95148/2013. The author acknowledge the support of Guimarães and Évora municipalities for the accessibility to official cartography. REFERENCES Al‐Sayed, K (2013), ‘SYNTHETIC SPACE SYNTAX: A generative and supervised learning approach in urban design’, Proceedings of the Ninth International Space Syntax Symposium, Seoul: Sejong University. Campos, A. (1997), ‘Strategic Spaces: Patterns of Use in Public Squares in the City of London’, Proceedings 1st International Space Syntax Symposium, London, 26.1‐26.11 Campos, A. Golka, T. (2005), ‘Public Spaces Revised: A Study of the relationship between Patterns of Stationary Activities and Visual fields’, Proceedings 5th International Space Syntax Symposium, Delft Ahu, S., Cagdas, G., Sariyldiz, S. (2011), ‘A Multi‐Dimensional Exploration of Urban Attributes by Data Mining’, CAAD Futures 2011 : Designing Together, ULg. Benedikt, M (1979), ‘To take hold of space: isovists and isovist fields’, Environment and Planning B: Planning and Design, 6(1), 47–65 Beirão, JN. & Koltsova, A. (2015), ‘The Effects of Territorial Depth on the Liveliness of Streets’, Nexus Network Journal, 17(1), pp.73–102. Berghauser Pont, M. & Haupt, P. (2010), Spacematrix: Space, Density and Urban Form, Rotterdam: NAi Pub. Campos, M. (1997), 'Strategic spaces: patterns of use in public squares of the city of London', Space Syntax ‐ First International Symposium Proceedings, London, p. 26.1‐ 26.11. Campos, A. and Golka, T. (2005), 'Public Spaces Revised:of the relationship between Patterns of Stationary Activities and Visual fields', Proceedings 5th International Space Syntax Symposium, Delft. Chaszar, A. and Beirão, J. (2013), 'Feature Recognition and Clustering for Urban Modelling‐ Exploration and Analysis in GIS and CAD', Proceedings of the 18th CAADRIA Conference, Singapore, p. 601‐610. Coelho, C.D. (2008), A praça em Portugal. Inventário de espaço público, Lisbon: DGOTDU. Cutini, V. (2003), ‘Lines and squares: towards a configurational approach to the morphology of open spaces’, 4th International Space Syntax Symposium, London. Demsar, U. (2006), Data Mining of Geospatial Data : Combining Visual and Automatic Methods, PhD Thesis.KTH. Gehl, J. (2011). Life Between Buildings. Using Public Space. London: Island Press.
Title 24 Gil J., Beirão J., Montenegro N., & Duarte J. (2012), ‘On the discovery of urban typologies: Data mining the many dimensions of urban form.’ In Urban Morphology, vol. 16 (1), p.27– 40. Habraken, N. J., Teicher, J. (1998), The structure of the ordinary: form and control in the built environment, Cambridge, MA: MIT Press. Hanna, S. (2009), 'Spectral comparison of large urban graphs', Proceedings of the 7th International Space Syntax Symposium, Stockholm. Hillier, B. (1996), Space is the machine: a configurational theory of architecture, Cambridge: Cambridge University Press. Hillier, B. & Hanson, J. (1984), The Social Logic of Space, Cambridge: Cambridge University Press. Hillier B., Penn A., Hanson J., Grajewski T., Wu J. (1993), ‘Natural Movement: or, Configuration and Attraction in Urban Pedestrian Movement’, Environment and Planning B: Planning and Design, 20. Laskari A., Hanna S., & Derix C. (2008), ‘Urban Identity Through Quantifiable Spatial Attributes, Design Computing and Cognition, Vol. 08, p.615–634. Laskari, A. (2014), 'Multidimensional Comparative Analysis for the Classification of Residual Urban Voids', Proceedings of the 32nd eCAADe Conference, Newcastle upon Tyne, p. 283‐292 Lopes, J., Paio, A., Beirão, J.N., Pinho, E.M. & Nunes, L. (2015), ‘Multidimensional Analysis of Public Open Spaces ‐ Urban Morphology, Parametric Modelling and Data Mining.’, Proceedings of the 33rd eCAADe Conference, Vol 1, p. 351–360. Lynch, K. (1960), The Image of the City, Cambridge Massachussetts: MIT press. Miller, H.J. & Han, J. (2001), ‘Geographic data mining and knowledge discovery, An overview’. In Miller, H.J. & Han, J. (eds), Geographic data mining and knowledge discovery, Taylor & Francis. Palaiologou, G., Griffiths S., Vaughan L. (2016), ‘Reclaiming the virtual community for spatial cultures: Functional generality and cultural specificity at the interface of building and street’, The Journal of Space Syntax, Vol. 7 (1), p. 25‐54. Pelleg, D. and Moore, A. (2000), ‘X‐means: Extending K‐means with efficient estimation of the number of clusters’, Proceeding of the 17th International Conference on Machine Learning, p.727‐734. Psarra, S and Grajewski, T (2001), 'Describing shape and shape complexity using local properties', 3th International Space Syntax Symposium, Atlanta Ribeiro, O. (2011 [1945]), Portugal, o Mediterrâneo e o Atlântico, Estudo Geográfico, Lisboa: Letra Livre SAS Institute Inc. (2009), JMP® 9 Modeling and Multivariate Methods, Cary, NC: SAS Institute Inc. Serra, M., Gil, J. & Pinho, P. (2013), ‘Unsupervised Classification of Evolving Metropolitan
Title 25 Street Patterns’. In Ninth International Space Syntax Symposiump, p. 045:1‐046‐10.
Silva, M. (2009), Forma e circunstância: a praça na cidade portuguesa contemporânea, Unpublished Phd thesis. FAUP‐UP, Porto. Ståhle, A., Marcus, L. & Karlström, A. (2005), Place Syntax ‐ Geographic Accessibility with Axial Lines in GIS, Proceedings 5th International Space Syntax Symposium, Delft, pp. 131– 144. Thiel, P. (1961), ‘A sequence experience notation for architectural and urban space’, Town Planning Review, 32, pp.33–52. Turner, A. (2003), ‘Analysing the visual dynamics of spatial morphology’, Environment and Planning B: Planning and Design, 30(5), pp.657–676. van Nes, A. and López, M. J. J. (2007), ‘Micro scale spatial relationships in urban studies: The relationship between private and public space and its impact on street life’. In: Kubat, A. S., Ertekin, Ö., Güney, Y. I. and Eyübolou, E. (eds.), Proceedings of the Sixth International Space Syntax Symposium, Istanbul: I.T.U. Faculty of Architecture, p.023.1‐12. Witten I. & Frank E. (2005), Data mining: practical machine learning tools and techniques, Boston: Morgan Kaufman.