A
NALYSIS OF SELF
-
ANCHORED
AND GROUND
-
ANCHORED
SUSPENSION BRIDGES
C
ATARINA DAC
UNHAN
UNES DES
ÁM
ACHADODissertação submetida para satisfação parcial dos requisitos do grau de MESTRE EM ENGENHARIA CIVIL —ESPECIALIZAÇÃO EM ESTRUTURAS
Orientador: Professor Doutor Rui Manuel Meneses Carneiro de Barros
Coorientador: Professor Doutor Abolhassan Astaneh-Asl
Mestrado Integrado em Engenharia Civil 2013/2014
DEPARTAMENTO DE ENGENHARIA CIVILTel. +351-22-508 1901 Fax +351-22-508 1446 ! [email protected]
Editado por
FACULDADE DE ENGENHARIA DA UNIVERSIDADE DO PORTO
Rua Dr. Roberto Frias 4200-465 PORTO Portugal Tel. +351-22-508 1400 Fax +351-22-508 1440 ! [email protected] ! http://www.fe.up.pt
Reproduções parciais deste documento serão autorizadas na condição que seja mencionado o Autor e feita referência a Mestrado Integrado em Engenharia Civil - 2012/2013 - Departamento de Engenharia Civil, Faculdade de Engenharia da Universidade do Porto, Porto, Portugal, 2013.
As opiniões e informações incluídas neste documento representam unicamente o ponto de vista do respetivo Autor, não podendo o Editor aceitar qualquer responsabilidade legal ou outra em relação a erros ou omissões que possam existir.
Este documento foi produzido a partir de versão eletrónica fornecida pelo respetivo Autor.
Avô Joaquim, não te dei um último adeus, mas dedico-te este meu trabalho, pelo qual eu sei que ficarias orgulhoso.
Também aos meus Pais, Irmã e António por tornarem este sonho realidade.
Don’t cry because it is over, smile because it hapenned. Theodor Seuss Geisel
ACKNOWLEDGEMENTS
I would like to express my deepest gratitude to Professor Abolhassan Astaneh-Asl and the Civil and Environmental Engineering Department at University of California Berkeley. Firstly, for accepting my application and considering me worthy of working amongst the world’s top civil engineering students, researchers and Professors. Secondly, for including me in such a relevant, interesting, stimulating and complex project. I am proud and delighted to leave my contribution for it. Moreover, I learned immensely under Professor Astaneh’s supervision. The Professor is altogether one of the most proactive and hard-working Engineers. He is involved in a full agenda of many on-going projects, but he still finds the time to kindly teach and guide his student researchers. I will always keep in mind his wisdom, teachings and kindness as a role model for my future work.
I would also like to leave my sincere gratefulness to Professor Rui Carneiro de Barros, not only for his essential help during my initial application process, but also for always sparing his precious time for this research. Furthermore, I would like to thank him for always being so understanding and practical. It was fundamental for my work and well being to know I had encouragement and support back in Portugal.
In a more personal note, I would like to thank my parents and family who has supported me unconditionally at all times. Without them this opportunity would not have been possible.
Last but not least, I would like to thank my friends, all of them in different ways contributed for my happiness and personality, but also in my studies and learning:
- To António, best friend and supporter through better and harder times.
- M. João and Francisco P., for an unexpected but altogether brilliant and amazing friendship that will last way beyond the Structural Engineering intense semester. Not only are they among the most intelligent people I came to know, but also the funniest and generous.
- To both Pedro F. (Ferreira and Fonseca) who were always by my side on this 5-year journey. All the hours spent together were priceless.
- To Sérgio P. a patient friend and crisis manager that always has a kind and reassuring word.
- To all my new friends from all over the world, for the unforgettable, amazingly unbelievable moments they provided me during this semester abroad. Indeed, their support and motivation was fundamental in the hardest times.
ABSTRACT
The new self-anchored suspension span of the East San Francisco-Oakland Bay Bridge is the main subject of study of this research project. It was completed and opened to traffic on September 2013. It is an asymmetric single-tower self-anchored suspension bridge. Instead of the conventional ground-anchored system used for most suspension bridges, this design has the main cable anchorages on the deck.
The aim of this research is a comparative study between self-anchored and ground-anchored suspension bridge systems. This study focus mainly on Gravity analysis, but also partially in Dynamic analysis. For the comparison, different complex finite-element models were studied, developed and analyzed for global analysis. These models were studied during an initial stage of design and the next step of calculating and introducing prestressing in suspender cables is not taken into consideration. This last process was studied, but it is not so relevant for a comparative study, since the main purpose of cable prestress it to annul the effect of dead and live loads on the deck deformed shape, by introducing prestress force in the cables.
The new East Bay Bridge is currently the largest self-anchored suspension span of its kind in the world. Nonetheless, this ambitious design is controversial and faced innumerous design and construction issues. It was designed after a partial collapse of the upper-deck of the previous East Bay Bridge, which had a steel truss system. The location, design and structural elements are explained in detail. Moreover, a summary of the major construction issues is provided to contextualize this study and for a full understanding of the Bay Bridge project. Fractured rods, steel corrosion, weld quality among other construction issues resulted from the complex erection method that the self-anchored span required. As a matter of fact, a simpler erection method would not only have reduced the six and half billion dollar final cost, but also would have avoided many construction quality problems.
After a thorough study of the existing bridge, a finite-element model replicating the geometry, section, materials and other properties of the self-anchored span was analyzed under Dead and Live load combination. The model components and analysis parameters are fully described. The complex geometry is replicated by means of shell elements for deck, tower and foundation pile caps, frame elements for piers and truss elements for cables. Also, a highly nonlinear analysis is required due to the existence of suspension cables. The bridge displacement, force and stress calculations are performed at the end of a nonlinear load case, which includes P-Δ and large displacements effects. The deformed shape and tension of the cable needed to be taken as initial conditions for the structural calculation.
From the initial self-anchored model (SAS), three ground-anchored finite-element models (GAS) were created. It was a process of design optimization, derived from the results of analysis of each GAS model created. In the end, there were two GAS models that performed well.
The results for nonlinear Static analysis (Gravity) are then plotted and compared, as well as results of the modal and time-history analysis. Modal analysis results are presented for GAS models. Time-history analysis is performed with multi-support excitation for one set of ground-motion. At last, some conclusions are drawn, mainly based on the Gravity results.
KEYWORDS: Self-anchored Bay Bridge; Ground-anchored suspension bridge; Finite-element; Gravity analysis; Comparative study
RESUMO
A mais recente travessia entre São Francisco e Oakland - East Bay Bridge é a principal estrutura estudada nesta dissertação. Mais concretamente, o troço suspenso com ancoragem no próprio tabuleiro. A sua construção foi terminada em Setembro de 2013 e aberta ao tráfego automóvel. É uma ponte suspensa com uma torre apenas entre vãos assimétricos e cujas ancoragens do cabo principal estão localizadas no próprio tabuleiro da ponte. Este tipo de ancoragem difere totalmente do método de bloco no solo mais frequentemente usado.
O principal objectivo deste trabalho é um estudo comparativo entre pontes suspensas com ancoragem no próprio tabuleiro e pontes suspensas com bloco de ancoragem no solo. Este estudo será realizado principalmente para análise estática gravítica, mas também em parte para análise dinâmica. Para a comparação, modelos de elementos finitos foram estudados, desenvolvidos e analisados para análise global. Estes modelos foram calculados e analisados para uma fase inicial de dimensionamento, na qual não se considerou o pré-esforço a introduzir posteriormente nos cabos de suspensão. Esta última fase foi estudada e compreendida, mas não é relevante para o estudo. De facto, este pré-esforço é calculado e introduzido nos cabos de suspensão de modo a anular o efeito das cargas estáticas para a deformada do tabuleiro (de modo a colocar o tabuleiro praticamente na sua posição indeformada). Esta recente East Bay Bridge é de momento a maior ponte suspensa ancorada no próprio tabuleiro, para o seu tipo (torre única) no Mundo. No entanto, este projeto tem tanto de ambicioso como de controverso e deparou-se com inúmeros problemas de construção. Esta ponte veio substituir a anterior Bay Bridge, ponte metálica treliçada, a qual sofreu um colapso parcial do tabuleiro superior durante o terramoto de 1989. Para melhor compreensão do projeto, a localização, condições e elementos estruturais são apresentados em detalhe. Igualmente, foi feita uma descrição dos problemas de construção (corrosão, rotura de parafusos, soldaduras) para contextualizar a relevância deste presente estudo. De facto, este problemas estão muito relacionados com o complexo método de construção necessário para uma ponte suspensa ancorada no próprio tabuleiro. Um método de construção mais simples poderia reduzir o custo final de seis biliões e meio de dólares, bem como evitar os problemas supramencionados.
Um modelo com a geometria, seções, materiais e outras propriedades do vão suspenso será analisado para combinação de cargas e totalmente descrito neste trabalho. São utilizados elementos de membrana para tabuleiro, torre e maciço de fundação; elementos coluna para os pilares, vigas de encabeçamento e estacas de fundação; e elementos treliçados para os cabos. A análise é altamente não linear devido ao elemento cabo. O cálculo de deslocamentos, forças e tensões na estrutura incluem efeitos de não-lineariedade geométricas (P-Δ e grandes deslocamentos), pois a deformada e tensão dos cabos necessitam de ser consideradas a priori para o cálculo da estrutura.
Partindo de um modelo SAS inicial (self-anchored span), três modelos GAS com ancoragem exterior (ground-anchored span) serão desenvolvidos. Foi um processo de optimização, através dos resultados obtidos para cada modelo. Os resultados relevantes obtidos serão apresentados e comparados para análise estática, mas também para análise modal e dinâmica. A análise dinâmica tem diferentes funções para diferentes fundações, devido a condições geológicas. Por fim, algumas conclusões são apresentadas com base nos resultados da modelação efectuada.
PALAVRAS-CHAVE: East Bay Bridge; Ponte suspensa ancorada no tabuleiro; ancoragem exterior; Elementos finitos; estudo comparativo; Análise estática e dinâmica
TABLE OF CONTENTS ACKNOWLEDGMENTS…….……….………..……… I ABSTRACT……….………….…….III RESUMO……….………..V
1.
INTRODUCTION
... 1 1.1.!
PROJECT SCOPE ... 1!
1.2.!
REPORT ORGANIZATION ... 2!
2.
LITERATURE SURVEY
... 3!
3. EAST BAY BRIDGE:
!!
DEFINITION OF SELF-ANCHORED
SPAN
... 13!
3.1
!
INTRODUCTION ... 13!
3.2
!
SOIL CONDITION ... 16!
3.3
!
ALIGNMENT ... 17!
3.4
!
FOUNDATIONS AND PILES ... 18!
3.4.1
!
EAST FOUNDATIONS ... 18!
3.4.2
!
WEST FOUNDATIONS ... 19!
3.4.3
!
MAIN TOWER FOUNDATIONS ... 20!
3.5.PIERS AND ANCHORAGES ... 22
!
3.5.1.E2PIERS AND EAST ANCHORAGE ... 22
!
3.5.2.
!
W2PIERS AND WEST ANCHORAGE ... 24!
3.5.3.
!
BEARINGS AND SHEAR KEYS ... 27!
3.6.
!
SUPERSTRUCTURE ... 29!
3.6.1.ELEVATION AND PLAN ... 29
!
3.6.2.DOUBLE-DECK ... 30
!
3.6.3.
!
DETAILED CROSS SECTION ... 31!
3.6.4.
!
CROSS BEAMS AND FLOOORBEAMS ... 33!
3.7.
!
MAIN TOWER ... 33!
3.7.1.
!
SHAFTS AND SHEAR LINKS ... 35!
3.7.2.
!
TOWER SADDLE ... 39!
viii
3.8.1.
!
MAIN CABLE ... 40!
3.8.2.
!
HANGERS ... 42!
3.9.
!
SEISMIC DESIGN CRITERIA, ANALYSIS AND RESPONSE ... 43!
3.10.
!
ERECTION METHOD OF SELF-ANCHORED SPAN ... 44!
3.11.
!
RAINBOW BRIDGE AND SELF-ANCHORED SPAN OF SAN FRANCISCO-OAKLAND BAY BRIDGE: A COMPARATIVE STUDY ... 49!
3.11.1.
!
RAINBOW BRIDGE STRUCTURE ... 49!
3.11.2.
!
SOIL CONDITIONS ... 53!
4. CONSTRUCTION ISSUES
... 61!
4.1
.!
STRUCTURAL AND CONSTRUCTION ISSUES ... 61!
4.1.1
!
THREADED RODS AND BOLTS ... 62!
4.1.1.1
!
Shear Keys S1 and S2 ... 68!
4.1.1.2
.!
Other SAS locations with A354 Grade BD ... 75!
4.1.2
!
CABLE ... 81!
4.1.3!
TOWER ... 82!
4.1.3.1!
Top Saddle ... 82!
4.1.3.2.!
Base ... 83!
4.1.3.3.!
Composite piles ... 84!
4.1.4.!
SUPERSTRUCTURE ... 84!
4.1.4.1.
!
Steel Orthotropic Deck ... 84!
4.1.4.2.
!
Skyway ... 87!
4.1.5.
!
WEST SIDE (W2) ... 88!
5. FINITE-ELEMENT MODELS
... 89!
5.1
!
INTRODUCTION ... 89!
5.2
!
GROUND MOTION AND MULTIPLE-SUPPORT EXCITATIONS ... 90!
5.3
!
CALTRANS MODEL FOR SAS ... 93!
5.4
!
SELF-ANCHORED MODEL ... 95!
5.4.1
!
ELEMENTS ... 96!
5.4.2
!
MATERIAL PROPERTIES ... 108!
5.5
!
GROUND-ANCHORED MODEL WITH CABLE DISCONNECTED ... 112!
5.6
!
GROUND-ANCHORED MODEL REDESIGNED ... 113!
5.7
!
SYMMETRIC REDESIGNED GROUND-ANCHORED MODEL ... 114!
5.8.1
!
GRAVITY (NONLINEAR STATIC) ... 116!
5.8.2
!
MODAL ... 116!
5.8.3
!
NONLINEAR TIME-HISTORY ... 118!
5.9
!
LOAD CASES AND FUNCTIONS ... 118!
5.9.1
!
DEAD LOAD ... 119!
5.9.2!
LIVE LOAD ... 121!
5.9.3!
P-DELTA ... 121!
5.9.4.MODAL ... 122!
5.9.5.NLTIME HISTORY ... 122!
6. ANALYSIS RESULTS
... 123!
6.1
.!
STATIC GRAVITY ANALYSIS ... 123!
6.1.1
!
SASMODEL ... 123!
6.1.1.1
!
Stresses ... 123!
6.1.1.2
!
Forces ... 124!
6.1.1.3
!
Displacements ... 127!
6.1.2
!
GASMODEL WITH CABLE DISCONNECTED ... 128!
6.1.2.1
.!
Stresses ... 128!
6.1.2.2
.!
Forces ... 129!
6.1.2.3
.!
Displacements ... 131!
6.1.3
.!
REDESIGNED GROUND-ANCHORED MODEL ... 132!
6.1.3.1
.!
Stresses ... 132!
6.1.3.2
.!
Forces ... 133!
6.1.3.3
.!
Displacements ... 135!
6.1.4
.!
SYMMETRIC GROUND-ANCHORED MODEL ... 136!
6.1.4.1
.!
Stresses ... 136!
6.1.4.2
.!
Forces ... 138!
6.1.4.3
.!
Displacements ... 139!
6.2
.!
MODAL ANALYSIS ... 140!
6.2.1
.!
GASMODEL WITH CABLE DISCONNECTED ... 140!
6.2.2
.!
REDESIGNED GASMODEL ... 147!
6.2.3
.!
SYMMETRIC GASMODEL ... 153!
x
7. COMPARISON AND CONCLUSIONS
... 165!
7.1
!
STATIC GRAVITY ANALYSIS ... 165!
7.2
!
MODAL ANALYSIS ... 172!
LIST OF FIGURES
Fig. 2.1 - Self-anchored and ground-anchored suspension bridges force distribution. ... 11
Fig. 2.2 – Different types of sockets. ... 12
Fig. 3.1 –Project location and limits are between the arrows ... 13
Fig. 3.2 – East Bay Bridge partial collapse in 1989. ... 14
Fig. 3.3 – Earthquake accelerograms, including the 1989 Loma Prieta. ... 14
Fig. 3.4 – Self-anchored Bay Bridge span and Yerba Buena Island. ... 15
Fig. 3.5 – Entire East San Francisco-Oakland Bay Bridge structure and Self-anchored suspension span, respectively. ... 16
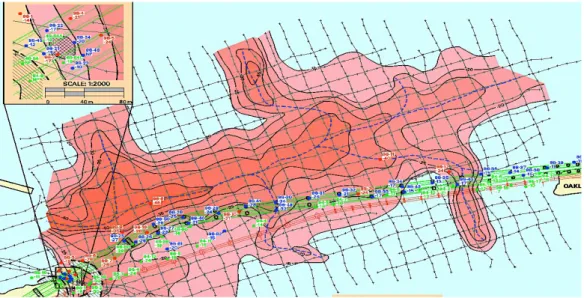
Fig. 3.6 – Contour of elevation of base of young bay mud spaced at 5m ... 17
Fig. 3.7 – Geotechnical conditions of the soil along the bridge longitudinal axis . ... 17
Fig. 3.8 – Previous East Bay Bridge, possible and selected alignments ... 18
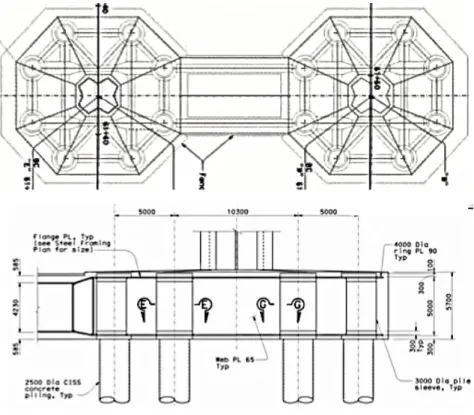
Fig. 3.9 – Plan and elevation sections of the East piers and pile cap ... 18
Fig. 3.10 – Cross Section of East piles inside Pile cap ... 19
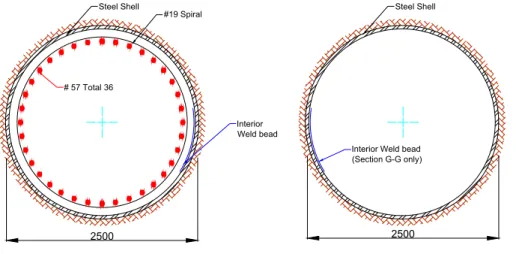
Fig. 3.11 – Cross Section at mid height of East foundation piles ... 19
Fig. 3.12 – West footings of east and west lines respectively. ... 20
Fig. 3.13 – Plan view of pile cap for the Tower base with foundation piles and tower shafts. ... 21
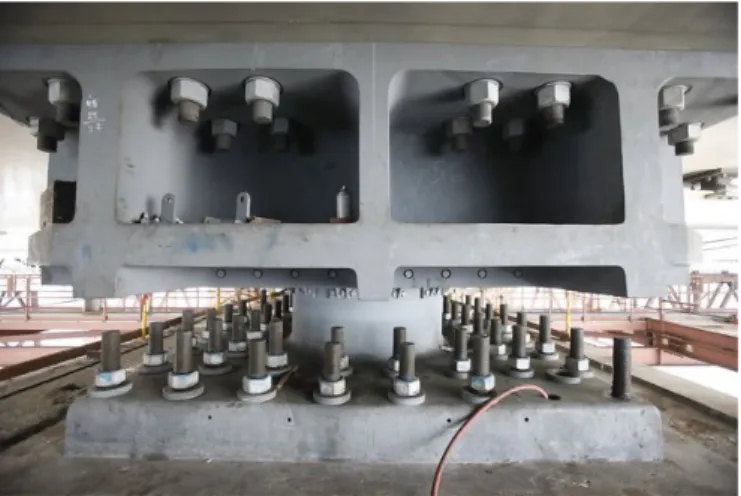
Fig. 3.14 –Plan view of dowels and anchor bolts on the tower base. ... 21
Fig. 3.15 – Tower base during construction ... 22
Fig. 3.16 - East pier cross section with dimensions (mm) and with rebar’s detail. ... 22
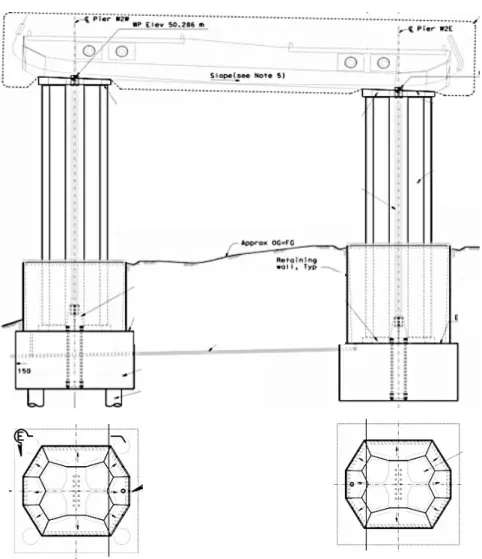
Fig. 3.17 - East pier transverse elevation with pile cap, piers, cap beam, deck anchorage. ... 23
Fig. 3.18 – Side view of the east deck cable anchorage. ... 23
Fig. 3.19 – Plan view of the east deck cable anchorage ... 24
Fig. 3.20 – Socket details for east deck cable anchorage ... 24
Fig. 3.21 – Cross section of the 4 separate columns for the west piers. ... 26
Fig. 3.22 – Half of Pier W2 plan view. ... 26
Fig. 3.23 – West transverse elevation with foundations, pier, cap beam and typical cross section ... 27
Fig. 3.24 – Shear Key for the east pier connection, with anchor rods visible ... 28
Fig. 3.25 – Plan and lateral view of shear key at Pier E2. ... 28
Fig. 3.26 – Lateral view of bearing at Pier E2. ... 28
Fig. 3.27 – Hinge pipes for SAS-YB and SAS-Skyway connection ... 29
Fig. 3.28 – Elevation and plan of the Self-anchored span. ... 30
Fig. 3.29 – Typical Cross section of the deck ... 31
Fig. 3.31 – Typical Cross section of one deck ... 32
Fig. 3.32 – Reduced-scale specimens of the upper and lower deck, respectively. ... 32
Fig. 3.33 – Typical crossbeam section. ... 33
Fig. 3.34 – Typical floorbeam section. ... 33
Fig. 3.35 – Tower longitudinal elevation and typical diaphragm sections ... 34
Fig. 3.36 – Tower transverse elevation ... 35
Fig. 3.37 – Shaft segments with shear link connections visible ... 36
Fig. 3.38 – Cross section, transverse and longitudinal tower elevation, respectively ... 36
Fig. 3.39 – Typical Pushover Analysis results (top load). ... 37
Fig. 3.40 – Type 1 (transverse) link deformation and detail on weld crack after a 345mm displacemen ... 37
Fig. 3.41 – Type 1 (transverse) and 3 (longitudinal) links respectively, with brittle fracture visible . ... 38
Fig. 3.42 – Type 1 (transverse) and 3 (longitudinal) graphs, respectively . ... 38
Fig. 3.43 – Saddle grillage being lifted to the top of the tower . ... 39
Fig. 3.44 – Plan, longitudinal and lateral views of the tower saddle. ... 39
Fig. 3.45 – Final section of the main cable after compaction ... 40
Fig. 3.46 – Transverse and longitudinal Suspenders detail. ... 42
Fig. 3.47 – Elevation of the bridge, with plastic hinges marked ... 44
Fig. 3.48 – SAS span and skyway foundations, respectively ... 44
Fig. 3.49 – Pier E2 and W2 erection, respectively ... 45
Fig. 3.50 – Falsework ... 45
Fig. 3.51 – Crane barge lifting steel orthotropic deck segment ... 46
Fig. 3.52 – Tower shaft lift ... 46
Fig. 3.53 – Aerial view with catwalk for cable strands assembly and steel strands pulling the tower to the West side ... 47
Fig. 3.54 – Top of the tower with main cable strands assembled ... 47
Fig. 3.55 – Cost summary of San-Francisco Oakland East Bay Bridge by September 2012 ... 49
Fig. 3.56 – Tokyo Rainbow Bridge. ... 50
Fig. 3.57 – Side and Plan view of the Tokyo Rainbow Bridge ... 50
Fig. 3.58– Shibaura side and Daiba side ground-anchorages. ... 50
Fig. 3.59– Shibaura side and Daiba side main towers, respectively ... 51
Fig. 3.60– Shibaura side and Daiba side towers, respectively. ... 51
Fig. 3.61– Tokyo Rainbow Bridge’s typical double-deck section ... 52
Fig. 3.63–North Tokyo Bay region with Rainbow Bridge specific location. ... 54
Fig. 3.64– Soil profiles for Ukita and Edogawa with SPT test results ... 54
Fig. 3.65– Takasago testing location and soil profile ... 55
Fig. 3.66 – Urayasu soil profile ... 56
Fig.3.67 – Tokyo Rainbow Bridge longitudinal geological profile ... 56
Fig.3.68 - Rainbow Bridge anchorage system and observatory platform ... 57
Fig. 3.69 – Map Contour with location of Pier W2, Tower T1 and Pier E2 for SAS ... 57
Fig. 3.70 –Longitudinal geological profile for the Self-anchored Span of the SFOBB ... 58
Fig. 3.71 – CPT results and scale for Pier E2 section ... 59
Fig. 4.1. – SAS bridge side view with ten highlighted locations. ... 62
Fig. 4.2. – Galvanization process for the East SAS Bay Bridge according to TBPOC. ... 66
Fig. 4.3. – Main causes for Hydrogen embrittlement (HE) or Stress Corrosion cracking (SCC). ... 67
Fig. 4.4. – Timeline for the anchor rods (2008) failure on Shear keys S1 and S2 ... 68
Fig. 4.5. – Shear Keys and bearings at Pier E2 ... 69
Fig. 4.6. – Shear Key S1 and S2 with L1 and L2 type of rods, as well as failed rods and samples extracted ... 69
Fig. 4.7. – Facture surface of Shear Key S1 rod after cleaning ... 71
Fig. 4.8. – Rockwell C hardness test results from Shear Key S1 and S2 two samples ... 71
Fig. 4.9. – Hardness testing comparison between 2008 and 2010 samples, respectively, from Pier E2 ... 72
Fig. 4.10. – Reduced section tensile strength and Impact testing for 2008 and 2010 samples, respectively ... 73
Fig. 4.11. – Solution 1 and 2 respectively for the Pier E2 failed shear keys ... 74
Fig. 4.12. – Detailed steel saddle solution for Shear key replacement (Option 2) ... 74
Fig. 4.13. – Location #1 to #6 of the A354 Grade BD threaded rods and bolts ... 75
Fig. 4.14. – Location #7 to #12 of the A354 Grade BD threaded rods and bolts ... 76
Fig. 4.15. – Location #15 to #17 of the A354 Grade BD threaded rods and bolts ... 77
Fig. 4.16. –TBPOC KI-HRC graph from testing (left) and the same overlapped with a typical KISCC -HRC curve ... 78
Fig. 4.17. –KISCC-HRC curve from Townsend study ... 79
Fig. 4.18. –Comparison of HRC for cut and rolled threads and the scenario at the surface for cut and rolled threads, respectively ... 81
Fig. 4.19. –Average Rockwell hardness distribution for location #18, respectively ... 82
Fig. 4.20. –Average Rockwell hardness distribution for locations #12 and #13, respectively ... 83
Fig. 4.22. –Water leak inside the deck on the guardrail bolted connection. ... 86
Fig. 4.23 –Corrosion signs inside the deck. ... 86
Fig. 4.24 –Connection between bike path and steel orthotropic deck. ... 87
Fig. 5.1 – Set 1 of Ground motions from Caltrans (Rock motions for T1 and W2 foundations). ... 92
Fig. 5.2 –Soil motions from Caltrans for Pier E2 foundation ... 93
Fig. 5.3 – ADINA global model of the bridge ... 94
Fig. 5.4 – Hybrid and detailed models of the East piles ... 95
Fig. 5.5 – SAP2000 model of the SAS span used in this study. ... 96
Fig.5.6 – 3D view of the West side and cross section of one W2 column ... 99
Fig. 5.7 – 3D view of the East side and cross section of E2 pier ... 99
Fig. 5.8 – Hinge at the transition to Skyway and spring modeling at SAP2000. ... 99
Fig. 5.10 – Tower with detail of 1 of 4 tower shafts with plate labeling as in SAP2000 model. ... 102
Fig. 5.12 – Typical section of the Deck (“W” Line) with plate numeration. ... 106
Fig. 5.13 – Stiffeners type for typical section of the Deck (“W” Line). ... 106
Fig. 5.14 – Equivalent thickness of the steel orthotropic deck plate without ribs. ... 106
Fig. 5.16 – Results of boring test at Tower location with undrained soil shear strength until 60-meter deep ... 112
Fig. 5.17 – SAP2000 ground-anchored model views ... 113
Fig. 5.18 – SAP2000 redesigned ground-anchored model views. ... 114
Fig. 5.19 – SAP2000 symmetric design of ground-anchored bridge. ... 115
Fig. 5.21 – XZ view of SAS model with span division. ... 121
Fig.6.1 – Longitudinal stresses on the top plates of the SAS bridge deck for Gravity Analysis. ... 123
Fig.6.2 – Longitudinal stresses on the bottom plates of the SAS bridge deck for Gravity analysis. ... 124
Fig.6.6 – Vertical and longitudinal displacements for SAS bridge for Gravity Analysis ... 127
Fig.6.7 – Longitudinal stresses on the top plates of the GAS bridge deck for Gravity Analysis ... 128
Fig.6.8 – Longitudinal stresses on the bottom plates of the GAS bridge deck for Gravity Analysis ... 129
Fig.6.9 – Vertical and longitudinal displacements for GAS bridge for Gravity Analysis, respectively. ... 131
Fig.6.10 – Longitudinal stresses on the top plates of the redesigned GAS bridge deck for Gravity Analysis. ... 132
Fig.6.11 – Longitudinal stresses on the bottom plates of the redesigned GAS bridge deck for Gravity Analysis. ... 134 Fig.6.12 – Vertical and longitudinal displacements for GAS bridge for Gravity Analysis, respectively135
Fig.6.13 – Longitudinal stresses on the top plates of the symmetric GAS bridge deck for Gravity
Analysis. ... 137
Fig. 6.14 – Longitudinal stresses on the bottom plates of the symmetric GAS bridge deck for Gravity Analysis. ... 137
Fig.6.15 – Vertical displacements for symmetric GAS bridge for Gravity Analysis. ... 139
Fig. 6.16 – 3D view of 1st mode for GAS model ... 141
Fig. 6.17 – XZ view of 1st mode for GAS model ... 141
Fig. 6.18 – XY view of 1st mode for GAS model ... 141
Fig. 6.19 – 3D view of 2nd mode for GAS model ... 142
Fig. 6.20 – XZ view of 2nd mode for GAS model ... 142
Fig. 6.21 – XY view of 2nd mode for GAS model ... 142
Fig. 6.22- 3D view of 3rd mode for GAS model ... 143
Fig. 6.23 – XZ view of 3rd mode for GAS model ... 143
Fig. 6.24 – XY view of 3rd mode for GAS model ... 143
Fig. 6.25– 3D view of 4th mode for GAS model ... 144
Fig. 6.26 – XZ view of 4th mode for GAS model ... 144
Fig. 6.27 – XY view of 4th mode for GAS model ... 144
Fig. 6.28 – 3D view of 5th mode for GAS model ... 145
Fig. 6.29 – XZ view of 5th mode for GAS model ... 145
Fig. 6.30 – XY view of 5th mode for GAS model ... 145
Fig.6.31 – 3D view of 6th mode for GAS model ... 146
Fig. 6.32 – XZ view of 6th mode for GAS model ... 146
Fig. 6.33 – XZ view of 6th mode for GAS model ... 146
Fig. 6.34 – 3D view of 1st mode for redesigned GAS model ... 147
Fig. 6.35 – XZ view of 1st mode for redesigned GAS model ... 147
Fig. 6.36 – XY view of 1st mode for redesigned GAS model ... 147
Fig. 6.37 – 3D view of 2nd mode for redesigned GAS model ... 148
Fig. 6.38 –XZ view of 2nd mode for redesigned GAS model ... 148
Fig. 6.39 – XY view of 2nd mode for redesigned GAS model ... 148
Fig. 6.40 – 3D view of 3rd mode for redesigned GAS model ... 149
Fig. 6.41 – XZ view of 3rd mode for redesigned GAS model ... 149
Fig. 6.42 – XY view of 3rd mode for redesigned GAS model ... 149
Fig. 6.43 – 3D view of 4th mode for redesigned GAS model ... 150
Fig. 6.45 – XY view of 4th mode for redesigned GAS model ... 150
Fig. 6.46 – 3D view of 5th mode for redesigned GAS model ... 151
Fig. 6.47 – XZ view of 5th mode for redesigned GAS model ... 151
Fig. 6.48 – XY view of 5th mode for redesigned GAS model ... 151
Fig. 6.49 – 3D view of 6th mode for redesigned GAS model ... 152
Fig. 6.50 – XZ view of 6th mode for redesigned GAS model ... 152
Fig. 6.51 – XY view of 6th mode for redesigned GAS model ... 152
Fig. 6.52 – 3D view of 1st mode for symmetric GAS model ... 153
Fig. 6.53 – XZ view of 1st mode for symmetric GAS model ... 153
Fig. 6.54 – XY view of 1st mode for symmetric GAS model ... 153
Fig. 6.55 – 3D view of 2nd mode for symmetric GAS model ... 154
Fig. 6.56 – XZ view of 2nd mode for symmetric GAS model ... 154
Fig. 6.57 – XY view of 2nd mode for symmetric GAS model ... 154
Fig. 6.58 – 3D view of 3rd mode for symmetric GAS model ... 155
Fig. 6.59 – XZ view of 3rd mode for symmetric GAS model ... 155
Fig. 6.60 – XY view of 3rd mode for symmetric GAS model ... 155
Fig. 6.64 – 3D view of 7th mode for symmetric GAS model ... 156
Fig. 6.65 – XZ view of 7th mode for symmetric GAS model ... 156
Fig. 6.66 – XY view of 7th mode for symmetric GAS model ... 156
Fig. 6.67 – 3D view of 8th mode for symmetric GAS model ... 157
Fig. 6.68 – XZ view of 8th mode for symmetric GAS model ... 157
Fig. 6.69 – XY view of 8th mode for symmetric GAS model ... 157
Fig. 6.70 – 3D view of 9th mode for symmetric GAS model ... 158
Fig. 6.71 – XZ view of 9th mode for symmetric GAS model ... 158
Fig. 6.72 – XY view of 9th mode for symmetric GAS model ... 158
Fig.7.1 – Von Mises stresses on top deck plates of Original SAS model for Gravity analysis. ... 166
Fig.7.2 – Von Mises stresses on top deck plates of GAS model with cable disconnected for Gravity analysis. ... 166
Fig.7.3 – Deck’s displacement and stresses comparison between the 3 models for Gravity analysis. ... 168
Fig.7.4 – Forces comparison between the 3 models for Gravity analysis. ... 169
Fig.7.5 – 1st Gravity and Modal analysis results for symmetric GAS model ... 170
Fig.7.6 – Deck’s displacement and stresses and forces for the Symmetric GAS model for Gravity analysis. ... 171
LIST OF TABLES
Table 2.1 – ATC-32 Minimum required analysis ...10 Table 3.1 – Comparison between two cable construction methods………41 Table 3.2 – Rainbow Bridge’s main structural characteristics…………..………….………..…52 Table 4.1. – TBPOC Committee comparison between steel rods types………....64 Table 4.2. – 17 Locations of the A354 BD rods at SAS span………..65 Table 4.3. – Rod-by-rod resolution according to TBPOC Committee………...80 Table 5.1 – West Side and Cable elements and properties at the SAP2000 model for the Self-anchored span………..………..……….……96 Table 5.2 – East Side elements and properties at SAP2000 model for the Self-anchored span…..…97 Table 5.3 – Tower elements properties at the SAP2000 model for the Self-anchored span……….100 Table 5.4 – Tower plate’s properties at the SAP2000 model for the Self-anchored span………….101 Table 5.5 – Tower shear link and bracing’s properties at the SAP2000 model for the Self-anchored span ………..………..………..……….…103 Table 5.6 – Tower elements and properties at the SAP2000 model for the Self-anchored span ………..………..………..………..……….…103 Table 5.7 – Tower elements and properties at the SAP2000 model for the Self-anchored span ………..………..………..………..……….…104 Table 5.8 – Steel orthotropic deck plate’s properties at the SAP2000 model for the Self-anchored span ………..………..………..………....105 Table 5.9 – Steel orthotropic deck diaphragms and cross beams at the SAP2000 model for the Self-anchored span………..………..………..………...………...107 Table 5.10 – Materials at SAP2000 model. ………..………..………108 Table 5.11 – Restraints and releases assigned for SAS model. ………..……...………..110 Table 5.12 – Load Combination………..………..………..………...119 Table 5.13 – Dead load for counterweight/bike lane………..……….…………..………....119 Table 5.14 – Dead load for Overlay………..………..………...119 Table 5.15 – Dead load for Guard Rails………..………..……….………...120 Table 6.1 – Axial Force at the cables for Gravity analysis………..………..…………124 Table 6.2 – Forces at the Piers and piles for SAS Gravity analysis………..………...125 Table 6.3 – Vertical and longitudinal displacements for SAS Gravity analysis………...…..…...128 Table 6.4 – Axial Force at the cables for Gravity analysis for GAS model. ………...129 Table 6.5 – Forces at the Piers and piles for Gravity analysis for GAS model. ……….130 Table 6.6 – Vertical and longitudinal displacements for GAS with cable disconnected for Gravity analysis………..…...132 Table 6.7 – Axial Force at the cables for Gravity analysis for redesigned GAS model. …………..…133
Table 6.8 – Forces at the Piers and piles for Gravity analysis for GAS model. ………..….134 Table 6.9 – Vertical and longitudinal displacements for redesigned GAS Gravity analysis……..128 Table 6.10 – Axial Force at the cables for Gravity analysis for symmetric GAS model. ………..…..138 Table 6.11 – Forces at the Piers and piles for Gravity analysis for symmetric GAS model. ……..….138 Table 6.12 – Vertical and longitudinal displacements for symmetric GAS Gravity analysis……...140
LIST OF GRAPHS
Graph 5.1–%Cumulative Mass participation ratio per mode for GAS model……….……….117 Graph 5.2 – % Cumulative Mass participation ratio per mode for redesigned GAS model…………..117 Graph 5.3 – % Cumulative Mass participation ratio per mode for new symmetric GAS design…...…118 Graph 6.1 – Interaction curve P-M for W2 columns with Gravity analysis maximum results…..……..126 Graph 6.2 – Interaction curve P-M for E2 piers with Gravity analysis maximum results…….………..127 Graph 6.3 – Displacement of main span as function of time for SAS model...159 Graph6.4–Displacement of main span as function of time for GAS with only cable disconnected...160 Graph 6.5 – Displacement of main span as function of time for symmetric GAS...160 Graph 6.6 – Main span von Mises stress at deck top plates for three models. ...161 Graph 6.7– Deck (X=0m) von Mises stress for three models. ...161 Graph 6.8 – SAS and GAS with cable disconnected P-M(longitudinal) for time-history at Top of Pier
W2. ...162
Graph 6.9 – SAS and GAS with cable disconnected P-M(longitudinal) for time-history at Bottom of
Pier
W2...162
Graph 6.10 – SAS and GAS with cable disconnected P-M(longitudinal) for time-history at Bottom of
Pier E2.
1
INTRODUCTION
1.1. PROJECT SCOPE
Bridge engineering is one of the oldest sciences in the history of humanity. The fundamental purpose of a bridge is to allow the crossing of watercourses and other major obstacles to society’s expansion and development. It evolved from the simplest of shapes and materials to the most complex and indeterminate structures that stretch the limits of engineering and creativity. Longer distances needed to be crossed and a new system eventually arose: cable suspended and more specifically, ground-anchored suspension bridges. This system appeared later in time, due to the need of high strength materials and more advanced theories.
For the Bay area region, the San Francisco-Oakland Bay Bridge has been an essential connection even before the iconic Golden Gate Bridge. Located between active seismic faults such as San Andreas, Hayward, among others, the Bay Bridge requires high design standards. The Bay Bridge is part of the Interstate-80 route and registers a daily traffic of around 250000 people. It consists of two separate spans (East and West) divided by Yerba Buena Island. The 1989 Loma Prieta earthquake caused a 17-meter long upper-deck section of the old East Bay Bridge to collapse. Not only human lives were lost, but also the construction repairs and the delay in the re-opening of the crossing had very negative impacts on the Bay area community. After several years of study, the previous steel truss bridge replacement was decided and the new East self-anchored suspension span was the chosen design. The new East Bay Bridge opened to the public in September 2013.
This self-anchored suspension system derives from the conventional ground-anchored suspension system and its practice is not widely spread. Some of the reasons are its less redundant structure only feasible for shorter spans, which needs a more complex and expensive erection method when compared to a conventional ground-anchored suspension system. Specifically, as far as the new East Bay Bridge self-anchored span is concerned, several problems and controversies arose during the 15 years of design and construction. Indeed, many experts expressed their opinion against the design choice and question its safety in the long-term. Professor Astaneh-Asl is one of the most experienced voices questioning the Bridge design choice and safety. Therefore, Professor Astaneh-Asl supervised this MsC dissertation, which is a part of the main research project on the new Bay Bridge self-anchored span.
The main scope of this research is the study of the overall East Bay Bridge existing self-anchored span project and development of an altered design with a ground-anchored suspension system instead. The comparative analysis of these opposed designs was achieved by means of finite-element models. The final goal is to have a clear vision of the differences, advantages and disadvantages of each system - self and ground-anchored suspension span.
1.2. REPORT ORGANIZATION
This report is divided in seven chapters. Besides this explanatory introductory note, Chapter two summarizes all the scientific and technical literature found relevant by the author and studied for the development of this analysis. Besides the fact the self-anchored suspension system is not intuitive or commonly done, the new East Bay Bridge has even more complex characteristics such as asymmetric spans with single tower and 3D cable geometry. Therefore, literature survey was fundamental for further knowledge.
The third chapter dissects the Bridge self-anchored span structural elements and summarizes their characteristics and properties, as defined by the design team. The author was given access to the official project drawings from Caltrans, as well as to a complex finite-element model developed by Professor Astaneh and his research students that replicates the existent self-anchored span. A fully correct understanding of the structure is the first step towards an adequate and fair comparative study. The fourth chapter includes a full description of the main issues and problems that arose during construction. As said before, the new East Bay Bridge self-anchored span is controversial. Indeed not only it was the most expensive project ever in the State of California, but also it faced various quality problems that might undermine the Bridge 150 service-life. This Chapter was found relevant to show some of the motives why different alternatives are being studied to compared with the existent SAS span.
As a matter of fact, Chapter three comes as an introduction to the fifth Chapter, which describes in detail the SAP2000 finite-element models, load definition and analysis parameters performed. The initial SAS model was previously developed and fully checked by the author. Furthermore, the author also did some improvements to the SAS model. After the SAS (self-anchored) model is set, the development of the GAS (ground-anchored) models started and in the end there were created three different GAS models. Firstly, it was analyzed a ground-anchored model with all the same characteristics of the initial SAS, but with the main cable disconnected at its extremities and pinned. This model intends to compare the differences that come from a simple change as the type of cable anchorage. Although presenting very good results, some elements are now overdesigned for a ground-anchored design and can use some developments. A second GAS model is created without some heavier structural elements, no longer needed in case of a ground-anchored suspension bridge. This redesigned GAS model kept the asymmetric spans but changed the cable sag slightly. Nevertheless, it was definitely not an optimized ground-anchored suspension, due to the asymmetry and cable sag to span ratio. Consequently, a last GAS model was designed keeping the single-tower, but with the tower location changed to have symmetric spans. The main models for comparison were the 1st and 3rd GAS
models (with only cable disconnected and with symmetric spans) and the initial SAS model.
Last but not the least, Chapter six and seven present relevant plotting results for the models and some comparisons and conclusions, respectively.
2
LITERATURE
SURVEY
Suspension Bridges have been studied and used for around 200 years now. Some important design advances have been made throughout the years, particularly after well-known failures and collapses of bridges such as Tacoma Narrows Bridge (1940). Advances in engineering are very much related to learning from past errors. This way, dynamic analysis of bridge structures has become a priority in the past decades. McCallen and Astaneh-Asl [1] state that both the 1989 Loma Prieta Earthquake and the 1994 Northridge California earthquakes brought awareness to seismic vulnerabilities of transportation systems, since many structures where built between 1930 and 1960 and lack modern seismic methodologies. McCallen and Astaneh-Asl [1] used the West San Francisco-Oakland Bay Bridge as object of study and investigated issues such as spatially varying ground motions and nonlinear response simulations of the bridge system dynamic response. Also it relates the wide range of frequencies of suspension bridges (modes of deck system with low frequency and tower with high frequency [2]) with the consideration of long period modes of vibration near active fault sites. For these cases, it is important to consider the possibility and consequences of large ground motion displacement pulses with around 5-second period. For short period structures (stiff), they would have minimal dynamic response to these long period motions and would move essentially as a rigid body with the ground motion. On the other hand, long period structures (flexible), would register a significant dynamic response to these long period pulses. For instance, the Bay Bridge west crossing has a transverse vibration of main span as fundamental vibration mode with about 9 to 10s. The ground motion pulse lasts around half of the fundamental period of the bridge. As a consequence, the pulse inputs tremendous energy to the Bay Bridge at the start of the earthquake motions, creating opposite displacements between towers and deck (main deck span flung between the towers in sling slot fashion) [2].
Also Astaneh, A. (1996) enumerated consequences of Loma Prieta earthquake and how it was a warning for seismic damage vulnerabilities of long span steel bridges. These type of bridges have complex seismic behavior due to: i) site condition varies significantly from bridge to bridge and also from pier to pier; ii) each long span bridge has unique structural configuration (suspension, cable-stayed, cantilever spans or simply supported trusses); iii) light or regular weight concrete as well as steel orthotropic decks have been used; iv) long spans bridges in the San Francisco Bay area have been built, using a variety of connectors (rivets, bolts and welds); v) Long span bridges have thousands of members and connections, which many of them are expected to experience inelasticity during major earthquakes. The analytical model should include material and kinematic nonlinearities; vi) Long span bridges have close modes of vibration with mass participation distributed over these modes and, as a result, response spectra analysis does not provide reliable results. Time history analysis with multiple support excitations is needed to understand seismic response properly. Furthermore, this paper
provides Seismic performance criteria as related to bridge-priority ratings and Structural analysis aspects such as Demand/Capacity ratios for inelastic and elastic analysis [3].
Nowadays, many scientific and technical papers and projects exist on conventional suspension bridges (McCallen and Astaneh-Asl, 2009; Shinozuka et al, 2009; Liu et al, 2000), which shows that the traditional suspension bridges anchored to the ground are widely used.
During early 1900’s, a variation from the abovementioned structural system was developed: self-anchored suspension bridges. Over the last 30 years the self-self-anchored suspension bridge was brought to use again. Ochsendorf et al (1999) has a thorough characterization of this new type of bridge, its historical development, its possible analysis and design. Contrary to ground-anchored suspension bridges, which imply the use of large ground anchorage systems for the main cables, the self-anchored has the main cables secured to each end of the bridge deck. The deck now has two functions. First, it carries the horizontal component of the cable tension as a compression force, which is generally large and should be taken into consideration in the analysis. Secondly, the deck carries the vertical traffic loads and spreads it to the suspenders. Moreover, this paper refers examples of existing SAS bridges: Konohana (Japan) and Yong Jong (Korea). Konohana is a successful example because: i) used an efficient method of erection, which included tower construction, prefabricated deck sections and prefabricated parallel wire strands method for the cable; ii) inclined and prestressed hangers to avoid slacken under load condition; iii) inverted trapezoidal box girder designed to minimize falsework (closed box shape provides excellent aerodynamic and torsional performances). For both bridges a finite element model was created in order to obtain the following conclusions:
- Inclined hangers have beneficial effects on the bridge’s behavior, because it reduces 34% of the maximum moment and 26% of the maximum deflections in the girder, for static loading. Also, they improve dynamic damping;
- A camber in the deck does not significantly influence the overall behavior of the bridge [4]. A more recent study by van Goolen (2006) has defined many other characteristics of SAS bridges and modeled this structural system in order to take some important conclusions. For the stiffening girder, an augment of the span length causes an increase of axial force and second order effects (geometric nonlinearities), which consequently increases the risk of global buckling instability, aerodynamic reactions and erection method. Also, adding weight distribution to the stiffening girder can decrease natural frequencies and increase the main cable tension force. Furthermore, for conventional suspension bridges, the slenderness of the girder is higher than on SAS bridges (more axial forces, more stiffness). The phenomenon of geometric nonlinearity is also presented in long span bridges as referred to before. For the towers, they have to support the main cable and transmit vertical forces to the foundations. Steel towers are more common and usually comprised of steel multi-cells or box single-cell sections. They must be stiffened with ribs to prevent local buckling [5].
Ochsendorf et al (1999) enumerates advantages and disadvantages of this new method and states that these disadvantages have prevented it from widespread acceptance. Nevertheless, many engineers in the United States, Korea and China have shown interest in self-anchored bridges, which must indicate it is not an inferior form and that is actually competitive for spans between 250-400m.
Advantages:
- elimination of large anchor blocks; - relatively stiff superstructure;
- end supports resist only vertical component of cable force , which is an advantage in case the soil conditions are not ideal;
- its economic benefits vary depending on the specific site conditions, but as the anchorage system is a great part of the cost, eliminating the external anchorages can provide a cheaper construction cost. Nevertheless, this will always depend on the erection method.
Disadvantages:
- complex construction resulting from erection of the stiffening girder prior to the installation of main cables;
- lower degree of redundancy than a conventional ground-anchored suspension bridge;
- the stiffening girder must be maintained and protected from damage, in order to prevent catastrophic collapse;
- unfamiliar form that can present analysis and design difficulties (e.g. second order effects are larger) [4].
Since the SAS structural system is still far from common, a list of the relevant self-anchored suspension bridges ever constructed and its key structural characteristics is given [5]. This list can be found in Annex A.2.1. It should be emphasized that the main boost in its construction was registered in China. Indeed, Zhang et al (2006) enumerates and describes techniques for three of these new SAS bridge examples in China [6].
As was mentioned earlier, in 1989, due to Loma Prieta earthquake, the east span of the San Francisco-Oakland Bay Bridge suffered a partial collapse of 17-meter long deck. A construction of a new east crossing was decided and the new self-anchored span alternative approved [7, 8, 9]. Since then, A. Astaneh-Asl is one of the experienced voices who has raised doubts and serious worries about the design of the new east span of San Francisco-Oakland Bay Bridge. The UCBerkeley Professor shared his concerns with MTC officials before the advisory panel approved the design in 1998. Also, he has publicly shared his opinion in several occasions: “Think of a tower holding up a tray. Instead of being anchored in the ground, as is traditionally the case, the bridge is essentially holding itself up. That means if there is a sufficient rupture, all or part of the span could unravel (...) with a self-anchored suspension span, permanent displacement could cause a completely different story. Because the suspension cables are anchored into the deck, should the deck give way and lose compression, there's nothing to hold the cables. The entire [suspension] span could unravel”. That scenario has been discounted by Caltrans and Herb Rothman (bridge’s chief design engineer): "This bridge will be very well suited to a high seismic area. As far as we're concerned, the bridge has ideal earthquake characteristics, and meets all the standards that the state mandated for it." [10]
The designing team of the new East San Francisco-Oakland Bay Bridge has published several papers about its design. Indeed, Manzanarez et al (2000) and Nader et al (2000) explain in more detail other design alternatives, how the soil conditions dictated the choice for the self-anchored signature span and its seismic design philosophy [7, 9]. Likewise, Sun et al (2002) justifies the project decision towards a looped cable anchorage system on the West bent and also explains the West bent composition: looped anchorage, cap beam, tie-down system and connectivity between the cap beams and piers [8]. As far as the suspension cable of the bridge is concerned, Sun et al (2004) published its design considerations. It is referred its layout, favored construction method, advantages and corrosion protection systems. Since the suspension cable is one of the main structural elements and has a unique 3D geometric configuration, its design was truly a challenge. Sun also explains why the modified octagonal strand layout was chosen [11]. Soon after the paper was published, it was brought to open
discussion by Knox, H. [12] who had concerns about the modified octagon strand arrangement and its future difficulties in construction as well as the overall construction method and cost. In response to the concerns raised, Sun et al (2004) provided additional information related to the suspension cable design and construction.
Still related with the new east Bay Bridge design, McDaniel and Seible (2005) studied the influence of inelastic tower links on the seismic response, more specifically the influence of ground motion intensity and tower links stiffness, location and hysteretic characteristics. These allowed them to conclude that the links addition improved the behavior of the structure. The most important conclusions were that inelastic links reduced the seismic displacement and moment demands through hysteretic response and coupling of the tower shafts, as well as the tower’s middle region to be the most effective location for reducing demand/capacity ratios [13]. Also, the abovementioned authors, with Uang and Chou released another scientific paper related to the performance evaluation of the same tower shear links as well as the orthotropic steel deck panels. Cyclic tests on full-scale links proved these are able to reach inelastic rotation more than it would occur in a SEE seismic event, however brittle failure was registered and alterations were proposed in the welding details. Monotonic testing for two reduced scale deck panels (stiffened with closed ribs or open ribs) showed that they can develop a compression capacity greater than what would be produced by the design earthquake [14]. Later, Nader and Maroney (2007) published another paper related to the design of the new East Bay Bridge. It describes the bridge as a one-of-a-kind design and includes statistics and design details. It defines the 385-meter main span as record-setting and the Bay bridge itself as the first suspension bridge without connection between the tower and deck as well as a unique and first-time ever tower design. Furthermore, some important structural elements, such as Piers E2 and W2, tower, hinges and steel orthotropic deck are discussed [15].
It was mentioned before that there has been a boost of SAS bridges’ construction in China in recent years. As a consequence, mainly in the past five years several papers with SAS-related studies have been published. Gao et al (2009) performed seismic analysis and optimization design for an approved SAS bridge design over Huangshuihe River. They performed modal analysis and nonlinear time history analysis with a SAP2000 model. Girder, towers, piers, piles, main cables and suspenders were modeled with frame elements and a compression limit of zero was imposed to the cable and suspenders. They studied an optimization for the bridge seismic response and for that they analyzed the discontinuity in the towers (architectural configuration) and the possible use of nonlinear fluid viscous dampers [16]. Li et al (2009) studied the pile-soil-structure interaction on seismic response of a SAS bridge, using the Dalian Jinzhou Bridge as the subject of the study. They used three different models, one for SAS bridge without structure interaction, one for SAS bridge with pile-soil-structure interaction and another for a ground-anchored suspension bridge (with same parameters) with pile-soil-structure interaction. From these models, several conclusions were drawn about the consequences of the abovementioned interaction. They concluded that pile-soil-structure interaction makes the structure of SAS bridge more flexible and, therefore reduces the first order frequency. Also, under the effect of seismic ground motion, this interaction increases significantly the longitudinal displacement, the axial force at the bottom of the tower and the moment at the main span of the stiffening girder for the SAS bridge. Nevertheless, the authors concluded that the vertical displacement and moment of the stiffening girder for the self-anchored is significantly less then for the ground-anchored suspension bridge, but the moment and longitudinal displacement at the top of main tower are significantly greater for the self-anchored bridge then the ground-anchored suspension bridge. They used a merging pile model of equivalent embedded fixation to simulate the interaction [17]. Mu et al (2009) studied a design for a self-anchored cable-stayed suspension bridge (Zhuanghe
bridge), by establishing a finite element model of the bridge and conducting its dynamic analysis. The main difficulty was to simulate the stiffness of main beam, tower, cable, pier and foundation of the bridge, as well as the boundary conditions. For the dynamic analysis, the input for the time-history analysis was an artificial seismic wave. Since it was a very flexible structure, the load-deformation relationship was nonlinear and the non-linearity becomes more relevant as we increase the span of the bridge. Besides the analysis of the seismic response of the bridge structural elements, they studied the impact of changes in structural parameters, more specifically changes in the restriction of the main beam. From this analysis, it was concluded that increasing the longitudinal restrains gradually decreases the bending moment at the bottom of the tower, as well as the displacement at the top of the tower and beam end. Nevertheless, this reduction is minor and so other measures can be tried to reduce earthquake impact on the Zhuanghe Bridge [18]. Jiang et al (2009) discussed the possible reduction of seismic response in self-anchored bridges, for instance between the tower and stiffening girder connection. Using time-history analysis, the pounding of the deck against the tower is studied for different case scenarios: different stiffness, free gap, damping coefficient of the device and different seismic waves. The frequency spectrum characteristics of the seismic wave alter significantly the pounding characteristics. Firstly, the authors discuss the most common measures to dissipate seismic energy, which are elastic restraint, pounding bearings and dampers between the girder and piers. Nevertheless, a SAS bridge works differently and devices are installed between the tower and girder in order to reduce the displacements/forces caused by a longitudinal seismic wave. For a more detailed study, the Chaoyang Huanghelu Bridge was used as the subject of study. For the modeling, beam elements were used for girder, pylons, piers and pile foundations, while the main cable and hangers were simulated as cable elements, including the influence of the initial internal stresses of the main cables in the main cable stiffness. The influence of the pounding among bridge members was studied and the following conclusion were drawn: i) for SAS bridge the girder-pylon effect can be favorable or unfavorable for the stress in the pylon. With the increase of the initial gap between elements, the seismic performance reduces and both the displacement of girder and moment in the tower rise. However, a small gap can also cause local damage; ii) viscous dampers consume large amounts of energy without causing extra static stiffness to the structure and its use reduces very much the moment and pounding force in the pylon significantly [19].
More recently in 2011, Nie et al researched on a new cable anchorage system for self-anchored suspension bridges with steel box girders, because an optimized design of the cable anchorage is very important for the rational design of the whole bridge. The main goal was the optimization of the mechanical behavior of the common cable deck anchorage systems. The studied composite anchorage, due to the composite effect between steel and concrete, reduced significantly the stress levels in the plates (around 40%). Also, the stresses were much more uniformly distributed. Both a finite element model (ANSYS) and a scale model testing were used to obtain these results. After discussing various types of anchorage: traditional concrete; looped concrete; pure steel; steel-concrete composite; the authors analyzed the advantages of the composite anchorage system. The most relevant advantages according to them were the reduction of stress levels on the steel plates and, consequently the thickness of the plates, improving the reliability of the steel plates welding and the reduction of the number of stiffeners and their thickness. Nevertheless, the authors state that this system still requires further studies in order to be accepted as a practical solution. For that reason, it was not used in the Qingdao bridge project. As far as the looped cable anchorage system is concerned, the authors state that it provides structural compactness and excellent seismic performance, but requires more strands and both the mechanical behavior and site construction of the prestressed cap beam become complex. The new San Francisco-Oakland SAS span is the only reference given by the authors as an existing example of this kind of system [20]. Most of the previous authors published another very recent paper
continuing the research on cable anchorage systems for SAS bridges (Nie et al, 2014). The Taohuayu Bridge (THY) the largest three-span double-tower SAS bridge is the case study. This paper focuses on a new multi-scale modeling method, in order to improve the reliability of conventional modeling methods. These traditional modeling methods are presented and their characteristics enumerated: Structural, Traditional scale and Full-scale (local and global). Although the full-scale method already reduces the influence of the fuzzy region and is very common, the authors decided to go further and model different parts of the structure in different appropriate scales. This resulted in accurate analysis for each part. This approach was made possible by adopting flexible boundary conditions (BC), which eliminates the influence of the fuzzy region and by validating results with a scale model test. The flexible BC’s are like generalized BC’s that represent the real loads, supports and calculates the comprehensive strain and stress distribution efficiently. Moreover, it was also concluded in this paper that the full-scale method is inefficient to model the entire bridge and that the structural method cannot analyze the stress distribution of the cable anchorage system. On the other hand, the scale model can complement and partially validate the multi-scale method and vice-versa [21].
Lianzhen and Tianliang (2012) studied the dynamic characteristics and seismic response of a self-anchored bridge across the Hunhe River in China. For that purpose, they used an artificial seismic wave for the ground motion input. Regarding the self-anchored suspension bridges in China, it is said that the first of this type was built in 2000 and that around year 2012 thirty self-anchored suspension bridges have been finished in China (See Annex A2.1.). The authors consider SAS bridges as self-balance structures, meaning that the girder has weaker boundary constrains, in order to satisfy longitudinal movement. This way, during a seismic event the girder will create longitudinal floating movement and the tower will bear huge horizontal earthquake forces. A SAP2000 model was created, using frame elements to model the girder and pylons and cable elements. In this model, for time-history analysis Rayleigh damping was used to model the damping of the structure. The following conclusions were drawn: for longitudinal seismic excitation, the longitudinal displacement of the tower is under control and its bottom section is critical since it has high bending moment (as expected); for transverse seismic excitation the lateral displacement of the tower is controlled and the bottom of the tower and midpoint of the main span are critical sections for bending moment; the vertical seismic excitation can not be ignored when considering the three directions of excitation, because it has an evident impact on the girder [22]. Furthermore, other scientific papers related to seismic analysis of SAS bridges were written. Among them, Qiu et al (2012) states that SAS system can save on construction costs and time incurred on the construction of the anchorage system. However, it also mentions that the feasibility of a self-anchored suspension bridge in a strong earthquake zone and the use of dampers to reduce seismic response have yet to be fully investigated. The authors used the Yellow River Road Bridge in Mainland as object of their study. A finite element model was created in ANSYS, using beam element for tower, piers, piles, main girders and cross beams, while the main cables and suspenders used truss elements. Springs were used to model the foundations. The seismic response of the bridge was obtained by a nonlinear time-history analysis, considering the geometric nonlinearity of the structure and the material nonlinearity of the tower. It becomes clear after running the model that the first mode of vibration is a longitudinal floating mode with longer period. This is typical of the SAS bridges, according to the authors. After performing seismic analysis it was concluded that the longitudinal displacements in the girder were excessive (0,5 to 0,6m depending on elastic or ductility analysis) and that it proved necessary to install metal dampers in the connections between the tower and the girder. The main conclusions were: for dynamic analysis the SAS bridge still has longer period of the first mode and concentration of vibration modes, which matches the ground-anchored suspension bridges characteristics; due to free movement of the main girder longitudinally, this represents the 1st vibration mode and results in too large longitudinal
![Fig. 3.4 – Self-anchored Bay Bridge span and Yerba Buena Island [Ref.: baybridgeinfo.org]](https://thumb-eu.123doks.com/thumbv2/123dok_br/19177986.944046/42.892.234.707.624.889/fig-self-anchored-bridge-yerba-buena-island-baybridgeinfo.webp)
![Fig. 3.5 – Entire East San Francisco-Oakland Bay Bridge structure and Self-anchored suspension span, respectively [Ref.: Caltrans drawings 418/1204]](https://thumb-eu.123doks.com/thumbv2/123dok_br/19177986.944046/43.892.148.782.188.691/francisco-oakland-structure-anchored-suspension-respectively-caltrans-drawings.webp)
![Fig. 3.14 –Plan view of dowels and anchor bolts on the tower base [Ref.: Caltrans].](https://thumb-eu.123doks.com/thumbv2/123dok_br/19177986.944046/48.892.238.682.653.1003/fig-plan-view-dowels-anchor-bolts-tower-caltrans.webp)
![Fig. 3.17 - East pier transverse elevation with pile cap, piers, cap beam, double deck and deck anchorage [Ref.: Caltrans]](https://thumb-eu.123doks.com/thumbv2/123dok_br/19177986.944046/50.892.192.735.188.581/fig-east-transverse-elevation-piers-double-anchorage-caltrans.webp)