Autopsy of over 11500 Injury Deaths in India
Marvin Hsiao1,2*, Shaun K. Morris1,3, Diego G. Bassani1,4,5, Ann L. Montgomery1, J. S. Thakur1,6, Prabhat Jha1,4
1Centre for Global Health Research, Li Ka Shing Knowledge Institute, St. Michael’s Hospital, University of Toronto, Toronto, Canada,2Department of Surgery, St. Michael’s Hospital, University of Toronto, Toronto, Canada,3Division of Infectious Diseases, Department of Pediatrics, Hospital for Sick Children, University of Toronto, Toronto, Canada,4Dalla Lana School of Public Health, University of Toronto, Toronto, Canada,5Child Health and Evaluative Sciences, Hospital for Sick Children, Toronto, Canada, 6Department of Community Medicine, Post Graduate Institute of Medical Education and Research (PGIMER), Chandigarh, India
Abstract
Introduction:Worldwide, injuries account for 9.8% of all deaths. The majority of these deaths occur in low- and middle-income countries where vital registration systems are often inadequate. Verbal autopsy (VA) is a tool used to ascertain cause of death in such settings. Validation studies for VA using hospital diagnosed causes of death as comparisons have shown that injury deaths can be reliably diagnosed by VA. However, no study has assessed the factors that may affect physicians’ abilities to code specific causes of injury death using VA.
Method/Principal Findings:This study used data from over 11 500 verbal autopsies of injury deaths from the Million Death Study (MDS) in which 6.3 million people in India were monitored from 2001–2003 for vital events. Deaths that occurred in the MDS were coded by two independent physicians. This study focused on whether physician agreement on the classification of injury deaths was affected by characteristics of the deceased and respondent. Agreement was analyzed using three primary methods: 1) kappa statistic; 2) sensitivity and specificity analysis using the final VA diagnosed category of injury death as gold standard; and 3) multivariate logistic regression using a conceptual hierarchical model. The overall agreement for all injury deaths was 77.9% with a kappa of 0.74 (99% CI 0.74–0.75). Deaths in the injury categories of ‘‘transport’’, ‘‘falls’’, ‘‘drowning’’ and ‘‘other unintentional injury’’ occurring outside the home were associated with greater physician agreement than those occurring at home. In contrast, self-inflicted injury deaths that occurred outside the home were associated with lower physician agreement.
Conclusions/Significance:With few exceptions, most characteristics of the deceased and the respondent did not influence physician agreement on the classification of injury deaths. Physician training and continued adaptation of the VA tool should focus on the reasons these factors influenced physician agreement.
Citation:Hsiao M, Morris SK, Bassani DG, Montgomery AL, Thakur JS, et al. (2012) Factors Associated with Physician Agreement on Verbal Autopsy of over 11500 Injury Deaths in India. PLoS ONE 7(1): e30336. doi:10.1371/journal.pone.0030336
Editor:Thomas Behrens, University of Bochum, Germany
ReceivedAugust 30, 2011;AcceptedDecember 14, 2011;PublishedJanuary 17, 2012
Copyright:ß2012 Hsiao et al. This is an open-access article distributed under the terms of the Creative Commons Attribution License, which permits unrestricted use, distribution, and reproduction in any medium, provided the original author and source are credited.
Funding:The authors have no support or funding to report.
Competing Interests:The authors have declared that no competing interests exist. * E-mail: marvin.my.hsiao@gmail.com
Introduction
Worldwide, injuries account for about 10% of all deaths and about 12% of the total burden of diseases measured in disability-adjusted life years [1]. The majority of these injuries occur in low and middle-income countries [1]. In such settings with limited resources, deaths often occur outside the formal healthcare system and are not recorded in the country’s vital registration system. The lack of accurate vital statistical data hampers public health action, policy making, and the implementation of evidence-based interventions.
Verbal autopsy (VA) is a cost-effective tool for ascertaining cause of death in low-resource settings with incomplete vital registration [2]. The VA relies on the assumption that each cause of death has a unique set of signs and symptoms that can be used to distinguish between different causes of death. The VA also assumes that the signs and symptoms leading up to a death can be
accurately reported by the deceased’s family or acquaintances during a standardized interview.
Various methodologies exist to determine a cause of death based on the signs and symptoms collected on the VA questionnaire [3]. These include data- or expert-derived algo-rithms [4], symptom pattern methodology [5], and probabilistic models [6,7]. Another common methodology utilizes two or more trained physicians to review the VA form to determine a cause of death [2].
Studies using VA with physician coders have been externally validated by comparing the VA cause of death to hospital-based registries or death certificates [8–13]. However, in low-resource settings, this method of validation may be biased because people with access to healthcare facilities, death certificates, or death registration are often not representative of the entire population.
[11,12,14]. However, no study has assessed the factors that may influence the ability of physicians to distinguish between different injuries using VA. We used physician agreement as a metric in our studies to measure the performance characteristics of VA. Although no inference can be made on accuracy or external validity, higher physician agreement should be correlated with better reliability of VA assigned cause of death. We previously reported that younger age and female gender were associated with lower agreement between physicians on the cause of childhood deaths in India [15]. The purpose of our current study is to investigate whether characteristics of the respondent and deceased are associated with physician agreement on the classification of injury deaths.
Methods
This study uses data from the Million Death Study (MDS); the methodology of the MDS is published in detail elsewhere [2]. In brief, the MDS monitored the vital statistics of 6.3 million people in 1.1 million nationally representative households in India from 2001–2003. A total of 6671 sampling units, each with an average of 150 households, were selected by stratified random sampling based on urban or rural setting, village or city population size, and female literacy rate according to the 1991 national census. For every death occurring in these households, a verbal autopsy (VA) questionnaire called RHIME (Routine, Reliable, Repre-sentative and Re-sampled Household Investigation of Mortality with Medical Evaluation; available at http://www.cghr.org/ index.php/training/verbal-autopsy-forms-2/) was completed by a trained fieldworker based on a structured interview with a family member or close acquaintance of the deceased. RHIME includes both preset close-ended questions and an open-ended narrative. Each completed VA questionnaire was independently reviewed by two physicians trained to use the VA questionnaire to determine cause of death in World Health Organization International Classification of Disease 10 (ICD-10) code [16]. The physicians also provided a set of keywords that were important in determining the cause of death. If the two physicians initially agreed on the same cause of death, the corresponding ICD-10 code was assigned as the final cause of death. If the two physicians initially disagreed, they were required to anonymously reconcile by exchanging ICD-10 codes
and keywords. If they agreed in this second reconciliation stage, the final cause of death was assigned. However, if there was still disagreement after the reconciliation stage, a third, senior physician adjudicated and assigned the final cause of death based on the VA questionnaire along with the ICD-10 codes and keywords provided by the first two physicians. A web-based system managed the coding process with more than 130,000 deaths coded by 130 physicians.
We used MDS data from 2001–2003 for this study. All deaths due to injury were grouped into 9 broad categories: transport injuries; falls; fire; drowning; venomous snakes, animals and plants; poisonings and other unintentional injuries; self-inflicted injuries; war, violence and other intentional injuries; and injuries of undetermined intent. The ICD-10 codes of these 9 injury categories are listed in Table 1, along with the number of deaths in each category stratified by age groups: children (#14 years), adults(15 to 69 years), and elderly ($70 years). For this study, physician agreement was defined as agreement of the first ICD-10 codes from the two physicians (i.e. the same injury category for both physicians at the first coding stage prior to the second reconciliation stage). The extent of agreement between two physicians beyond chance was assessed using the kappa statistic [17]. The 99% confidence interval for the kappa statistic was calculated using the bootstrap method for polychotomous variables with bias correction [18]. The Landis and Koch classification of inter-rater reliability was used to interpret the kappa statistic:#0.4 – poor to fair agreement; .0.4 to#0.6 – moderate agreement; .0.6 to #0.8 – substantial agreement;
.0.8 – high agreement [17]. Analysis was conducted on the entire dataset and also stratified by age. Sensitivity and specificity of each physician’s initial cause of death diagnosis was performed using the final RHIME cause of death diagnosis as the gold standard. This analysis should only be interpreted with the understanding that the gold standard (final cause of death diagnosis) was not independent of the test itself (initial physician cause of death diagnosis). The methodology used in this study to assess physician agreement and factors affecting agreement has been described in detail previously [15].
We used a multivariate logistic regression model to study the association between physician agreement and the geographic, socioeconomic, demographic, and other characteristics of the
Table 1.Injury death category ICD-10 codes and numbers by age groups.
Injury Category ICD-10 Codes Number of Deaths
Children Adults Elderly
(#14 years) (15–69 years) ($70 years)
Transport Injuries V01-V99,Y85 239 1948 185
Falls W00-W19 202 824 986
Fire X00-X09 59 278 36
Drowning W65-W74 456 406 42
Venomous Snakes, Animals and Plants X20-X29,W57,W60 208 395 40
Other Unintentional Injuries X40-X44,X46-X49, W20-W56,W58-W59,W64,W75-W99, X10-X19,X30-X39,X50-X52,X57-X59,Y40-Y84,Y86,Y88-Y89
323 1064 324
Self-Inflicted Injuries X60-X84 53 2585 102
War, Violence and Other Intentional Injuries
X85-Y09,Y35-Y36,Y87 45 549 26
Injuries of Undetermined Intent Y10-Y14,Y16-Y34,Y96-Y98 17 127 13
deceased and the respondent. The model was constructed using an a priori hierarchical conceptual framework that grouped variables into three blocks: distal, middle, and proximal [19]. The distal block included geographic factors (Empowered Action Group region including Assam (EAGA), geographic region, and urban or rural setting). The middle block included socio-demographic factors of the respondent (whether the respondent lived with the deceased, respondent’s gender, education, religion, language, and relation to the deceased). The proximal block included characteristics of the deceased (deceased’s gender, education, location of death, and whether the death was registered). Variable selection was conducted using backward elimination. A variable was retained in the final model if its likelihood ratio test resulted in p-value lower than 0.20. Respondents’ education was predefined to remain in the final model regardless of p-value from the likelihood ratio test because of its expected influence on the quality of VA questionnaire. The final model for adults was also adjusted for the deceased’s age as a continuous variable given the finding that increasing age was correlated linearly with lower physician agreement between injury death categories. Adjustment for age was not necessary in the children and elderly groups because the correlation between age and physician agreement within the group was not found to be significant. A factor was considered to be significantly associated with physician agreement if the likelihood ratio test resulted in p,0.05. All statistical analysis was performed using Stata SE version 10.0 [20].
Ethics approval for the MDS was obtained from the Postgraduate Institute of Medical Education and Research, Chandigarh, India and St. Michael’s Hospital, Toronto, Ontario, Canada. Enrollment in the MDS was on a voluntary basis and the study posed no or minimal risks to enrolled subjects. Families were free to withdraw from the study. Verbal consent was obtained. All personal identifiers present in the raw data are anonymized before analysis. MDS data storage and usage protocols were described in detail elsewhere [2].
Results
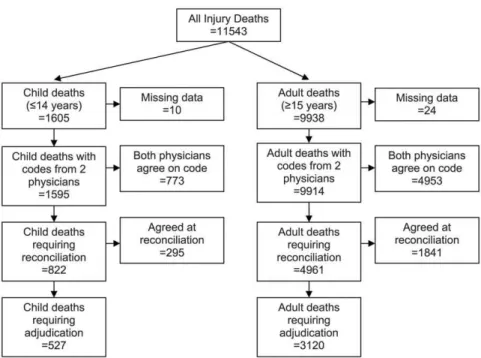
There were 11 543 injury deaths in the MDS from 2001–2003. Of these, 11 509 deaths (99.7%) were coded by two physicians and were included in this study. The process of determining the final cause of death is shown in Figure 1.
The summary of the kappa statistic analysis, stratified by age group, is shown in Table 2. For all age groups, non-overlapping 99% confidence intervals between one or more sub-categories of a predictor variable suggest statistical significance and require multivariate logistic regression modeling to rule out confounding effects. The overall agreement for all injury deaths was 77.9% with a kappa of 0.74 (99% CI 0.74–0.75). For children (#14 years), there was 84.1% agreement and a kappa of 0.81 (99% CI 0.79– 0.82). In this group, the 99% confidence intervals for kappa did not overlap between one or more sub-categories of the following variables: whether the respondent lived with the deceased, religion, language, deceased’s gender, deceased’s education, location of death, and whether the death was registered. For adults (15–69 years), there was 80.9% agreement overall and a kappa of 0.77 (99% CI 0.76–0.78). In this group, the 99% confidence intervals for kappa of all the variables did not overlap, except for respondent education and death registration. For the elderly ($70 years), there was 58.2% agreement overall and a kappa of 0.44 (99% CI 0.40–0.45). In this age group, the variables where the 99% confidence interval for kappa did not overlap were whether the respondent lived with the deceased, respondent education, respondent relationship to the deceased, religion, language, deceased gender, location of death, and EAGA.
The sensitivity and specificity of the initial physician coded cause of death was calculated using the final cause of death as gold standard (Table 3). There were 3 200 child, 16 346 adult, and 3 506 elderly initial physician coded cause of death (two codes per death). Excluding injuries of undetermined intent, the sensitivity of initial physician coding for all injury categories was above 82.0% in children, above 81.3% in adults, and above 72.7% in the elderly. Sensitivity for injuries of undetermined intent was the
Figure 1. Flow diagram of Million Death Study injury deaths.
lowest in all three age groups – 61.8% in children, 59.7% in adults, and 53.8% in the elderly. The specificity of initial physician coding for all age groups was greater than 98.3% for all injury causes.
The results of the multivariate logistic regression on factors influencing physician agreement are summarized in Table 4. For adults, physicians were more likely to agree on the classification of injury deaths if deaths occurred at a health facility (OR 1.19, 95% CI 1.01–1.39) and at a location outside of home or health facility (OR 1.50, 95% CI 1.30–1.73) compared to deaths at home. We postulated that injury deaths that are more likely to occur outside of home or health facility, such as transport injuries and drowning, may be easier to classify and would therefore have greater physician agreement. When we stratified the analysis by injury
category, death location outside of home was associated with greater physician agreement only for deaths due to transport injury, drowning, and other unintentional injury (Table 5). In adult transport injury deaths, the odds ratio for physician agreement was 5.41 (95% CI 3.18–9.22) for deaths occurring at a health facility and 5.06 (95% CI 3.23–7.92) for deaths at a location outside of home or health facility. For both drowning and other unintentional injury deaths among adults, physician agreement was greater only for deaths that occurred at a location outside of the home or health facility (drowning - OR 2.07, 95% CI 1.08–3.99; other unintentional injury - OR 1.76, 95% CI 1.21–2.56) compared to deaths that occurred at home. In this age group, there was lower physician agreement for deaths due to
Table 2.Kappa statistic analysis of physician agreement for injury deaths by age group.
Children (#14 years) Adults (15–69 years) Elderly ($70 years)
Variable Sub-Categories n % Agree Kappa 99% CI n % Agree Kappa 99% CI n % Agree Kappa 99% CI
Overall 1595 84.1 0.81 0.79–0.82 8162 80.9 0.77 0.76–0.78 1752 58.2 0.44 0.40–0.45
Live with Status Yes 1081 82.6 0.79 0.79–0.81* 4666 78.7 0.74 0.74–0.75* 1290 56.5 0.40 0.36–0.40* No 371 86.5 0.83 0.83–0.86* 2911 84.1 0.80 0.79–0.81* 349 61.0 0.51 0.50–0.53* Respondent Gender Male 894 83.8 0.81 0.79–0.84 4241 80.2 0.76 0.75–0.76* 950 58.4 0.44 0.41–0.45
Female 665 84.5 0.81 0.80–0.82 3832 81.5 0.77 0.76–0.78* 788 57.7 0.43 0.41–0.47 Respondent Education Less than Primary 908 83.5 0.80 0.78–0.82 3912 80.5 0.77 0.75–0.78 737 59.7 0.47 0.44–0.53*
Primary 191 85.3 0.82 0.77–0.84 982 79.8 0.75 0.73–0.77 214 57.0 0.44 0.41–0.52*
.Primary 466 84.6 0.82 0.80–0.83 3074 81.3 0.77 0.76–0.78 766 56.9 0.39 0.36–0.41* Respondent
Relationship
Related 1457 84.4 0.81 0.80–0.82 7346 80.6 0.77 0.76–0.77* 1603 57.4 0.42 0.40–0.45*
Unrelated 95 85.3 0.82 0.80–0.85 699 83.6 0.79 0.77–0.79* 132 67.4 0.58 0.48–0.64* Religion Hindu 1271 84.1 0.81 0.80–0.82* 6786 81.2 0.77 0.76–0.78* 1427 58.7 0.44 0.44–0.47* Muslim 237 83.1 0.79 0.77–0.80* 675 80.4 0.77 0.73–0.80* 152 50.7 0.31 0.22–0.40* Other 83 86.8 0.84 0.78–0.90* 678 78.2 0.73 0.71–0.76* 166 59.6 0.46 0.39–0.52* Language Hindi 863 82.0 0.79 0.76–0.79* 2979 76.2 0.72 0.71–0.73* 646 54.3 0.37 0.33–0.39* English 68 95.6 0.95 0.90–0.98* 649 82.3 0.78 0.77–0.81* 98 67.4 0.58 0.53–0.70* Other 674 85.8 0.83 0.82–0.84* 4534 83.8 0.80 0.79–0.80* 1008 59.7 0.46 0.42–0.78* Deceased Gender Male 916 86.0 0.83 0.82–0.88* 5637 81.1 0.77 0.77–0.78* 901 59.4 0.48 0.47–0.50* Female 679 81.6 0.78 0.77–0.80* 2524 80.4 0.75 0.75–0.76* 851 56.9 0.38 0.37–0.40*
Deceased Education Age-Appropriate 1337 84.7 0.82 0.81–0.82* - - -
-Below Age-Appropriate
201 89.1 0.87 0.85–0.91* - - -
-Less than Primary - - - - 3964 78.6 0.75 0.74–0.75* 1437 57.8 0.43 0.41–0.45
Primary - - - - 1099 82.0 0.78 0.77–0.78* 133 60.2 0.48 0.40–0.52
.Primary - - - - 2968 83.4 0.79 0.78–0.81* 156 58.3 0.42 0.39–0.50
Death Place Home 685 80.7 0.77 0.76–0.78* 3188 77.2 0.70 0.70–0.72* 1348 53.0 0.33 0.31–0.35* Health Facility 248 81.1 0.78 0.76–0.81* 1652 80.8 0.77 0.76–0.77* 167 73.7 0.66 0.58–0.66* Other 578 89.6 0.86 0.84–0.87* 3041 84.9 0.81 0.80–0.81* 184 79.4 0.75 0.71–0.79* Death Registration Yes 401 86.8 0.84 0.82–0.85* 3409 81.3 0.77 0.76–0.79 693 56.1 0.39 0.36–0.40
No 595 81.9 0.78 0.77–0.80* 1641 80.0 0.76 0.74–0.78 411 53.5 0.39 0.35–0.45 Rural/Urban Rural 1429 84.3 0.81 0.79–0.82 6751 81.3 0.77 0.77–0.77* 1403 58.5 0.45 0.43–0.46 Urban 166 82.5 0.79 0.69–0.86 1411 79.2 0.74 0.72–0.75* 349 56.7 0.37 0.31–0.46 EAG+Assam
vs Non-EAG
EAGA 858 81.7 0.78 0.78–0.82 2840 77.5 0.74 0.73–0.75* 626 52.1 0.36 0.33–0.40*
Non-EAGA 737 87.0 0.84 0.81–0.86 5322 82.7 0.78 0.78–0.79* 1126 61.6 0.48 0.45–0.52*
Footnote: * indicates that the 99% confidence intervals do not overlap between one or more sub categories of the variable. EAGA = Empowered Action Group including Assam.
self-inflicted injury that occurred at locations outside of the home or health facility (OR 0.60; 95% CI 0.44–0.81) compared to self-inflicted deaths at home.
Also for adults, physicians were more likely to agree on the classification of injury deaths if the respondent did not live with the deceased (OR 1.33; 95% CI 1.18–1.51) compared to those who did live with the deceased. This association was similar in all injury categories (data not shown).
For the elderly, physician agreement was greater for deaths that occurred outside the home, whether at a health facility (OR 2.31, 95% CI 1.58–3.36) or at a location other than the home or health facility (OR 3.28, 95% CI 2.22–4.83). When stratified by injury category, greater physician agreement for elderly deaths that occurred outside the home was apparent only for transport injury,
fall, and other unintentional injury deaths (Table 5). In transport injury deaths, physicians were more likely to agree for deaths that occurred at a health facility (OR 4.92, 95% CI 1.55–15.69) and at a location outside of the home or health facility (OR 4.18, 95% CI 1.51–11.58) compared to deaths that occurred at the home. Similarly in elderly deaths due to falls, physicians were more likely to agree for deaths that occurred at a health facility (OR 3.12, 95% CI 1.73–5.63) and at a location outside of the home or health facility (OR 2.42, 95% CI 1.13–5.15) compared to at the home. For other unintentional injury deaths in this age group, physician agreement was greater only for deaths that occurred outside of the home or health facility (OR 5.96, 95% CI 1.90–18.69) compared to at the home. Physicians were also more likely to agree on cause of deaths among the elderly if the respondent was a neighbor
Table 3.Sensitivity and specificity of initial physician coded cause of death versus final RHIME cause.
Age Category Cause of Death Category n Sensitivity (99% CI) Specificity (99% CI)
Children Specific Causes
#14 years Drownings 911 96.8 (95.0–98.1) 99.1 (98.5–99.5)
Transport Injuries 478 96.2 (93.4–98.1) 99.9 (99.5–100)
Venomous Snakes, Animals, Plants 416 94.0 (90.3–96.6) 99.9 (99.5–100)
Falls 403 89.1 (84.5–92.7) 99.1 (98.5–99.5)
Fires 118 90.7 (81.6–96.2) 99.9 (99.6–100)
Self-inflicted Injuries 106 89.6 (79.7–95.8) 99.6 (99.3–99.9)
Non-Specific Causes
Other Unintentional Injuries 645 82.5 (78.3–86.2) 98.4 (97.6–99.0)
War, Violence, and Other Intentional Injuries 89 82.0 (69.4–91.1) 99.8 (99.5–100)
Injuries of Undetermined Intent 34 61.8 (38.5–81.7) 99.3 (98.9–99.6)
Total 3200
Adults Specific Causes
15–69 years Self-inflicted Injuries 5169 92.9 (92.0–93.8) 99.5 (99.2–99.6)
Transport Injuries 3895 94.9 (93.9–95.8) 99.5 (99.3–99.6)
Falls 1648 82.0 (79.5–84.4) 99.2 (99.0–99.4)
Drowning 812 90.1 (87.2–92.7) 99.7 (99.5–99.8)
Venomous Snakes, Animals, Plants 790 93.3 (90.7–95.4) 99.9 (99.9–100)
Fire 555 89.2 (85.4–92.3) 99.6 (99.5–99.7)
Non-Specific Causes
Other Unintentional Injuries 2127 81.3 (79.1–83.5) 98.3 (98.1–98.6)
War, Violence, and Other Intentional Injuries 1097 87.4 (84.6–89.9) 99.5 (99.3–99.6)
Injuries of Undetermined Intent 253 59.7 (51.4–67.6) 99.1 (98.9–99.3)
Total 16346
Elderly Specific Causes
$70 years Falls 1971 75.3 (72.7–77.8) 98.5 (97.5–99.2)
Transport Injuries 370 88.4 (83.4–92.3) 99.8 (99.5–99.9)
Self-inflicted Injuries 204 94.6 (89.2–97.9) 99.9 (99.7–100)
Drowning 84 83.3 (70.5–92.3) 100 (99.8–100)
Venomous Snakes, Animals, Plants 80 86.3 (73.6–94.4) 99.9 (99.6–100)
Fire 71 81.7 (67.2–91.8) 99.9 (99.6–100)
Non-Specific Causes
Other Unintentional Injuries 648 72.7 (67.9–77.1) 97.9 (97.1–98.6)
War, Violence, and Other Intentional Injuries 52 76.9 (58.9–89.9) 99.6 (99.3–99.8)
Injuries of Undetermined Intent 26 53.8 (28.1–78.2) 99.8 (99.6–100)
Total 3506
rather than a relative (OR 1.52, 95% CI 1.03–2.23). This association was similar among all injury categories.
For children, the only variable significantly associated with physician agreement was the location of death. Physician agreement was more common for deaths that occurred outside of the home or health facility (OR 2.18, 95% CI 1.40–3.40), regardless of the injury category.
Discussion
The purpose of this analysis was to assess factors that may influence physicians’ ability to correctly classify injury deaths based on VA questionnaires. We used physician agreement as the metric in our analysis under the assumption that poor agreement is correlated with difficulty in classifying injury deaths. Several validation studies have shown that VA tools perform well for injury deaths as one broad category with high sensitivity, specificity, and positive predictive value when compared to
hospital records and death certificates [11,12,14]. However, to the best of our knowledge, no studies have assessed the factors that influence physician’s ability to further classify injury deaths into specific categories using VA. From a public health injury prevention perspective, differentiating between injury categories is essential to priority setting and formulating targeted interven-tions. Using kappa statistic, sensitivity and specificity analysis, and multivariate logistic regression, this study specifically assessed factors that may influence physician agreement in injury deaths.
Using childhood deaths (age#14) of all causes, we previously reported that physician agreement was not affected by features of the death itself or by most geographic, socioeconomic, or demographic characteristics of the respondent and/or deceased. The exceptions were with the gender and age of the deceased [15]. This study of adult and child injury deaths also suggests that, with few exceptions, physician agreement on category of injury death was not affected by these factors. Specifically, we did not find consistent significant differences in physician agreement based on
Table 4.Multivariate logistic regression analysis of variables affecting physician agreement by age category.
Children (#14 years) Adults (15–69 years) Elderly ($70 years)
Variable Sub-Categories n OR (95% CI) p n OR (95% CI) p n OR (95% CI) p
Live with Yes 1089 1.00 0.1073 4676 1.00 0.0000 1290 1.00 0.7086
No 372 1.32 (0.94–1.85) 2922 1.33 (1.18–1.51) 350 1.05 (0.80–1.39)
Respondent Gender Male 900 1.00 0.9581 4254 1.00 0.3577 952 1.00 0.2137
Female 669 1.01 (0.74–1.37) 3841 1.06 (0.94–1.20) 788 0.88 (0.71–1.08) Respondent Education Less than Primary 914 1.00 0.9796 3926 1.00 0.2256 738 1.00 0.1191
Primary 191 0.99 (0.62–1.58) 983 0.90 (0.75–1.08) 214 0.77 (0.56–1.06)
.Primary 495 0.96 (0.58–1.58) 3222 1.06 (0.93–1.20) 794 0.82 (0.66–1.02) Respondent
Relationship
Parent 895 1.00 0.2454 - - -
-Other Relative 571 1.28 (0.93–1.76) - - -
-Neighbour 96 0.89 (0.47–1.70) - - -
-Relative - - - - 7366 1.00 0.6258 1604 1.00 0.0312
Neighbour - - - - 701 1.06 (0.84–1.34) 132 1.52 (1.03–2.23)
Religion Hindu 1280 1.00 0.7238 6804 1.00 0.3863 1429 1.00 0.1411
Muslim 237 0.93 (0.62–1.40) 678 1.00 (0.81–1.23) 152 0.70 (0.49–1.00)
Other 84 1.30 (0.59–2.88) 679 0.86 (0.69–1.07) 166 0.93 (0.65–1.32)
Language Hindi 863 1.00 0.0899 3001 1.00 0.1040 648 1.00 0.8252
English 68 3.46 (0.98–12.2) 649 1.03 (0.77–1.37) 98 0.92 (0.51–1.66) Other 674 1.27 (0.76–2.12) 4534 1.21 (0.98–1.48) 1008 0.88 (0.59–1.32)
Deceased Gender Male 924 1.00 0.4518 5654 1.00 0.8721 903 1.00 0.7541
Female 681 0.87 (0.61–1.25) 2529 1.01 (0.88–1.16) 851 0.96 (0.74–1.24)
Deceased Education Age-appropriate 1346 1.00 0.8820 - - -
-Below Age-appropriate 201 1.05 (0.57–1.92) - - -
-Less than Primary - - - - 3976 1.00 0.4979 1438 1.00 0.9613
Primary - - - - 1100 1.00 (0.83–1.22) 133 0.94 (0.58–1.51)
.Primary - - - - 2975 1.09 (0.94–1.27) 157 0.97 (0.60–1.57)
Death Place Home 692 1.00 0.0009 3195 1.00 0.0000 1350 1.00 0.0000
Health Facility 250 0.98 (0.59–1.61) 1654 1.19 (1.01–1.39) 167 2.31 (1.58–3.36) Other 579 2.18 (1.40–3.40) 3053 1.50 (1.30–1.73) 184 3.28 (2.22–4.83)
Death Registration No 595 1.00 0.1859 1650 1.00 0.7483 411 1.00 0.5202
Yes 401 1.39 (0.85–2.28) 3419 0.97 (0.80–1.18) 695 0.90 (0.64–1.25)
geographic factors, respondents’ gender, education, religion, language, or on the gender, education, and death registration of the deceased. The similar level of agreement across all these variables is reassuring to all VA based studies.
Injury deaths are prevalent in the elderly population in India (manuscript in preparation). While the ability of VA to yield a broad classification of the underlying cause of death diminishes for deaths that occur over age 70 [2], we have shown that, even in the elderly population, VA performed reasonably well in distinguish-ing between different injury categories.
Location of Death
For adult and elderly deaths in the categories of transport injury, other unintentional injury, fall (elderly only), and drowning (adults only), the likelihood of physician agreement increased if the location of death was outside of home. This association suggests that location of death provides an important clue for physicians in determining the cause of death for these four injury categories. One hypothesis is that for these categories, deaths occurring outside of home may be due to injuries of higher severity and acuity, resulting in a more immediate death that may be easier to classify. On the contrary, deaths occurring at home may have
longer time lag between injury and death (for example, an elderly person becomes injured in a fall or car accident, undergoes treatment in hospital for several months, is eventually discharged and dies at home shortly after). When there is a longer lag time and opportunity for more intervening events between initial injury and death, as we hypothesize for injury deaths at home, physicians may have more difficulty determining cause of death. In contrast to these four categories, however, deaths due to self-inflicted injury were associated with lower physician agreement if the death occurred outside of home or health facility. One possible explanation for this finding is that the circumstances around a self-inflicted injury death is likely not as well known or reported by the respondent if the death occurred outside of home or health facility. On the other hand, detailed information on self-inflicted deaths may be more available if the death occurred at home or at health facilities. Additional studies exploring the open-ended narrative section of the VA may provide support for these hypotheses and generate additional explanations for the associa-tion between locaassocia-tion of death and physician agreement.
In children, the association between increased physician agreement and death outside of home or health facility was also present. However, due to the smaller sample size we were unable
Table 5.Place of death analysis of physician agreement stratified by injury category.
Adults (15–69 years) Elderly ($70 years)
Injury Category Place of Death n OR (95% CI) n OR (95% CI)
Transport Injuries Home 208 1 77 1
Health Facility 452 5.41* (3.18–9.22) 43 4.92* (1.55–15.69)
Other 1231 5.06* (3.23–7.92) 59 4.18* (1.51–11.58)
Falls Home 490 1 852 1
Health Facility 155 1.20 (0.77–1.86) 72 3.12* (1.73–5.63)
Other 151 1.49 (0.90–2.46) 36 2.42* (1.13–5.15)
Fire Home 96 1 24 1
Health Facility 137 1.39 (0.65–2.97) 7 -
-Other 39 1.29 (0.46–3.56) 4 -
-Drowning Home 104 1 17 1
Health Facility 15 3.74 (0.71–19.8) 0 -
-Other 266 2.07* (1.08–3.99) 24 -
-Venomous Snakes, Animals and Plants Home 196 1 30 1
Health Facility 91 1.43 (0.57–3.56) 7 -
-Other 100 0.99 (0.44–2.22) 2 -
-Other Unintentional Injuries Home 483 1 260 1
Health Facility 213 0.79 (0.55–1.14) 25 0.58 (0.21–1.55)
Other 333 1.76* (1.21–2.56) 28 5.96* (1.90–18.69)
Self-Inflicted Injuries Home 1440 1 61 1
Health Facility 491 0.75 (0.53–1.05) 11 -
-Other 581 0.60* (0.44–0.81) 24 -
-War, Violence and Other Intentional Injuries Home 135 1 19 1
Health Facility 72 0.66 (0.32–1.35) 1 -
-Other 301 1.02 (0.59–1.77) 6 -
-Injuries of Undetermined Intent Home 43 1 10 1
Health Facility 28 1.65 (0.34–8.00) 1 -
-Other 51 1.61 (0.43–6.08) 1 -
to identify associations with particular injury categories. We believe that the association in children may be explained by the same rationale as adults, but the association will need to be assessed with a larger sample.
Whether Respondent Lived with Deceased & Respondent Relationship
For adult deaths, physicians were more likely to agree on the classification of injury deaths if the respondent did not live with the deceased. Similarly for elderly deaths, physicians were more likely to agree if the respondent was a neighbour rather than a relative. We believe that this association may be reflective of the less detailed narratives given by the respondents who did not live with the deceased. For injury deaths, paradoxically, physicians may find narratives with fewer details easier to determine the cause of death. The less detailed narratives often comprise of only a few key words indicative of the cause of death such as ‘‘traffic accident’’ or ‘‘fall’’. Detailed narratives, however, may describe multiple events during a longer intervening time gap between injury and death that, as hypothesized above for deaths occurring at home, may make determining cause of death more difficult.
Limitations
Although we were able to assess the association between physician agreement and various characteristics of the respondent and deceased, we did not analyze the impact of factors related to the trained physician coders. Our analysis was performed under the assumption that the clinical experience, knowledge, medical specialty, and other factors that may affect the physician’s ability to determine the cause of death based on VA were uniform among all physician coders. This assumption was likely not true. Nevertheless, we believe it is unlikely that this limitation would have led to a systematic bias in the results as the deaths were randomly assigned to the physician coders. Future studies should be performed to assess physician characteristics that affect their ability to determine cause of death using a VA instrument.
The sensitivity and specificity analysis of the cause of death determined in the first stage by physicians must be interpreted with the understanding that the gold standard used (RHIME-determined cause of death) was not independent from the initial physician assigned cause of death. Nonetheless, this analysis uncovered that physicians have more difficulty arriving at a diagnosis for deaths caused by injury of undetermined intent. Further interviewer and physician training to improve both the
gathering and identification of details to arrive at a more specific category of injury death may help improve the VA tool.
The degree of physician agreement is contingent on the number of injury categories used in the analysis. Fewer categories would result in higher physician agreement and vice versa. We decided on the 9 injury categories based on a public health injury prevention perspective. Ideally, VA should be able to distinguish between injury categories such that the final output can be informative for public health priority setting, strategic planning, and disease monitoring. A limitation to our categorization is that no inference can be made on physician ability to diagnose specific causes of injury death within each injury category. Using transport injury deaths as example, the study cannot comment on whether VA is specific enough to determine the deceased’s mode of transportation and the mechanism of collision (i.e. three character ICD-10 ‘‘V’’ codes). This limitation is even more important for the more heterogeneous injury categories of ‘‘other unintentional injuries’’ and ‘‘injuries of undetermined intent’’.
In summary, physician agreement on the injury category cause of death was not affected by most characteristics of the deceased or respondent, with the exceptions of location of death, respondent relationship, and whether the respondent lived with the deceased. Specifically, for transport injury, fall, drowning, and other unintentional injury deaths, the location of death outside of the home was associated with greater physician agreement. In contrast, self-inflicted injury deaths that occurred outside of the home were associated with lower physician agreement. In addition, physicians were more likely to be in agreement if the respondent did not live with the deceased or if the respondent was a neighbour instead of a relative. Recognition of these factors that influence the physician’s ability to determine cause of injury death is essential for continued adaptation and improvement of the VA tool.
Acknowledgments
We thank Brendon Pezzack for help with graphics and Ansely Wong for editing support.
Author Contributions
Conceived and designed the experiments: MH SKM DGB ALM JST PJ. Performed the experiments: MH SKM DGB. Analyzed the data: MH SKM DGB ALM JST PJ. Contributed reagents/materials/analysis tools: MH SKM DGB ALM JST PJ. Wrote the paper: MH SKM DGB ALM JST PJ.
References
1. World Health Organization, editor (2008) The global burden of disease: 2004 update.
2. Jha P, Gajalakshmi V, Gupta PC, Kumar R, Mony P, et al. (2006) Prospective study of one million deaths in India: Rationale, design, and validation results. PLoS Med 3(2): e18.
3. Soleman N, Chandramohan D, Shibuya K (2006) Verbal autopsy: Current practices and challenges. Bull World Health Organ 84(3): 239–245. 4. Quigley MA, Chandramohan D, Rodrigues LC (1999) Diagnostic accuracy of
physician review, expert algorithms and data-derived algorithms in adult verbal autopsies. Int J Epidemiol 28(6): 1081–1087.
5. Murray CJ, Lopez AD, Feehan DM, Peter ST, Yang G (2007) Validation of the symptom pattern method for analyzing verbal autopsy data. PLoS Med 4(11): e327.
6. Byass P, Huong DL, Minh HV (2003) A probabilistic approach to interpreting verbal autopsies: Methodology and preliminary validation in Vietnam. Scand J Public Health Suppl 62: 32–37.
7. Byass P, Fottrell E, Dao LH, Berhane Y, Corrah T, et al. (2006) Refining a probabilistic model for interpreting verbal autopsy data. Scand J Public Health 34(1): 26–31.
8. Gajalakshmi V, Peto R (2004) Verbal autopsy of 80,000 adult deaths in Tamilnadu, south India. BMC Public Health 4: 47.
9. Gajalakshmi V, Peto R, Kanaka S, Balasubramanian S (2002) Verbal autopsy of 48 000 adult deaths attributable to medical causes in Chennai (formerly Madras), India. BMC Public Health 2: 7.
10. Kahn K, Tollman SM, Garenne M, Gear JS (2000) Validation and application of verbal autopsies in a rural area of South Africa. Trop Med Int Health 5(11): 824–831. 11. Khademi H, Etemadi A, Kamangar F, Nouraie M, Shakeri R, et al. (2010) Verbal autopsy: Reliability and validity estimates for causes of death in the Golestan cohort study in Iran. PLoS One 5(6): e11183.
12. Setel PW, Whiting DR, Hemed Y, Chandramohan D, Wolfson LJ, et al. (2006) Validity of verbal autopsy procedures for determining cause of death in Tanzania. Trop Med Int Health 11(5): 681–696.
13. Chandramohan D, Maude GH, Rodrigues LC, Hayes RJ (1998) Verbal autopsies for adult deaths: Their development and validation in a multicentre study. Trop Med Int Health 3(6): 436–446.
14. Yang G, Rao C, Ma J, Wang L, Wan X, et al. (2006) Validation of verbal autopsy procedures for adult deaths in China. Int J Epidemiol 35(3): 741–748. 15. Morris SK, Bassani DG, Kumar R, Awasthi S, Paul VK, et al. (2010) Factors associated with physician agreement on verbal autopsy of over 27000 childhood deaths in India. PLoS One 5(3): e9583.
17. Landis JR, Koch GG (1977) The measurement of observer agreement for categorical data. Biometrics 33(1): 159–174.
18. Reichenheim ME (2004) Confidence intervals for the kappa statistic. Stata Journal 4(4): 421–428.
19. Victora CG, Huttly SR, Fuchs SC, Olinto MT (1997) The role of conceptual frameworks in epidemiological analysis: A hierarchical approach. Int J Epidemiol 26(1): 224–227.