Molecular characterisation of
Aspergillus flavus
isolates from peanut fields
in India using AFLP
Diwakar Singh
1, T. Radhakrishnan
1, Vinod Kumar
1, N.B. Bagwan
1, M.S. Basu
1,
J.R. Dobaria
1, Gyan P. Mishra
1, S.V. Chanda
21
Directorate of Groundnut Research, Gujarat, India. 2
Department of Biosciences, Saurashtra University, Gujarat, India.
Submitted: October 19, 2013; Approved: November 12, 2014.
Abstract
Aflatoxin contamination of peanut, due to infection by Aspergillus flavus, is a major problem of rain-fed agriculture in India. In the present study, molecular characterisation of 187 Aspergillus flavusisolates, which were sampled from the peanut fields of Gujarat state in India, was performed using AFLP markers. On a pooled cluster analysis, the markers could successfully discriminate among the ‘A’, ‘B’ and ‘G’ groupA. flavusisolates. PCoA analysis also showed equivalent results to the cluster analysis. Most of the isolates from one district could be clustered together, which indicated genetic similarity among the isolates. Further, a lot of genetic variability was observed within a dis-trict and within a group. The results of AMOVA test revealed that the variance within a population (84%) was more than that between two populations (16%). The isolates, when tested by indirect com-petitive ELISA, showed about 68.5% of them to be atoxigenic. Composite analysis between the afla-toxin production and AFLP data was found to be ineffective in separating the isolate types by aflatoxigenicity. Certain unique fragments, with respect to individual isolates, were also identified that may be used for development of SCAR marker to aid in rapid and precise identification of iso-lates.
Key words:aflatoxin, AMOVA, ELISA, genetic diversity, groundnut, PCA.
Introduction
Peanut (Arachis hypogaeaL.), also known as ground-nut, is an important oilseed and ancillary food crop world-wide. In addition to the expulsion of oil, it is also used for production of peanut-butter and as a component of various food products. India possesses the largest peanut cultiva-tion area in the world and is the second largest producer af-ter China. The major Indian states, which collectively account for about 90% of the national area for peanut farm-ing, include Gujarat, Andhra Pradesh, Tamil Nadu, Rajasthan, Karnataka and Maharashtra; Andhra Pradesh and Gujarat raking at first positions, in terms of cultivation area, and production, respectively. In Gujarat, about 80% of the peanut cultivation is concentrated in Junagadh, Rajkot, Porbandar, Amreli and Jamnagar districts of
Saurashtra region (Anonymous, 2012; Misra and Thiru-malaisamy, 2012).
Among the various parameters for quality assess-ment, aflatoxin contamination constitutes one of the major non-tariff trade barriers, especially, in the international pea-nut trade market (Misra and Thirumalaisamy, 2012). Aflatoxins are secondary metabolites, which are produced byAspergillus flavusgroup of fungi, and are known to be carcinogenic and mutagenic (Abbaset al., 2004). Aflatoxin contamination of peanut, due to invasion byAspergillus, is a major problem of the rain-fed agricultural cultivation conditions in India (Misra and Thirumalaisamy, 2012). The fungi are wide spread in light sandy soils, which are most suitable for the peanut cultivation (Kumaret al., 2005). Al-though the aflatoxin contamination does not affect peanut production, but it causes serious health risks in humans and cattle (Hornet al., 1994).
Send correspondence to T. Radhakrishnan. Directorate of Groundnut Research, Post Box No. 05, Junagadh-362001, Gujarat, India. E-mail: [email protected].
Owing to the sensory properties, Indian peanuts are in great demand across the world. However, the export of pea-nut from India is hampered by aflatoxin contamination. The European Union (EU) has set a stringent maximum permis-sible limit (2 ppb) for aflatoxin in directly consumed pea-nuts (Wu et al., 2013). Due to aflatoxin contamination, recently, several consignments have been rejected at the destination ports in the EU (Misra and Thirumalaisamy, 2012).
Peanut pods, when come in direct contact with the spores ofA. flavusin soil, get frequently invaded before the harvest. The mode and extent of infection by the fungus de-pends on the population density ofA. flavusin the soil, soil moisture and soil temperature during the pod development till maturity (Smithet al., 1995). Once the kernels are con-taminated, the elimination of aflatoxins is not possible by routine cooking or processing practices. Roasting, how-ever, appreciably reduces the level of aflatoxin in the pea-nuts. Therefore, the best strategy to counteract this problem would be the prevention rather than decontamination (Misra and Thirumalaisamy, 2012).
The aflatoxins are produced by theAspergillus spe-cies, belonging to the sectionFlavi, such as,A. flavus, A.
parasiticus and the others, like, A. nomius, A.
minisclerotigenes, A. pseudocaelatus, etc. (Varga et al., 2011). Since, not all the isolates of Aspergillus are toxigenic (Desaiet al., 1991), the characterisation of the isolates, for their toxigenicity in the major agro-ecological zones of peanut production system in India, is the need of the hour.
At present, DNA fingerprinting is relatively econom-ical and allows discrimination of the fungal strains from the genus down to the clone level (Berbee and Taylor, 2001). Various types of molecular markers have been successfully employed to aid in detection of genetic variability in sev-eralAspergillusspecies. Amplified Fragment Length Poly-morphism (AFLP) is a technique which uses the benefits of both restriction digestion and PCR based selective amplifi-cation. AFLP has been widely used for molecular charac-terisation ofAspergillusspp. (Montielet al., 2003; Leeet al., 2004). Till date, limited information, from India, is available on the prevalence and variability across the iso-lates ofAspergillusbelonging to the sectionFlaviin respect to their toxigenicity (Desaiet al., 1991; Rajarajan et al., 2013). Hence, the present investigation was an attempt to-wards detailed molecular characterisation ofA. flavus iso-lates, collected from different peanut cultivation fields in Gujarat. The ultimate aim of this study was to analyse the genetic association among theAspergillus flavusisolates, with respect to their toxigenicity, in one of the major peanut producing set-up in India.
Materials and Methods
Fungal isolation and identification
A total of 187 fungal isolates, analysed in this study, were originally collected from the farmers’ fields, which were utilised for peanut farming, from 10 districts of Gujarat state (Table 1). Soil samples were collected from the groundnut fields and at each sampling, 5 randomly
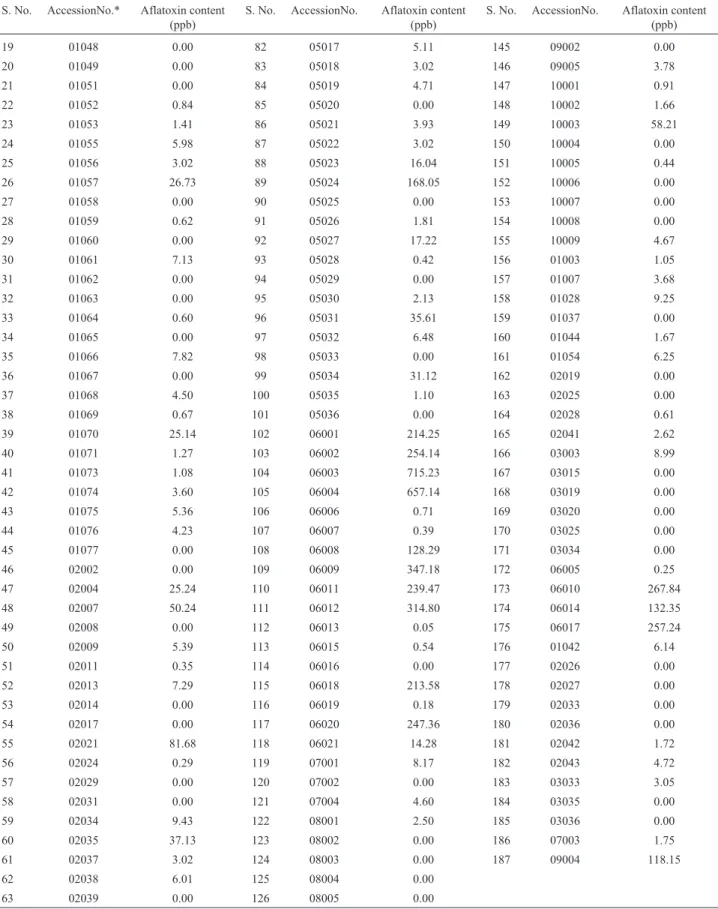
se-Table 1- Location and toxigenicity details ofAspergillus flavusisolates collected from soil samples under groundnut production system from Gujarat.
S. No. AccessionNo.* Aflatoxin content (ppb)
S. No. AccessionNo. Aflatoxin content (ppb)
S. No. AccessionNo. Aflatoxin content (ppb)
1 01009 0.00 64 02040 5.22 127 08006 1.00
2 01012 0.00 65 03005 0.00 128 08007 1.76
3 01016 1.12 66 03007 0.23 129 08008 0.71
4 01018 0.00 67 03024 0.00 130 08009 0.00
5 01025 6.37 68 03026 11.32 131 08010 2.65
6 01026 0.00 69 03027 56.54 132 08011 0.00
7 01031 5.24 70 03028 0.00 133 08012 6.59
8 01032 8.11 71 03029 0.00 134 08013 0.12
9 01035 5.24 72 03030 3.16 135 08014 39.96
10 01036 0.00 73 03031 8.77 136 08015 10.71
11 01038 0.00 74 03032 6.76 137 08016 0.00
12 01039 0.00 75 03037 2.40 138 08017 2.46
13 01040 0.00 76 04005 875.54 139 08018 0.73
14 01041 0.00 77 04010 698.47 140 08019 0.79
15 01043 0.00 78 05005 725.36 141 08020 2.17
16 01045 0.00 79 05010 145.02 142 08021 0.46
17 01046 0.00 80 05011 471.27 143 08022 1.55
S. No. AccessionNo.* Aflatoxin content (ppb)
S. No. AccessionNo. Aflatoxin content (ppb)
S. No. AccessionNo. Aflatoxin content (ppb)
19 01048 0.00 82 05017 5.11 145 09002 0.00
20 01049 0.00 83 05018 3.02 146 09005 3.78
21 01051 0.00 84 05019 4.71 147 10001 0.91
22 01052 0.84 85 05020 0.00 148 10002 1.66
23 01053 1.41 86 05021 3.93 149 10003 58.21
24 01055 5.98 87 05022 3.02 150 10004 0.00
25 01056 3.02 88 05023 16.04 151 10005 0.44
26 01057 26.73 89 05024 168.05 152 10006 0.00
27 01058 0.00 90 05025 0.00 153 10007 0.00
28 01059 0.62 91 05026 1.81 154 10008 0.00
29 01060 0.00 92 05027 17.22 155 10009 4.67
30 01061 7.13 93 05028 0.42 156 01003 1.05
31 01062 0.00 94 05029 0.00 157 01007 3.68
32 01063 0.00 95 05030 2.13 158 01028 9.25
33 01064 0.60 96 05031 35.61 159 01037 0.00
34 01065 0.00 97 05032 6.48 160 01044 1.67
35 01066 7.82 98 05033 0.00 161 01054 6.25
36 01067 0.00 99 05034 31.12 162 02019 0.00
37 01068 4.50 100 05035 1.10 163 02025 0.00
38 01069 0.67 101 05036 0.00 164 02028 0.61
39 01070 25.14 102 06001 214.25 165 02041 2.62
40 01071 1.27 103 06002 254.14 166 03003 8.99
41 01073 1.08 104 06003 715.23 167 03015 0.00
42 01074 3.60 105 06004 657.14 168 03019 0.00
43 01075 5.36 106 06006 0.71 169 03020 0.00
44 01076 4.23 107 06007 0.39 170 03025 0.00
45 01077 0.00 108 06008 128.29 171 03034 0.00
46 02002 0.00 109 06009 347.18 172 06005 0.25
47 02004 25.24 110 06011 239.47 173 06010 267.84
48 02007 50.24 111 06012 314.80 174 06014 132.35
49 02008 0.00 112 06013 0.05 175 06017 257.24
50 02009 5.39 113 06015 0.54 176 01042 6.14
51 02011 0.35 114 06016 0.00 177 02026 0.00
52 02013 7.29 115 06018 213.58 178 02027 0.00
53 02014 0.00 116 06019 0.18 179 02033 0.00
54 02017 0.00 117 06020 247.36 180 02036 0.00
55 02021 81.68 118 06021 14.28 181 02042 1.72
56 02024 0.29 119 07001 8.17 182 02043 4.72
57 02029 0.00 120 07002 0.00 183 03033 3.05
58 02031 0.00 121 07004 4.60 184 03035 0.00
59 02034 9.43 122 08001 2.50 185 03036 0.00
60 02035 37.13 123 08002 0.00 186 07003 1.75
61 02037 3.02 124 08003 0.00 187 09004 118.15
62 02038 6.01 125 08004 0.00
63 02039 0.00 126 08005 0.00
*Where Accession numbers were NRCG Accession numbers. S.No. 1-155; 156-175 and 176-187 are group ‘A’, ‘B’ and ‘G’ isolates respectively. The district from which the isolates were collected is as follows Junagadh (S.No. 1-30, 34-41, 43-45, 147-153, 156-161, 176); Porbandar (31-33, 42, 154-155); Amreli (46-64, 162-165, 177-182); Bhuj (65-75, 166-171, 183-185); Anand (76-77); Bhavnagar (78-101); Sabar Kantha (102-118, 172-175); Jamnagar (119-121); Surendranagar (112-143, 186) and Rajkot (114-146, 187).
lected spots, at 0-10 cm of depth, from between the plants and individual samples were pooled for each plot. The in-terval between soil samples was 100-300 m at any single lo-cation, the pair-wise distance between populations was about 5-30 km, whereas, the pair-wise distance between the districts was approximately 50-430 km. The fungal isola-tion was done by the diluisola-tion plate method as previously described by Horn and Dorner (1998) and the cultures were purified using the single spore isolation technique and maintained as single spore cultures on agar slants. All the isolates were cultured on Aspergillus flavus/parasiticus
agar (AFPA; Sigma-Aldrich), which is a selective identifi-cation medium for the detection ofA. flavusgroup strains, (Pittet al., 1983) for 3 to 5 days at 25 °C in dark, to confirm identification at the section level by reverse colony colour. Further, the morphological and growth characteristics of all the isolates were analysed on solid medium, the Czapek’s Dox agar (CZ), and identification of the species was done on the basis of the colour of the colonies,i.e.yellow-green for A. flavus and dark green or nearly Ivy green for A. parasiticus.
Indirect competitive-enzyme linked immunosorbent assay (ELISA)
Indirect competitive ELISA was performed for the quantitative screening of the collected isolates.Aspergillus flavusstrains were grown at 30 °C for 7 days on PDA plates (three replicates per isolate) as described by Waliyaret al.
(2009). Aflatoxin B1-bovine serum albumin (AFB1-BSA) conjugate was prepared in carbonate coating buffer (100 ng mL-1) and 150 mL was added to each well. The plates were then incubated at 37 °C for 1 h, after which the toxin was collected and stored. The wells were washed with PBST (Phosphate Buffered Saline supplemented with Tween 20) followed by incubation with BSA solution (0.2% BSA prepared in PBST) (200mL per well) for 1 h at 37 °C. Antiserum diluted in BSA solution was added to the wells and incubated for 45 min at 37 °C. After appropriate blocking, the wells were washed with PBST.
Extract of healthy seed of peanut variety J-11 was taken as the negative control and for the positive control, the AFB1standard was diluted (1:10) with peanut extract at concentrations ranging from 100 ng to 10 pg (100mL per well). Then, 50mL of the anti-serum (Sigma-Aldrich) was added to each dilution of aflatoxin standard (100mL) and the peanut seed extract (100mL). The plates having afla-toxin samples and antiserum were incubated at 37 °C for 1 h and subsequently washed with PBST.
Alkaline phosphatase (ALP) labelled goat anti-rabbit IgG (1:1000 dilution; volume 150mL) was then added to each well and incubated at 37 °C for 1 h. The ELISA wells were washed with PBST and 150mL of the substrate solu-tion (p-nitrophenyl phosphate prepared in 10% diethanol-amine buffer, pH 9.8) was added and incubated for 1 h at
room temperature. The absorbance was measured at 405 nm in an automatic ELISA reader. A standard curve for AFB1was prepared for estimation of aflatoxin content in the test samples. The detection limit for aflatoxin was 0.05 ppb.
Fungal DNA isolation
The isolates were cultured on potato dextrose agar (PDA) slants for isolation of genomic DNA. Conidia were harvested from 7-days old slant cultures, grown at 28 °C and inoculated into 50 mL of Yeast extract-Peptone-Dextrose broth followed by incubation at 25 °C for 48-72 h with shaking at150 rpm. After appropriate growth, the mycelial suspension was filtered through a Buchner funnel with sterile Whatman No. 1 filter paper. Mycelium was rinsed twice with sterile distilled water, transferred into a 50 mL centrifuge tube and froze at -80 °C.
Upon treatment with liquid nitrogen, the frozen mycelial mats were ground to fine powder using a mortar and pestle. Approximately, 20 mg of the homogenised mycelial powder was suspended in 600mL of lysis buffer (100 mM Tris-HCl, pH 8.0; 100 mM NaCl; 20 mM EDTA and 2% SDS) and incubated for 10 min at 60 °C in a water bath. Subsequently, DNA was extracted from the samples by incubation with equal volumes of phenol/chloroform (1:1), followed by chloroform/isoamyl alcohol (24:1) treat-ment. DNA from the samples was precipitated with 0.7 vol-ume of chilled ethanol and vacuum dried. Finally, the DNA pellets were re-suspended in TE Buffer (pH 8.0) and sub-jected to treatment with RNase A at 37 °C for 1.5 h, to re-move RNA contamination. DNA concentration and purity was determined by measurement of absorbance at 260 nm and 280 nm using Nano Drop, while the integrity of DNA was examined by agarose gel (0.8%) electrophoresis.
AFLP reactions
AFLP analysis system for microorganisms (Invi-trogen-Corporation, Carlsbad, CA) was used as previously described by Leeet al.(2004). Approximately, 500 ng of genomic DNA, from each isolate, was subjected to restric-tion digesrestric-tion with EcoRI and MseI restriction enzymes (Invitrogen-Corporation, Carlsbad, CA), and the restricted fragments were ligated to the double-stranded restriction site-specific ligation adaptors supplied with the kit. A pre-selective PCR (94 °C for 30 s, 20 cycles of 94 °C for 30 s, 56 °C for 60 s, 72 °C for 60 s; and 72 °C for 5 min; final hold at 4 °C) was carried out in a 25mL (final volume) mixture. For the selective PCR, 5mL of the 1:5 dilution of the first PCR product was amplified in a 25mL (final volume) mix-ture using the selective primers.
Initially, 30 different primer combinations of
EcoRI/MseI were used, of which five different primer com-binations, viz. EcoRI-AA/Mse I-A, EcoRI-AC/Mse I-G,
EcoRI-AC/MseI-A,EcoRI-AC/MseI-T andEcoRI-C/Mse
were used for the selective amplification. The PCR pro-gram, for selective AFLP amplification, included one cycle of 94 °C for 60 s and one cycle of 94 °C for 60 s, 65 °C for 60 s, and 72 °C for 90 s; this cycle was followed by nine cy-cles in which the annealing temperature ranged from 64 °C to 56 °C, and decreased by 1 °C for each cycle. Following that, 23 cycles of 94 °C for 30 s, 56 °C for 30 s, and 72 °C for 90 s were performed, with the final extension at 72 °C for 5 min., and indefinite hold at 4 °C in a thermal cycler (Eppendorf). Thereafter, 5mL of the reaction product was mixed with 3mL of 6x loading dye (Fermentas). The ampli-fication for each primer-combination was performed twice, independently, following the same procedure, in order to ensure the fidelity of the AFLP markers.
AFLP fragments were resolved in denaturing 6% polyacrylamide gel with 1X Tris-borate EDTA buffer (pH 8.0) in both the gels. The gels were run at 25 W and stained by silver staining with slight modifications, as described by Benbouzaet al.(2006), and scanned using the UMAX Mi-rage II gel scanner (Type H5K0). After digitisation of the gel pictures, the DNA bands were scored and analysed us-ing the software Gel Compare II (Applied Maths, Kortrijk, Belgium).
Genetic distance and cluster analysis of AFLP data
Similarity matrix, using the AFLP polymorphism of
A. flavusisolates, was measured by Jaccard similarity co-efficient, which was subjected to cluster analysis by Neigh-bour Joining method. FreeTree software (Pavlíceket al., 1999) was employed for construction of dendrogram, on the basis of distance data and for bootstrap analysis of the robustness of the trees. The colour separation in the dendro-gram was done using the Interactive Tree of Life (Itol) soft-ware (Letunic and Bork, 2007). The allelic information was generated using the softwares, GenAIEx 6.501 and Gel Compare II. The AFLP data were subjected to a hierarchi-cal analysis of molecular variance (AMOVA) (Excoffieret al., 1992), using the three hierarchical levels,i.e. individ-ual, population and their regions. The GenAIEx software was used to calculate the principal co-ordinates analysis (PCoA) that plots the relationship between the distance ma-trix elements based on their first two principal co-ordinates (Peakall and Smouse, 2001).
Results and Discussion
Identification and toxigenicity of the isolates
In the present investigation,Aspergillus flavus popu-lations were examined for their afla-toxigenicity. Amongst the isolates, belonging toAspergillus section Flavi, 71% were characterised asA. flavus(n = 184) and the remaining 29% asA. parasiticus(n = 75). Our results are in concor-dance with the previous findings from studies onA. flavus
population from the peanut cropping system in India (Patil
1985, Reddy 2007). All theA. flavusisolates were selected as population and used for the AFLP analysis.
In this study, about 68.5% of the isolates were found to be atoxigenic, as tested by indirect competitive ELISA (Table 1), which is in conformity with the results of Chou-rasia and Sinha (1994). Bio-control by competitive exclu-sion has been regarded as the most promising means of controlling aflatoxin contamination of peanuts. It was ob-served that when competitive atoxigenic strains were ap-plied to the soil, they produced large numbers of conidia than the toxigenic isolates (Alaniz Zanon et al., 2013). Since, both occupy the same niches as the naturally occur-ring toxigenic populations, and aflatoxin contamination is subsequently reduced in the crops (Dorner, 2004). Such atoxigenic strains may be used for successful management of toxigenicAspergilliin soil (Dorner and Lamb, 2006).
Dendrogram analysis
In the present study, five selected AFLP primer-pair combinations produced a complex, but well-resolved fin-gerprint pattern (Figure 1). This analysis provided novel data on the molecular composition ofA. flavuspopulations present in the peanut growing fields of Gujarat (India).
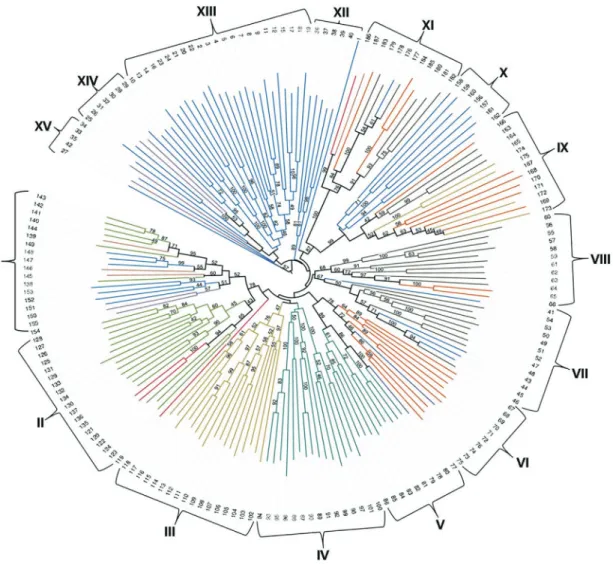
A composite dendrogram was generated based on all the five AFLP primer combinations using GenAIEx and Gel Compare II softwares, where all 187 isolates could be divided into 15 different clusters (I-XV; Figure 2). More-over, the results of PCoA analysis were also comparable to the cluster analysis. Based on the morphological characteri-sation, the isolates were grouped into three distinct groups,
i.e.group A, B and G. The dendrogram showed clear parti-tioning of ‘A’, ‘B’ and ‘G’ groups of the isolates into 14 (I-VIII and XII-XV), 02 (IX and X) and 01 (XI) clusters, re-spectively (Figure 2), which indicated that there were more scorable polymorphisms within the group ‘A’ isolates than either the ‘B’ or the ‘G’ groups of isolates. Our results are in agreement with Barros et al. (2007), who analysed the
Aspergillus isolates by AFLP. Similar results have also been obtained through the other molecular methods (Tran Dinh, 1999; Wanget al., 2001).
From the cluster pattern based on the composite AFLP analysis, it has been inferred that most of the isolates of the same district could be clustered together. A few iso-lates of the other districts, like, Junagadh were also found to be clustered with the isolates of the other districts. This might be due to the dissemination of the contaminated seed material, being cultivated in one district, to another or it could be because of a similar genetic make-up of those iso-lates. Such result agrees with a number of previous findings inFlavisection ofAspergillus(Montielet al., 2003; Barros
et al., 2007; Bairdet al., 2006). Thus, by using these five AFLP primer combinations, theA. flavusisolates could be grouped according to their morphological groups (e.g.
Details of genetic diversity of differentA. flavus
populations
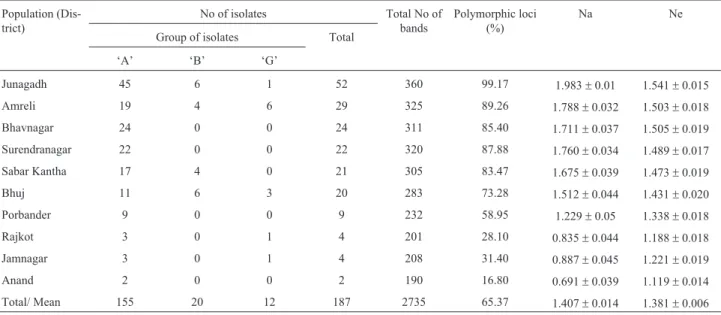
While analysing the genetic diversity details of each population ofA. flavus,it was observed that the maximum number of bands were amplified, and percentage polymor-phic bands were recorded for Junagadh district (360 and 99.17%, respectively), followed by Amreli district (325
and 89.26%, respectively). Likewise, the number of differ-ent alleles and the number of effective alleles were also the highest for the isolates that were collected from the Junagadh district. This clearly indicated that the maximum diversity was recorded for Junagadh and minimum for Anand district (Table 2). Certain differences could be at-tributed to the size of fungal population that was studied from any location,i.e. the larger is the population, more
Figure 1- A representative AFLP profile ofA. flavusisolates (primer combination E-C/M-CAG).
Table 2- Genetic diversity details about each population ofA. flavuscollected from different parts of groundnut growing fields of Gujarat.
Population (Dis-trict)
No of isolates Total No of
bands
Polymorphic loci (%)
Na Ne
Group of isolates Total
‘A’ ‘B’ ‘G’
Junagadh 45 6 1 52 360 99.17 1.983±0.01 1.541±0.015
Amreli 19 4 6 29 325 89.26 1.788±0.032 1.503±0.018
Bhavnagar 24 0 0 24 311 85.40 1.711±0.037 1.505±0.019
Surendranagar 22 0 0 22 320 87.88 1.760±0.034 1.489±0.017
Sabar Kantha 17 4 0 21 305 83.47 1.675±0.039 1.473±0.019
Bhuj 11 6 3 20 283 73.28 1.512±0.044 1.431±0.020
Porbander 9 0 0 9 232 58.95 1.229±0.05 1.338±0.018
Rajkot 3 0 1 4 201 28.10 0.835±0.044 1.188±0.018
Jamnagar 3 0 1 4 208 31.40 0.887±0.045 1.221±0.019
Anand 2 0 0 2 190 16.80 0.691±0.039 1.119±0.014
Total/ Mean 155 20 12 187 2735 65.37 1.407±0.014 1.381±0.006
pronounced are its genetic diversity details. Genetic diver-sity details of all the populations studied have been pre-sented in the Table 2.
AMOVA revealed that the variance within the popu-lation was much more (84%) than that between the popula-tions (16%). A higher genetic diversity within theA. flavus
populations indicates that there could be many discreet populations that possess unique genotypes at any location. However, on the population basis, at any two locations, variations are not so high. Thus, high level of genetic diver-sity observed within the populations ofA. flavuscould be attributed to the evolutionary factors, such as gene-flow, random genetic drift and the anthropogenic activities, such as a specific peanut cropping pattern followed in Gujarat, which needs further investigation. The results of various previous studies onA. flavus(Montielet al., 2003; Barros
et al., 2007; Bairdet al., 2006) are in tune with our investi-gation findings.
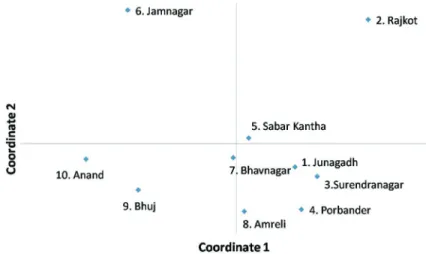
Analysis of the principal co-ordinates of A. flavus
populations, which were collected from the fields of 10
peanut growing districts of Gujarat, revealed that the iso-lates collected from the districts of Junagadh, Sabar Kantha, Surendranagar, Bhavnagar, Porbander and Amreli are closer to each other. However, the isolates collected from Jamnagar, Rajkot, Anand and Bhuj district are quite diverse from each other (Figure 3).
Identification of different groups of isolates
The AFLP primer combinations used in the present study showed certain specific fragments, which may be specifically used for the identification of isolates from each other. For certain isolates, 14 unique bands were identified (Table 3). The 200 bp fragment, amplified by E-AA/M-A primer combination, was absent in each of the ‘A’ group isolates, whereas, it was present in all of the ‘B’ and the ‘G’ group isolates. A fragment of 400 bp, amplified by E-AC/M-A primer combination, was present in all the ‘G’ group isolates, but absent in all the ‘B’ and the ‘A’ group isolates. The same primer combination could amplify a fragment of 525 bp that was present only in the ‘B’ group
isolates and absent in all the ‘A’ and the ‘G’ group isolates. Some unique fragments, which were either present or ab-sent in isolates, may also serve as specific markers for iden-tification of respective isolates or group of isolates.
Some specific isolates,i.e.NRCG 02037, 02021 and 05024, may be identified by using the specific primer com-binations. Apart from the individual isolates, a set of iso-lates and a group of isoiso-lates have also produced specific fingerprint and can be identified by using the primer combi-nations used in our study. Group ‘B’, ‘G’ and ‘A’ isolates produced different fingerprints and thus, could be differen-tiated from each other. Since, the PCR diagnostics could be of great value in ecological and epidemiological studies, where vast numbers of isolates have to be screened in a short duration (Schmidtet al., 2004), therefore these diag-nostic/specific fragments could be useful in establishment of a PCR-based diagnostic assay (Barroset al., 2007), by
development of sequence characterised amplified regions (SCARs). In the current investigation, certain specific amplicons were identified which may be used for the devel-opment of SCARs for identification of specific isolates (Table 3).
Association of AFLP markers with toxigenicity
The molecular mechanisms leading to the loss of afla-toxin production in atoxigenicA. flavushave been investi-gated intensively by various researchers across the world (Jianget al., 2009; Criseoet al., 2008). In the present inves-tigation, AFLP analysis was found to be ineffective for dif-ferentiation of isolate types on the basis of aflatoxigenicity, as both toxigenic and atoxigenic forms were inter-mixed within the groups with no clear demarcation. Our result is in concurrence with the previous studies onAspergillus sec-tionFlavi, in view of RAPDs (Tran Dinh, 1999),
quadru-Figure 3- Principal coordinates analysis ofA. flavuspopulations, collected from the fields of ten peanut growing districts of Gujarat state.
Table 3- Amplicons that can be used for SCAR development against specific isolates and/or group of isolates.
Amplicons (bp) which may be used for SCAR development
Primer combination used Isolates S.No./ Group of Isolates that can be identified
265 E-AA/M-A 16, 23, 24, 31, 42, 61, 97, 98, 99, 100 and 101
125 E-AA/M-A 16, 23, 24, 31, 42, 61, 97, 98, 99, 100 and 101, 115, 116, 117, 118, 151 and 152
200 E-AA/M-A Group ‘B’ and Group ‘G’
375 E-AC/M-A 10, 13, 14, 42, 55, 89, 90, 91 and 92
400 E-AC/M-A Group ‘G’
525 E-AC/M-A Group ‘B’
390 E-AC/M-G 10, 13, 14, 89, 90, 91 and 92
375 E-AC/M-G Group ‘B’
225 E-AC/M-T Group ‘B’
210 E-C/M-CAG 10, 13, 14, 93, 94, 95, 96 and 102
185 E-C/M-CAG 10, 13, 14, 34, 89, 90, 91 and 92
180 E-C/M-CAG 10, 13, 14, 34, 89, 90, 91 and 92
250 E-C/M-CAG Group ‘B’
plex PCR (Wanget al., 2001), AFLP (Montielet al., 2003), and DNA amplification fingerprinting (Bairdet al., 2006). Moreover, the earlier studies have also shown that with AFLP, no genotypic difference could be established be-tween the toxin producers and the non-producers (Barroset al., 2007; Schmidtet al., 2004; Perroneet al., 2006).
As toxin production is a very complex trait and is un-likely to be acquired independently, Tranet al.(1999) sug-gested that in the absence of sexual recombination, non-toxigenicity has been lost multiple times by different iso-lates. Geiseret al.(1998) proved the recombination inA. flavus, which means, non-toxigenicity may have passed lat-erally between isolates of different genetic backgrounds.
It has been reported that the analysis of deletions within the aflatoxin biosynthetic gene cluster, could be a more effective marker for differentiation of toxigenic and atoxigenic isolates (Jianget al., 2009; Changet al., 2005). However, the loss of aflatoxin production may be not result only due to deletions in the gene cluster (Wanget al., 2001; Criseoet al., 2008). Criseoet al.(2008) reported that 36.5% of atoxigenic strains have the complete aflatoxin gene clus-ter; however, the exact mechanism of loss of aflatoxin pro-duction is still unknown. In the atoxigenic strain AF36, a defect causing a premature stop codon in the coding se-quence of the aflatoxin biosynthesis gene pksA was re-ported (Ehrlich and Cotty, 2004). This suggests that there is a need to further characterise the non-aflatoxigenic strains, which have been identified in the present investigation, to find the exact cause of their atoxigenicity.
Based on our findings, we may conclude that the AFLP technique can provide the required genetic informa-tion about theA. flavusisolates from the peanut cropping systems in India. Moreover, it can also be used as a power-ful molecular tool to study the genetic diversity inA. flavus.
The information generated, from this study, could be used for the prevention of aflatoxin contamination of peanut crop, at field level, by increasing the relative concentration of the atoxigenic strains, in one of the major peanut cultiva-tion area in India, which will ultimately help in improving the crop’s export. Further, the molecular characterisation of atoxigenic strains that were identified in the study would be useful to unveil the basis of their atoxigenicity.
Acknowledgments
Authors are thankful to the ICAR, New Delhi for funding of the project under the “Network project on Pre-vention and management of mycotoxin contamination in commercially important agricultural commodities”. We thank “Sci-Edit Publications (Language Editing Services) (www.sci-edit.net)” for editing the manuscript.
References
Abbas HK, Shier WT, Horn BWet al.(2004) Cultural methods for aflatoxin detection. J Toxicol Toxin Rev 23:295-315.
Alaniz Zanon MS, Chiotta ML, Giaj-Merlera Get al.(2013) Eval-uation of potential biocontrol agent for aflatoxin in Argen-tinean peanuts. Int J Food Microbiol 162:220-225. Anonymous (2012) Annual Report, Directorate of Groundnut
Re-search. Junagadh, Gujarat, , 136 pp.
Baird RE, Trigiano RN, Windham Get al.(2006) Comparison of aflatoxigenic and nonaflatoxigenic isolates of Aspergillus flavususing DNA amplification fingerprinting techniques. Mycopathologia 161:93-99.
Barros GG, Chiotta ML, Reynoso MMet al.(2007) Molecular characterization of Aspergillussection Flavi isolates col-lected from peanut fields in Argentina using AFLPs. J Appl Microbiol 103:900-909.
Benbouza H, Jacquemin JM, Baudoin JPet al.(2006) Optimiza-tion of a reliable, fast, cheap and sensitive silver staining method to detect SSR markers in polyacrylamide gels. Bio-technol Agron Soc Environ 10:77-81.
Berbee ML, Taylor JW (2001) Fungal Molecular Evolution: Gene Trees and Geologic Time. In: MC McLaughlin, EG McLaughlin, PA Lemke (eds) The Mycota VII Part B, Springer-Verlag, Berlin, pp 229-245.
Chang PK, Horn BW, Dorner JW (2005) Sequence breakpoints in the aflatoxin biosynthesis gene cluster and flanking regions in nonaflatoxigenic Aspergillus flavus isolates. Fungal Genet Biol 42:914-923.
Chourasia HK, Sinha RK (1994) Potential of biological control of aflatoxin contamination in developing peanut by atoxigenic strains ofAspergillus flavus. J Food Sci Technol 31:362-366.
Criseo G, Racco C, Romeo O (2008) High genetic variability in nonaflatoxigenic A. flavus strains by using quadruplex PCR-based assay. Int J Food Microbiol 125:341-343. Desai S, Ghewande MP, Nagaraj Get al.(1991) Screening for
re-sistance toAspergillus flavus and aflatoxin production in groundnut. Mycotoxin Res 7:79-84.
Dorner JW (2004) Biological control of aflatoxin contamination of crops. J Toxicol Toxin Rev 23:425-450.
Dorner JW, Lamb MC (2006) Development and commercial use of aflaguard®, an aflatoxin biocontrol agent. Mycotoxin Res 21:33-38.
Ehrlich KC, Cotty PJ (2004) An isolate ofAspergillus flavusused to reduce aflatoxin contamination in cotton seed has a defec-tive polyketide synthase gene. Appl Microbiol Biotechnol 65:473-478.
Excoffier L, Smouse PE, Quattro JM (1992) Analyses of molecu-lar variance inferred from metric distances among DNA haplotypes: application to human mitochondrial DNA re-striction data. Genetics 131:479-491.
Geiser DM, Pitt JI, Taylor JW (1998) Crytic speciation and re-combination in the aflatoxin-producing fungusAspergillus flavus. P Natl Acad Sci USA 95:388-393.
Horn BW, Dorner JW (1998) Soil populations ofAspergillus spe-cies from section Flavi along a transect through peanut-growing regions of the United States. Mycologia 90:767-776.
Horn BW, Dorner JW, Greene RL et al. (1994) Effect of Aspergillus parasiticussoil inoculum on invasion of peanut seeds. Mycopathologia 125:179-191.
Kumar V, Ghewande MP, Basu MS (2005) Safeguard Groundnut from Aflatoxin Contamination. NRCG, Junagadh, pp 1-13. Lee CZ, Liou GY, Yuan GF (2004) Comparison ofAspergillus
flavusandAspergillus oryzaeby amplified fragment length polymorphism. Bot Bull Academia Sinica 45:61-68. Letunic I, Bork P (2007) Interactive Tree Of Life (iTOL): an
on-line tool for phylogenetic tree display and annotation. Bioin-formatics 23:127-128.
Misra JB, Thirumalaisamy PP (2012) Bulletin on Management of Aflatoxin. Directorate of Groundnut Research, Junagadh, 52 pp.
Montiel D, Dickinson MJ, Lee HAet al.(2003) Genetic differen-tiation of theAspergillussectionFlavicomplex using AFLP fingerprints. Mycological Res 107:1427-1434.
Patil SP, Shinde PA (1985) Mycotoxin contamination and associ-ated mycoflora of groundnut. J Maharashtra Agric Univ 10:99-100.
Pavlícek A, Hrdá S, Flegr J (1999) Free-Tree-freeware program for construction of phylogenetic trees on the basis of dis-tance data and bootstrap/jackknife analysis of the tree ro-bustness. Application in the RAPD analysis of genus Fren-kelia. Folia Biol (Praha) 45:97-99.
Peakall R, Smouse PE (2001) GenAlEx V5: Genetic Analysis in Excel. Population genetic software for teaching and re-search. Australian National University, Canberra. http://www.anu.edu.au/BoZo/GenAlEx/.
Perrone G, Mule G, Susca Aet al.(2006) Ochratoxin A produc-tion and amplified fragment length polymorphism analysis of Aspergillus carbonarius, Aspergillus tubigiensis and Aspergillus nigerstrains isolated from grapes in Italy. Appl Environ Microbiol 72:680-685.
Pitt JI, Hocking AD, Glenn DR (1983) An improved medium for the detection ofAspergillus flavusandA. parasiticus.J Appl Bacteriol 54:109.
Rajarajan PN, Rajasekaran KM, Asha Devi NK (2013) Isolation and quantification of aflatoxin fromAspergillus flavus in-fected stored peanuts. Indian J Pharm Biol Res 1:76-80. Reddy BN, Raghavender CR (2007). Outbreaks of aflatoxicoses
in India. Afr J Food Agril Nutr Develop 7:nd07046. Schmidt H, Taniwaki MH, Vogel RFet al.(2004) Utilization of
AFLP markers for PCR-based identification ofAspergillus carbonariusand indication of its presence in green coffee samples. J Appl Microbiol 97:899-909.
Smith JE, Solomons G, Lewis Cet al.(1995) Role of mycotoxins in human and animal nutrition and health. Nat Toxins 3:187-192.
Tran Dinh N, Pitt JI, Carter DA (1999) Molecular genotype analy-sis of natural toxigenic and nontoxigenic isolates of Aspergillus flavusandAspergillus parasiticus. Mycol Res 103:1485-1490.
Varga J, Frisvad JC, Samson RA (2011) Two new aflatoxin pro-ducing species, and an overview of Aspergillus section Flavi.Stud Mycol 69:57-80.
Waliyar F, Reddy SV, Lava-Kumar P (2009) Review of immuno-logical methods for the quantification of aflatoxins in peanut and other foods. Peanut Sci 36:54-59.
Wang L, Yokoyama K, Takahasi Het al.(2001) Identification of species inAspergillussectionFlavibased on sequencing of mitochondrial cytochrome b gene. Int J Food Microbiol 71:75-86.
Wu F, Stacy SL, Kensler TW (2013) Global Risk assessment of aflatoxins in maize and peanuts: Are regulatory standards adequately protective? TOXICOL SCI 135:251-259.
Associate Editor: Cynthia Canêdo da Silva