THE RELEVANCE OF COMPREHENSIVE INCOME COMPARED TO NET INCOME
FOR THE MEASUREMENT AND PRESENTATION OF COMPANY PERFORMANCE
Assoc. Prof. FIRESCU Victoria , University of Piteşti
Faculty of Economic Sciences and Law Pitesti, Romania
Assoc. Prof. BONDOC Maria Daniela University of Piteşti
Faculty of Economic Sciences and Law Pitesti Romania
Abstract: The main objective of our research is to highlight the volatility of comprehensive income compared to the net income in assessing company performance. The empirical study is performed on a sample of companies listed on the Bucharest Stock Exchange applying IFRS in 2012-2015.
We carried out a positive research using the following methods: literature review, data collection from the financial statements of the studied companies, mathematical and statistical calculation.
The volatility of comprehensive income was approached both dynamically and transversally. We calculated and analysed the relative standard deviation for the companies proposed in our survey in order to determine deviations from the average of comprehensive income and net income.
The obtained results invalidate the hypothesis that the comprehensive income is more volatile than the net income.
JEL Classification: M41, L25
Key words: comprehensive income, net income, performance, IFRS, volatility
1.INTRODUCTION
In the past two decades, we witnessed an increase in accounting regulations in terms of number and especially in terms of complexity at national as well as at international level. At the same pace, the accounting research carried out many theoretical abstractions that did not always found an intelligible correspondent in the accounting profession. (Bricker R, 1993). These aspects led to an increase and a diversification of the risks related to the object of activity of business entities, which marked the reporting of a fair view of the company performance
The measurement and reporting of the company performance is a topic as complex as it is important because it allows for the improvement of the company management (Niculescu, 2005).
The notion of company performance is multiple and sometimes paradoxical. There is a certitude that performance consists in the present and is built overtime under the incidence of the globalization of economies and the internationalisation of enterprises.
concept of performance is a component of all paradigms known by accounting in its evolution from the technique of accounting records to a tool for information and social intermediation. (Bourguignon A.,1995)
The problem of conceptualization and especially that of measuring company performance under the impact of the international accounting standards is far from receiving a satisfactory answer. The traditional financial theory is not sufficient for the assessment of the overall performance of a company engaged in sustainable development. (Capron M., Quairel-Lanoizelee F., 2006)
For a long time, the accounting result was and still is viewed as the main indicator for the measurement of company performance. Due to its method of calculation, the accounting result is oriented towards the past, being unable to assess the future of the business.
The result of the accounting period has a number of limitations in pertinently reflecting company performance. It is influenced by the accounting policies on recognizing or capitalizing the expenses related to the financial year.
2.OBJECTIVESANDMETHODOFRESEARCH
In our paper, we are aiming at finding an adequate answer concerning the relevance of the comprehensive income compared to the accounting result in measuring the performance of the Romanian companies that adopted IFRS in preparing individual financial statements from financial year 2012. We developed the main objective of our research into several operational objectives which we approached and developed at the level of the chapters presented in the paper. The main stages aimed in the above-mentioned approach are related to a positive research (Watts R., Zimmerman J.L., 1990) which implies: a clear formulation of the problem to be researched, collecting data, formulating hypotheses, validating hypotheses.
This research is a quantitative research, because it is based on data collected from financial statements, statistical methods, and the logical formulation of hypotheses. The hypothesis is a declarative announcement that anticipates a causal relationship concerning the occurrence of the concept of comprehensive income (Caplow. T., 1970)
The inductive reasoning allows from passing from the facts noticed at the level of the companies studied to hypotheses.
The research hypotheses are:
Hypothesis 1: The comprehensive income is the consequence of the priority given by the regulatory bodies to financial reporting by the shareholders;
Hypothesis 2: The volatility of the comprehensive income is induced by the use of the fair value;
Hypothesis 3: At aggregate level, the comprehensive result has an information relevance higher than the net income;
Hypothesis 4: At individual level, the other elements of the comprehensive income provide more relevant information compared to the accounting result;
Hypothesis 5: The comprehensive income is more volatile than the net income. Through deductive reasoning, we tried to pass from the accounting concepts, theories and regulations on the comprehensive income and its components to their
customization at the level of business entities. We share Albu and Mustață’s idea (2008)
3.CONCEPTUALANDNORMATIVEPROBLEMSOFTHECOMPREHENSIVEINCOMEIN MEASURINGCOMPANYPERFORMANCE
In this chapter we try to prove whether research hypothesis no. 1 can be validated or not. The research methods we used are as follows:
- documentation, content and structure analysis of the international regulations on comprehensive income;
-chronologic, systematic and legitimacy analysis.
From the point of view of the accounting practice and regulation, two approaches can be highlighted concerning the result measuring technique, more specifically:
The asset/liability approach, also referred to as the balance sheet approach;
The income/expense approach or the approach through the profit and loss account. From the theoretical point of view, the comprehensive income is the integrated size of all the items of incomes, expenses, earnings and losses measuring the variation of
the value of the equity capitals or the shareholders’ fortune, with the propose of increasing
transparency in financial reporting.
The notion of comprehensive income emerged and was developed in countries with an Anglo-Saxon culture. In 1985, FASB defined the comprehensive income as being
“the change in equity (net assets) of a business enterprise during a period, from
transactions and other events and circumstances from nonowner sources”. Thus, from 1992, when FRS 3: Reporting financial performance was issued, English entities have the obligation to present the comprehensive income.
Reporting the comprehensive income became mandatory from 1997 for the entities in the United States of America too, when SFAS 130 was issued. After issuing SFAS 130, both at the level of IASB as well as at the level of FASB, the problems of the comprehensive income evolved, being closely related to the treatment of the differences from the assessment at the fair value from certain standards.
According to the IASB Conceptual Framework, both incomes and earnings are included in the category of positive results, while expenses and losses are negative results, which supports the image of an accounting of the comprehensive income or of the clean surplus (clean surplus accounting). Nevertheless, in the practice of the standards issued before by IASB, especially those in the area of the assessment at fair value, we can find
very many rules that reflect an accounting model of the net income or of the “dirty
income” (dirty surplus accounting), in which fair value adjustments are not recorded in the net income, and are instead transferred directly in equity.
IAS 1 in its initial version, issued in 1997, required that other items of incomes and expenses be presented in the statement of changes in equity, together with the changes in equity caused by transactions with shareholders.
IAS 1 reviewed in 2006 brought amendments related to reporting performance, more specifically that all changes in equity, other than those from transactions with owners, in other words of all items of incomes and expenses be presented in a single statement.
However, from discussions held at the level of the Committee, it became clear that many of its members vehemently reject the solution of a single financial statement for the reporting of the total income (or of all the incomes and expenses recognized) (BC 14). This position is justified by the fact that such a financial statement would undeservedly lead to highlighting the role of the overall indicator, presented at the end of this single statement.
In conclusion, we can estimate that the introduction of the new concept of overall income and the concerns to create a synthesis financial statement dedicated to it aims at providing shareholders with useful information in the assessment of their fortune in the entities they own, to the detriment of an exclusive assessment of the efficiency of the action of managing resources by the managers.
The comprehensive income is the income that includes both the present and the past one (the accounting result) as well as the future one (potential earnings and losses). All these components concerning potential earnings and losses are recognised and recorded at fair value, leading to an increased volatility of the comprehensive income on the background of the fact that there is no active, functional market for the initial values of these components.
The opponents of the comprehensive income clam that the inherent volatility of the components of this income will lead to an increased perception of the risk of the company. In their opinion, the comprehensive income is redundant because it can be found anywhere else in the financial statements.
Maines and McDaniel (2000) believe that the comprehensive income is important for non-professional investors.
It is obvious that some of the items of the financial statements can have a high predictive value for investors, even if they fluctuate from a period to another.
We can estimate that the introduction of the new concept of comprehensive income and the concerns to create a synthesis financial statement dedicated to it emerges as a result of the priority given to the transparent financial reporting in the interest of the shareholders, of the expansion of the use of fair value as valuation base. In other words, the first research hypothesis is validated.
Due to the fact that IASB favours a single user, i.e. the shareholders, it attracted increased criticism that anticipates a new measure of the overall performance from the point of view of the stakeholders participating on the basis of a mutual compromise process.
Gomez resorts to the conventionalist theory in redefining the notion of performance in the management sciences. The reflection of risk is the main characteristic of the accounting in fair values.
4.THEVOLATILITYOFTHECOMPREHENSIVEINCOME,ACONSEQUENCEOFTHEUSE OF THE FAIR VALUE IN COMPLIANCE WITH THE INTERNATIONAL ACCOUNTING STANDARDS
This chapter is dedicated to the second research hypothesis.
In order to prove the validity of this research hypothesis, we used the following research methods:
- documentation and analysis of the accounting IAS-IFRS norms that use fair value as basis
The globalization of financial markets and the internationalization of business entities constituted a challenge for accounting in supplying more relevant information for their current and potential investors. In this context of the change in the requirements of the users of financial statements, IASB developed IAS-IFRS accounting standards that recommend using the fair value to measure the main items of the financial statements. The concept of fair value was used approximately 3996 times in the content of the international accounting standards (Ristea, Jianu, 2010), in order to show that this notion can provide a connection to the reality.
IAS 16 ”Property, Plant and Equipment” is the first standard in which IASB uses
the fair value, as a tool for the measurement of tangible assets such as land, buildings, technological equipment, etc. The American body FASB defined for the first time the
notion of fair value, ever since 1976. (Dumbravă P, 2012).
Shifting from the historical cost to the fair value is a conceptual revolution in accountancy (Deaconu A., 2009).
Despite the advantages brought for the accounting information (comparability, predictive capacity, neutrality, relevance), there are voices who criticise the fair value arguing that it induces volatility in measuring the performance of the entity when it is based on assessments, because there is no functional market. In this context of the deformation of the real image of the company performance by taking into account both the results obtained as well as the results no-realized based on the data assessed using models,
users’ interest for the Profit and Loss Account decreases in favour of the Cash Flow
Statement (Bernheim.Y, 1999).
Barth (1995) enumerates three possible cases through which fair values can induce volatility in reporting company performance.
Fair value, a requirement of accounting convergence, is correct from the conceptual point of view, but from the practical point of view, it can be more hazardous than the historical cost if it is not presented adequately in explanatory notes. In the Romanian accounting, the mixed valuation model is predominant, the fair value being used only for the revaluation of frozen assets, for asset exchanges, for the goods received free of charge. The historical cost is preferred in determining the tax base in the national accounting regulations that attach importance to juridical and fiscal aspects to the detriment of economic ones.
The main criticism of the fair value is that it leads to high volatility of the income or loss by recognizing unrealized earnings (Veron, 2008). Therefore, the volatility of the comprehensive income is generated by the expansion of the use of the fair value as valuation basis.
In relation to the Romanian accounting, we cannot say that there is an expansion of the use of the fair value, due to the impediments below:
a) the existence in Romania of fiscal regulations that give priority to juridical and fiscal aspects to the detriment of economic ones;
b) the accountant’s mentality who resists novelty and does not accept chance; c) imperfect economic conditions in obtaining market information;
d) the low capacity of the Romanian accounting and of the accounting profession to apply the valuation at fair value.
5. EMPIRICAL STUDY CONCERNING THE INFORMATION RELEVANCE OF THE COMPREHENSIVEINCOMEBOTH ATAGGREGATELEVELASWELLASATINDIVIDUAL LEVELINTHEEXAMPLEOFROMANIANCOMPANIESLISTEDATTHESTOCKEXCHANGE
This chapter is allocated to research hypotheses 3 and 4. In order to achieve the objective of this chapter, the study was carried out on a sample of 18 companies(Table no.1) listed at the Bucharest Stock Exchange (BVB), between 2012 and 2015. The target population of 18 companies was taken from the sector of the enterprises listed at the stock exchange, in the industrial sector according to the rational choice principle (Jaba, 2013), in the context of the national accounting regulations (Order no. 1286/2012 of the Minister of Public Finance concerning the implementation of IFRS in individual financial statements, starting with fiscal year 2012).
The research made in this chapter is an empiric research because it aims at observing reality on the information relevance of the comprehensive income both at aggregate as well as at individual level, of its components using the example of the 18 companies whose core object is production.
With the purpose to have an adequate research method for the objective set, we resorted to the collection, analysis and interpretation of data, ”as a stage in the scientific
knowledge process” (Gilbert, A.C., 1991) concerning the value of the comprehensive
income and of its components.
For effectiveness, we coded the 18 companies include in the sample with P1, P2, ... P18. At aggregate level, the values of the comprehensive income ate not significantly different from the values of the net income at the 18 companies under observation between 2012 and 2016.
This aspect is explained by the fact that the other items of the comprehensive income are largely represented by revaluation differences. This reality of the data noticed is interesting given that the companies that were studied apply IFRS (more specifically all accounting standards, including those that generate the other items of the comprehensive income) in the individual financial statements from 2012, and in practice they partly
implement these standards, as for example IAS 16 ”Property, Plant and Equipment”.
The other accounting standards recommending the use of the fair value and that generate the other items of the comprehensive income are completely absent. More
specifically, we are talking about IAS 19 ”Employee Benefits”, IAS 21 ”The Effects of
Changes in Foreign Exchange Rates”, IAS 39 ”Financial Instruments: recognition and
Measurement” etc.
We can notice again the conservatism and also the practitioners’ inability to apply
the IFRS principles in a Romanian accountancy that is strongly connected to taxation and that cannot get market information in the context of imperfect economic conditions.
On the basis of the above-mentioned data obtained by analysing and interpreting the data on the components of comprehensive income of the companies studied, it certainly results that:
√ at aggregate level, the comprehensive income does not provide additional
relevant information compared to the net income;
√ at individual level, the other components of the comprehensive income are
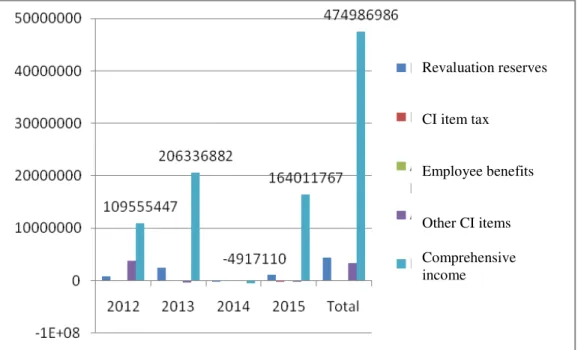
Figure no. 1 presents the weight of the other items of the comprehensive income at the level of all enterprises under observation between 2012 and 2015.
Figure. no. 1. The other items of the comprehensive income for 2012-2015
We can notice that at the level of the entire sample under observation, the revaluation differences are significant both as total value, as well as due to the message conveyed in relation to the application of IAS 16, more specifically the revaluation of tangible assets at fair value.
In conclusion: research hypothesis no. 3 is not validated and research hypothesis no. 4 is validated only for one component of the comprehensive income (revaluation differences).
6. EMPIRICAL STUDY CONCERNINGTHE VOLATILITY OFTHE COMPREHENSIVE INCOME COMPAREDTOTHEVOLATILITYOFTHENETINCOMEUSINGTHEEXAMPLEOFROMANIAN COMPANIES
The scientific approach of this chapter for testing Hypothesis no. 5 is based on the positive research and is carried out both longitudinally (for the 2012-2015 period) as well as transversally (at the level of 18 companies listed at the stock exchange that apply IFRS in individual financial statements).
In order to determine the volatility of the comprehensive and of the net income, we used statistical methods of calculating the average, absolute and relative individual deviations from the average of all companies under observation.
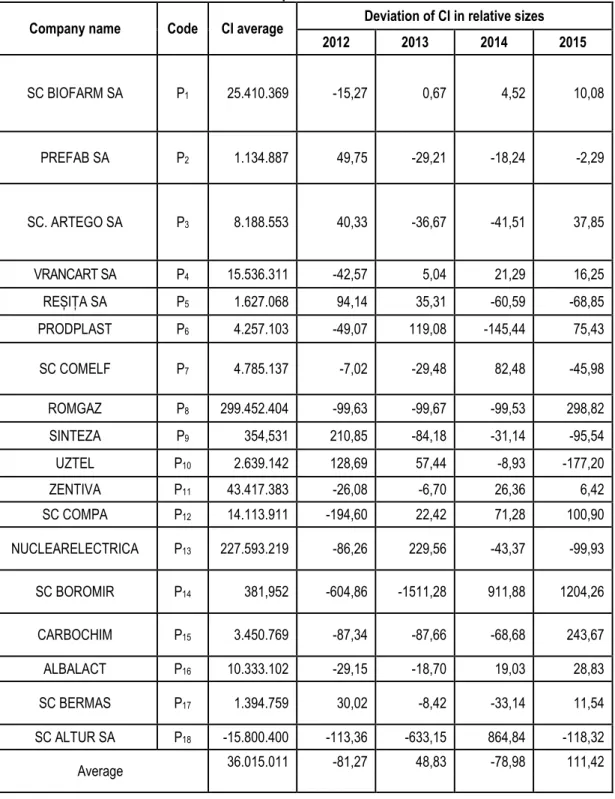
Table no. 1 shows the volatility of the comprehensive income(CI) for each and every company and per total population studied in the 2012-2015 period.
Revaluation reserves
CI item tax
Employee benefits
Other CI items
Table no. 1 Volatility of the comprehensive income of the production sector in the 2012-2015 period
Company name Code CI average Deviation of CI in relative sizes
2012 2013 2014 2015
SC BIOFARM SA P1 25.410.369 -15,27 0,67 4,52 10,08
PREFAB SA P2 1.134.887 49,75 -29,21 -18,24 -2,29
SC. ARTEGO SA P3 8.188.553 40,33 -36,67 -41,51 37,85
VRANCART SA P4 15.536.311 -42,57 5,04 21,29 16,25
REȘIȚA SA P5 1.627.068 94,14 35,31 -60,59 -68,85
PRODPLAST P6 4.257.103 -49,07 119,08 -145,44 75,43
SC COMELF P7 4.785.137 -7,02 -29,48 82,48 -45,98
ROMGAZ P8 299.452.404 -99,63 -99,67 -99,53 298,82
SINTEZA P9 354,531 210,85 -84,18 -31,14 -95,54
UZTEL P10 2.639.142 128,69 57,44 -8,93 -177,20
ZENTIVA P11 43.417.383 -26,08 -6,70 26,36 6,42
SC COMPA P12 14.113.911 -194,60 22,42 71,28 100,90
NUCLEARELECTRICA P13 227.593.219 -86,26 229,56 -43,37 -99,93
SC BOROMIR P14 381,952 -604,86 -1511,28 911,88 1204,26
CARBOCHIM P15 3.450.769 -87,34 -87,66 -68,68 243,67
ALBALACT P16 10.333.102 -29,15 -18,70 19,03 28,83
SC BERMAS P17 1.394.759 30,02 -8,42 -33,14 11,54
SC ALTUR SA P18 -15.800.400 -113,36 -633,15 864,84 -118,32
Average 36.015.011 -81,27 48,83 -78,98 111,42
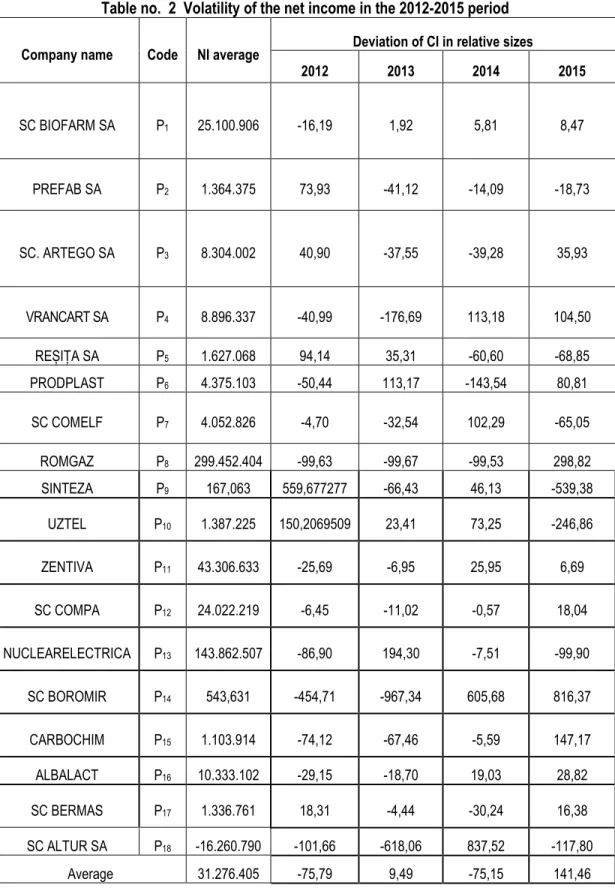
The volatility of the net income ( NI ) is calculated in Table no. 2 for each company in the
Table no. 2 Volatility of the net income in the 2012-2015 period
Company name Code NI average Deviation of CI in relative sizes
2012 2013 2014 2015
SC BIOFARM SA P1 25.100.906 -16,19 1,92 5,81 8,47
PREFAB SA P2 1.364.375 73,93 -41,12 -14,09 -18,73
SC. ARTEGO SA P3 8.304.002 40,90 -37,55 -39,28 35,93
VRANCART SA P4 8.896.337 -40,99 -176,69 113,18 104,50
REȘIȚA SA P5 1.627.068 94,14 35,31 -60,60 -68,85
PRODPLAST P6 4.375.103 -50,44 113,17 -143,54 80,81
SC COMELF P7 4.052.826 -4,70 -32,54 102,29 -65,05
ROMGAZ P8 299.452.404 -99,63 -99,67 -99,53 298,82
SINTEZA P9 167,063 559,677277 -66,43 46,13 -539,38
UZTEL P10 1.387.225 150,2069509 23,41 73,25 -246,86
ZENTIVA P11 43.306.633 -25,69 -6,95 25,95 6,69
SC COMPA P12 24.022.219 -6,45 -11,02 -0,57 18,04
NUCLEARELECTRICA P13 143.862.507 -86,90 194,30 -7,51 -99,90
SC BOROMIR P14 543,631 -454,71 -967,34 605,68 816,37
CARBOCHIM P15 1.103.914 -74,12 -67,46 -5,59 147,17
ALBALACT P16 10.333.102 -29,15 -18,70 19,03 28,82
SC BERMAS P17 1.336.761 18,31 -4,44 -30,24 16,38
SC ALTUR SA P18 -16.260.790 -101,66 -618,06 837,52 -117,80
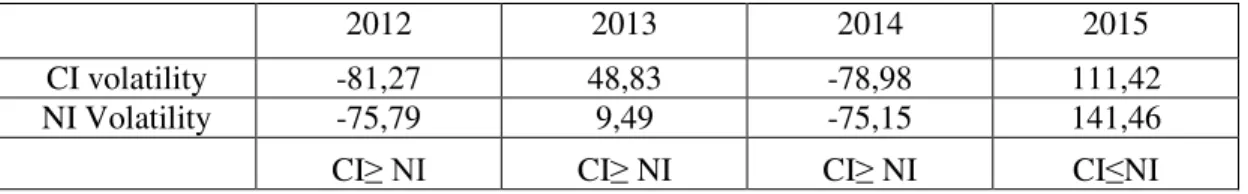
With the help of the comparative method and of the values of the relative deviations calculated at sample level, we determined which of the two incomes is more volatile for each fiscal year (Table no. 3).
Table no. 3. Comparative analysis of the volatility of the comprehensive income vs the volatility of the net income in the 2012-2015 period using the example of the production
sector ≥
2012 2013 2014 2015
CI volatility -81,27 48,83 -78,98 111,42
NI Volatility -75,79 9,49 -75,15 141,46
CI≥ NI CI≥ NI CI≥ NI CI≤NI
We can see that in the 2012-2014 period, the comprehensive income is more
volatile than the net income. (CI≥ NI). In 2015, the situation is reversed.
In conclusion, research hypothesis no. 5 is nit validated throughout the entire period studied, i.e. 2012-2015.
7.CONCLUSIONS
The results of the documentation reveal that there are both supporters and critics of the comprehensive income, and many times the balance tilts in favour of the net income, especially in relation to the predictive capacity of the latter.
In relation to the review carried out in the IASB-FASB convergence programme,
by introducing a new financial statement, the statement of the comprehensive income, we
believe that this review is not a revolution, but a mere compromise between the priority
given to the balance sheet and that given to the profit and loss account.
The comprehensive income maintains the usefulness of the balance sheet as well as that of the profit and loss account. The net result is maintained in the structure of the comprehensive income, as being the most adequate indicator of the current performance of the enterprise.
In conclusion, although it is volatile, the fair value accounting could
however play a certain role in the recovery of financial markets.
More specifically, from the application presented on the sample of Romanian
companies listed at the stock exchange - in the production sector – we can notice that in
the 2012-2014 period, the comprehensive income is more volatile than the net income.(
CI≥ NI), while in 2015, the situation is reversed.
The relevance of the comprehensive income compared to the net income in measuring performance cannot be proved when volatile items have insignificant values or are even absent. However, we believe that a normative request to present two measures of the earnings per share (overall and net) could stimulate the users of the financial statements to carry out much more rigorous financial analyses.
REFERENCES
1. Albu C., Mustață R. Research in Accounting in Emerging Economies-Accounting
in Central and Eastern Europe, vol.13, Bingley: Emerald Group Publishing Limited; 2013
2. Belkaoui A.R. Accounting Theory, Ed. Thomson , SUA;2004
3. Bricker R. Toward Understanding Academic Research Accounting, CPA Journal online February , 1993,
4. Bernheim Y. L'essentiel des US GAAP, Mazars &Guerard Publishing House, Paris, 1999
5. Barth M. Fair Values and Financial Statements Volatility, in The Market Discipline Across Countries and Industries, Cambridge, Massachusetts: MIT Press, 2004
6. Barrneto P. Les normes IAS-IFRS: Application aux états financiers, Dunod; 2004,
7. Bourguignon A. Peut on définir la performance ?, Revue Française de Comptabilité, 1995
8. Barth M., Clinch G. Revalued financial, tangibile and intangibile assets:associations with share prices and non market-based estimates, Journal of Accounting Research, 1998
9. Casta J.F., Colasse B. Juste valeur –Enjeux techniques et politiques, Economica, Paris, 2000
10. Capron M,
Quairel-Lanoizelee F. Evaluer les stratégies de développment durable des entreprises :l'utopie mobilisatrice de la performance globale, Journée Développement Durable-AIMS-IAE d'Aix-en Provence ,2006
11. Caplow T. L’Enquête sociologique, Armand Colin, 1970
12. Deaconu, A. Valoarea justă, concept contabil , Editura Economică București ; 2009.
13. Dumbravă P., Csongor
C., Popa I, Fătăcean G. Historical cost versus fair value on the tangible assets, Accounting and Auditing Perspectives, Timisoara, Romania, 1st International Conference; 2012
14. Feltham G., Ohlson J. Valuation and Clean Surplus Accounting for Operating and Financial Activities, Contemporary Accounting Reseach, Spring, Vol.11, no.2, 2008
15. Gilbert A.C Marketing Research, The Dryden Press, Orlando, USA, 1991 16. Jaba, E., Mironiuc, M.,
Roman, M., Robu, I-B. & Robu, M-A.
The Statistical Assessment of an Emerging Capital Market Using the Panel Data Analysis of the Financial Information, Economic Computation and Economic Cybernetics Studies and Research, vol. 47, no. 2/2013
17. Hans Selye De la vis la descoperire, Despre omul de știință, Editura medicală ; 1968
18. Mahieu F. TripleBottom Line Reporting , Groupe One, SEE
Management Files; 2002
19. Niculescu M. Diagnostic financiar, Editura Economică, Bucureşti; 2005
21. Richard J. Analyse financieré et audit des performances, Ed. La Villeguérin, Paris; 1993
22. Ristea M., Jianu I Accounting and Management Informations Systems, Vol.9, No.3, 2010
23. Veron N. Fair Value Accounting is the wrong Scapegot for the Crisis Accounting on Europe Vol.5 No.2, pp 63-69, 2008
24. Watts R., Zimmerman J.L
Positive Accounting Theory: A ten year perspective, The Accounting Review, vol.65, no.1 , .1990
www.ceccar.ro
www.companyspotlight
www.cpaclass.com
www.duffandphelps.com
www.fasb.org.
www.iasb.org
www.iasplus.com