American Journal of Animal and Veterinary Sciences 5 (2): 117-120, 2010 ISSN 1557-4555
© 2010 Science Publications
Corresponding Author: H.E. Mohamed, Department of Animal Production, College of Food and Agricultural Sciences, King Saud University, P.O. Box 2460, Riyadh 11451, Kingdom of Saudi Arabia
Tel: +966 14678475 Fax: +966 14678474 117
Nephrocalcinosis in Female Rats Fed Diets Containing
Either Pectin, Galacturonic Acid or Glucose
H.E. Mohamed, A. Alhaidary and A.C. Beynen
Department of Animal Production, College of Food and Agricultural Sciences,
King Saud University,P.O. Box 2460, Riyadh 11451,Kingdom of Saudi Arabia
Abstract: Problem statement: In our earlier study, dietary pectin has been shown to promote nephrocalcinosis in rats when compared with the feeding of cellulose. It was not known whether this pectin effect relates to its structure or to its monosaccharide component, galacturonic acid.
Approach: The effects of dietary pectin, galacturonic acid and glucose on kidney calcification were studied in female rats. The purified diets used had similar concentrations of calcium, magnesium and phosphorus. Results: It was confirmed that the feeding of pectin (10%, w/w) versus cellulose in diets containing 0.4% phosphorus results in significantly greater calcium and phosphorus concentrations in kidney. The new finding was that pectin had a nephrocalcinogenic effect when compared with either galacturonic acid or glucose. Conclusion: The stimulatory effect of pectin on the development of nephrocalcinosis is specific and is related to its structure rather than to its galacturonic acid component.
Key words: Rats, nephrocalcinosis, diet, pectin, galacturonic acid
INTRODUCTION
We have shown that the type of fiber influences nephrocalcinogenesis in female rats: Substitution of pectin for cellulose in a diet containing 0.4% phosphorus increased the severity of nephrocalcinosis (Alhaidary et al., 2010). The major aim of this study was to see whether the effect of pectin is related either to its structure or to its major component, galacturonic acid, which may be released in the gut during bacterial degradation of pectin. It could be argued that the earlier observed (Alhaidary et al., 2010) nephrocalcinogenic effect of pectin might be indirect and non-specific because it may represent an inhibitory effect of cellulose which was used as control fiber. Thus, in this study we also compared the effects of pectin and glucose in order to find out whether pectin itself has a true stimulatory influence on nephrocalcinosis. For comparison with our previous study (Alhaidary et al., 2010), the balances of calcium, phosphorus and magnesium were also determined in this study.
MATERIALS AND METHODS
Animals, housing and diets: The strain, sex and age of the rats used in this study were identical to those in our earlier study and so were the experimental design and housing (Alhaidary et al., 2010).
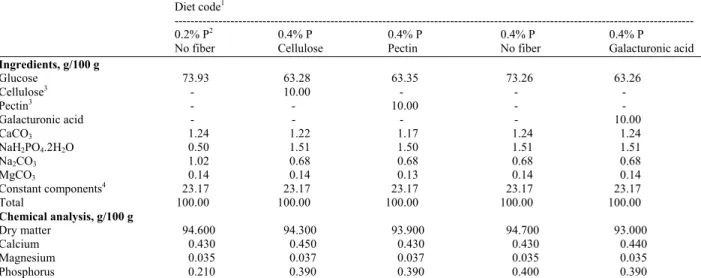
Table 1 shows the diets that were used. The low-phosphorus diet, which also served as pre-experimental diet, contained 0.2% (w/w) phosphorus and glucose (Morsweet 01934; Cerestar, Haubourdin, France). This fiber-free diet was the negative control diet as it was expected not to induce nephrocalcinosis (Mars et al., 1988). To check the reproducibility of the fiber effect seen earlier (Alhaidary et al., 2010), there were 0.4%-phosphorus diets with either 10% cellulose (Arbocel B800; J. Rettenmeier and Söhne, Ellwangen, Germany) or 10% pectin (Medium Rapid Set 150o SAG, Gelifiant pectin E 440a, Unipectine SA, 35600 Redon, France). In addition, the effect of fiber structure versus fiber components was studied. Therefore, using a fiber-free diet with 0.4% phosphorus, 10% of the glucose component was replaced by galacturonic acid (D-galactopyranuronic acid; Pfanstiehl Laboratories Inc, Waukegan, IL). The galacturonic acid and glucose preparations did not contain detectable amounts of calcium, magnesium and phosphorus. The diets were formulated so that they contained similar concentrations of minerals (Table 1).
American J. Animal & Vet. Sci., 5 (2): 117-120, 2010
118
Table 1: Composition of the experimental diets
Diet code1
---
0.2% P2 0.4% P 0.4% P 0.4% P 0.4% P
No fiber Cellulose Pectin No fiber Galacturonic acid
Ingredients, g/100 g
Glucose 73.93 63.28 63.35 73.26 63.26
Cellulose3 - 10.00 - - -
Pectin3 - - 10.00 - -
Galacturonic acid - - - - 10.00
CaCO3 1.24 1.22 1.17 1.24 1.24
NaH2PO4.2H2O 0.50 1.51 1.50 1.51 1.51
Na2CO3 1.02 0.68 0.68 0.68 0.68
MgCO3 0.14 0.14 0.13 0.14 0.14
Constant components4 23.17 23.17 23.17 23.17 23.17
Total 100.00 100.00 100.00 100.00 100.00
Chemical analysis, g/100 g
Dry matter 94.600 94.300 93.900 94.700 93.000
Calcium 0.430 0.450 0.430 0.430 0.440
Magnesium 0.035 0.037 0.037 0.035 0.035
Phosphorus 0.210 0.390 0.390 0.400 0.390
1: Calculated concentrations of phosphorus (P); 2: Pre-experimental diet; 3: Mineral composition of the fibers used is given elsewhere
(Alhaidary et al., 2010); 4: The composition of the constant components, vitamin and mineral premix has been described (Alhaidary et al., 2010)
Statistical analysis: To evaluate differences between selected diet groups, Student’s t-test was used. The increased probability of the type I error due to multiple comparisons was addressed by pre-setting the criterion of significance at p<0.025 or p<0.017. After verifying that the distribution of the data was normal (Kolomogorov-Smirnov test), Pearson linear (r) correlation coefficients were calculated for the relationship between nephrocalcinosis scores and kidney calcium concentrations. The histological scores of different diet groups were compared with Mann-Whitney U-test. A p-value<0.05 was used as the level of statistical significance. The analyses were carried out with the SPSS/PC software package (SPSS Inc, Chicago, USA).
RESULTS
Body weights, relative liver weight and feed and water intake did not differ significantly between the dietary groups (Table 2). Immediately after transferring the animals to the experimental diets, the rats fed the diet with galacturonic acid developed diarrhea. This had disappeared after another three days. Pectin versus cellulose and galacturonic acid versus glucose significantly increased relative cecum weight.
As would be expected (Mars et al., 1988), the fiber-free diet with 0.2% phosphorus did not cause nephrocalcinosis. The diets with 0.4% phosphorus induced nephrocalcinogenesis as assessed either chemically or histologically. Dietary pectin, when compared with cellulose, produced a significant increase in the concentrations of calcium, magnesium
and phosphorus in kidney (Table 2). The severity of nephrocalcinosis in rats fed pectin as based on histological scores was also significantly increased. Dietary cellulose and glucose in the 0.4%-phosphorus diet did not differently affect nephrocalcinogenesis. Galcaturonic acid in the diet tended to be more nephrocalcinogenic than glucose but produced significantly lower calcinosis scores than pectin. Kidney calcium concentrations and nephrocalcinosis scores of individual rats were strongly associated (r = + 0.94; N = 40; p<0.001).
The concentrations of calcium, magnesium and phosphorus in plasma were not differently influenced by the dietary treatments (Table 2). In the cellulose-fed rats, plasma urea concentrations were significantly higher than in their counterparts fed pectin. This cellulose effect was also seen when the fiber was added to the diet at the expense of glucose.
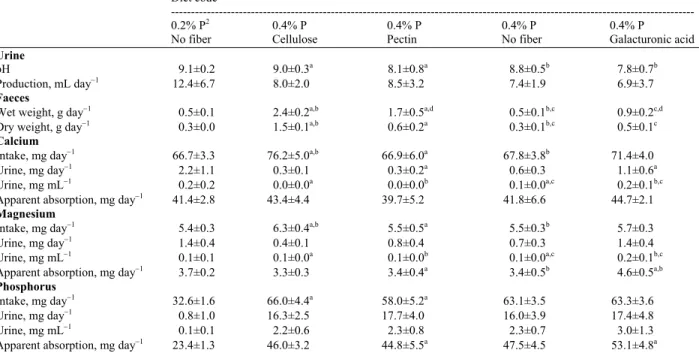
Fecal dry matter production was significantly lower in rats fed pectin compared with those fed cellulose (Table 3). Galacturonic acid versus glucose increased feces production. Pectin versus cellulose and galacturonic acid versus glucose produced a lowering of urinary pH.
American J. Animal & Vet. Sci., 5 (2): 117-120, 2010
119
Table 2: Growth performance, plasma mineral concentrations and nephrocalcinosis in rats fed the experimental diets
Diet code1
---
0.2% P2 0.4% P 0.4% P 0.4% P 0.4% P
No fiber Cellulose Pectin No fiber Galacturonic acid
Body weight, g
Initial, day 0 92.0±9.2 92.1±8.4 92.1±9.1 92.1±8.6 92.1±8.1
Final, day, 28 155.5±15.4 162.9±13.2 157.8±9.8 167.8±15.2 152.6±13.7
Relative liver weight, % 4.1±0.2 3.9±0.2 3.9±0.2 4.1±0.2 4.2±0.3
Relative cecal weight, % 0.8±0.2 1.1±0.3a 2.2±0.4a 0.8±0.2b 1.7±0.4b
Intake
Feed, g/28 days 314.9±24.4 347.8±30.4 311.7±26.3 325.2±25.4 307.9±18.8
Water, mL/28 days 582.0±158.0 460.7±55.0 464.1±72.1 444.0±76.6 415.4±75.3
Plasma concentrations
Calcium, mg/100 mL 10.8±0.3 10.4±0.5 10.1±0.3 10.5±0.5 10.4±0.4
Magnesium, mg/100 mL 1.9±0.2 1.6±0.3 1.8±0.2 1.7±0.3 1.8±0.2
Phosphorus, mg/100 mL 48.7±8.4 49.7±6.4 53.5±3.4 53.2±7.2 53.9±6.1
Urea, mmol L−1 5.9±1.1 6.7±0.7a,b 5.6±0.6a 5.9±0.4b 5.6±0.4
Kidney measures
Relative weight, % (g/100 g body weight) 0.4±0.0 0.4±0.1 0.5±0.1 0.4±0.0 0.4±0.1
Dry weight, mg 125.3±11.7 148.0±29.4 181.2±33.9 138.6±14.2 152.1±38.4
Calcium, % of dry weight 0.0±0.0 2.2±2.7a 6.5±3.0a 1.9±1.9 3.7±3.0
Magnesium, % of dry weight 0.1±0.0 0.1±0.0a 0.2±0.1a 0.1±0.0 0.2±0.1
Phosphorus, % of dry weight 1.2±0.0 2.2±1.1a 4.0±1.3a 2.3±1.0 3.0±1.3
Histological score 0.0±0 2.0±1a 3.0±0a,b 2.0±1 2.0±1b
Values are means ± SD for 8 rats per dietary group. Values within the same row sharing the same superscript are significantly different
(p<0.025). 1: Calculated concentrations of phosphorus (P); 2: Pre-experimental diet
Table 3: Mineral excretion and absorption in rats fed the experimental diets
Diet code1
---
0.2% P2 0.4% P 0.4% P 0.4% P 0.4% P
No fiber Cellulose Pectin No fiber Galacturonic acid
Urine
pH 9.1±0.2 9.0±0.3a 8.1±0.8a 8.8±0.5b 7.8±0.7b
Production, mL day−1 12.4±6.7 8.0±2.0 8.5±3.2 7.4±1.9 6.9±3.7
Faeces
Wet weight, g day−1 0.5±0.1 2.4±0.2a,b 1.7±0.5a,d 0.5±0.1b,c 0.9±0.2c,d
Dry weight, g day−1 0.3±0.0 1.5±0.1a,b 0.6±0.2a 0.3±0.1b,c 0.5±0.1c
Calcium
Intake, mg day−1 66.7±3.3 76.2±5.0a,b 66.9±6.0a 67.8±3.8b 71.4±4.0
Urine, mg day−1 2.2±1.1 0.3±0.1 0.3±0.2a 0.6±0.3 1.1±0.6a
Urine, mg mL−1 0.2±0.2 0.0±0.0a 0.0±0.0b 0.1±0.0a,c 0.2±0.1b,c
Apparent absorption, mg day−1 41.4±2.8 43.4±4.4 39.7±5.2 41.8±6.6 44.7±2.1
Magnesium
Intake, mg day−1 5.4±0.3 6.3±0.4a,b 5.5±0.5a 5.5±0.3b 5.7±0.3
Urine, mg day−1 1.4±0.4 0.4±0.1 0.8±0.4 0.7±0.3 1.4±0.4
Urine, mg mL−1 0.1±0.1 0.1±0.0a 0.1±0.0b 0.1±0.0a,c 0.2±0.1b,c
Apparent absorption, mg day−1 3.7±0.2 3.3±0.3 3.4±0.4a 3.4±0.5b 4.6±0.5a,b
Phosphorus
Intake, mg day−1 32.6±1.6 66.0±4.4a 58.0±5.2a 63.1±3.5 63.3±3.6
Urine, mg day−1 0.8±1.0 16.3±2.5 17.7±4.0 16.0±3.9 17.4±4.8
Urine, mg mL−1 0.1±0.1 2.2±0.6 2.3±0.8 2.3±0.7 3.0±1.3
Apparent absorption, mg day−1 23.4±1.3 46.0±3.2 44.8±5.5a 47.5±4.5 53.1±4.8a
Values are means ± SD for 8 rats per dietary group. Values within the same row sharing the same superscript are significantly different
(p<0.025). 1: Calculated concentrations of phosphorus (P); 2: Pre-experimental diet
The diet containing pectin did not influence urinary phosphorus concentration and phosphorus absorption.
Cellulose structure effects were assessed by comparing diets containing either no fiber or cellulose. Cellulose structure tended to have an inhibitory effect
American J. Animal & Vet. Sci., 5 (2): 117-120, 2010
120 influencing absolute apparent phosphorus absorption (Table 3).
Galacturonic acid, when compared with glucose, significantly increased urinary calcium excretion and calcium concentrations in urine (Table 3). Galacturonic acid also caused increased urinary magnesium excretion, which was associated with a significantly decreased fecal magnesium output (not shown). As a result, apparent magnesium absorption (Table 3) and retention (not shown) were increased in the group fed galacturonic acid instead of glucose. Replacement of glucose by galacturonic acid significantly lowered phosphorus excretion with feces (not shown) and increased apparent phosphorus absorption (Table 3).
DISCUSSION
The nephrocalcinogenic activity of pectin probably lies in its structure rather than in its basic building block, galacturonic acid. Pectin produced higher group mean kidney concentrations of calcium and phosphorus and also induced significantly higher nephrocalcinosis scores than did galacturonic acid. Cellulose and glucose in the diet, on the other hand, induced similar degrees of nephrocalcinosis. Thus, the amount of dietary fiber in the form of cellulose did not influence the development of kidney calcification. This further substantiates that the effect of pectin versus cellulose is rather specific and that it is not an apparent effect due to inhibition of nephrocalcinogenesis by cellulose or glucose.
In our previous study (Alhaidary et al., 2010), we found that dietary pectin versus cellulose significantly raised urinary phosphorus concentrations. Because high intakes of phosphorus stimulate nephrocalcinogenesis (Mars et al., 1988; Ritskes-Hoitinga et al., 1989; 1991), it was suggested that pectin induces nephrocalcinosis through raising the concentration of phosphorus in urine. However, in this study pectin did not affect urinary phosphorus concentration. In agreement with our previous study (Alhaidary et al., 2010), the nephrocalcinogenic effect of pectin was not associated with a change in the availability of phosphorus, magnesium and/or calcium from the diet.
Dietary pectin versus cellulose significantly lowered the urinary pH and so did dietary galacturonic acid versus glucose. Acidification of urine is associated with inhibition of nephrocalcinogenesis (Van Camp et al., 1990; Kootstra et al., 1991). However, in this study, a decrease in urinay pH was rather associated with more nephrocalcinosis. Thus, the observed effect of dietary pectin on the development of
nephrocalcinosis may have been dampened by its effect on urinary pH.
CONCLUSION
Pectin has a specific stimulatory effect on nephrocalcinogenesis in female rats. This pectin effect is related to the structure of the fiber rather than to its galacturonic acid component. Unlike our previous study (Alhaidary et al., 2010), the present study shows that dietary pectin did not influence urinary phosphorus concentrations.
REFERENCES
Alhaidary, A., H.E. Mohamed and A.C. Beynen, 2010. Nephrocalcinosis in female rats fed diets containing either pectin or cellulose. Am. J. Anim. Vet. Sci., 5: 104-109.
Kootstra, Y., J. Ritskes-Hoitinga, A.G. Lemmens and A.C. Beynen, 1991. Diet-induced calciuria and nephrocalcinosis in female rats. Int. J. Vit. Nutr. Res., 61: 100-101. PMID: 1856039
Mars, Y.W.H.M., A.G. Lemmens and A.C. Beynen, 1988. Dietary phosphorus and nephrocalcinosis in female rats. Nutr. Rep. Int., 38: 249-258.
Ritskes-Hoitinga, J., A.G. Lemmens, L.H.J.C. Danse and A.C. Beynen, 1989. Phosphorus-induced nephrocalcinosis and kidney function in female rats. J. Nutr., 119: 1423-1431. PMID: 2585132 Ritskes-Hoitinga, J., J.N.J.J. Mathot, L.H.J.C. Danse
and A.C. Beynen, 1991. Commercial rodent diets and nephrocalcinosis in weanling female rats. Lab. Anim., 25: 126-132. PMID: 1857094