829
LEPTIN AND GLUCOCORTICOID SIGNALING PATHWAYS IN THE HYPOTHALAMUS OF FEMALE AND MALE FRUCTOSE-FED RATS
DANIJELA VOJNOVIĆ MILUTINOVIĆ*, MARINA NIKOLIĆ, JOVANA DINIĆ, ANA ĐORĐEVIĆ,
NATAŠA VELIČKOVIĆ, IVANA ELAKOVIĆ, GORDANA MATIĆ and JELENA NESTOROV
Department of Biochemistry, Institute for Biological Research “Siniša Stanković”, University of Belgrade,
11060 Belgrade, Serbia.
Abstract -
Alterations in leptin and glucocorticoid signaling pathways in the hypothalamus of male and female rats subjected to a fructose-enriched diet were studied. he level of expression of the key components of the leptin signal-ing pathway (neuropeptide Y /NPY/ and suppressor of cytokine signalsignal-ing 3 /SOCS3/), and the glucocorticoid signalsignal-ing pathway (glucocorticoid receptor /GR/, 11β-hydroxysteroid dehydrogenase type 1 /11βHSD1/ and hexose-6-phosphate dehydrogenase /H6PDH/) did not difer between fructose-fed rats and control animals of both genders. However, in fe-males, a fructose-enriched diet provoked increases in the adiposity index, plasma leptin and triglyceride concentrations, and displayed a tendency to decrease the leptin receptor (ObRb) protein and mRNA levels. In male rats, the fructose diet caused elevations in plasma non-esteriied fatty acids and triglycerides, as well as in both plasma and hypothalamic leptin concentrations. Our results suggest that a fructose-enriched diet can induce hyperleptinemia in both female and male rats, but with a more pronounced efect on hypothalamic leptin sensitivity in females, probably contributing to the observed development of visceral adiposity.Key words: Fructose diet, hypothalamus, leptin, leptin receptor, glucocorticoids, glucocorticoid receptor
INTRODUCTION
Over the past decades there was a general trend to-wards an increased total energy intake due to use of high-fructose corn syrup in sot-drinks, which was followed by the increased prevalence of obesity and metabolic syndrome worldwide (Bray, 2008). It has been shown that a long-term fructose-enriched diet may lead to metabolic and cardiovascular dis-turbances, including dyslipidemia, insulin resist-ance, hypertension, hyperuricemia and weight gain (Tappy and Le, 2010). Additionally, as a highly lipogenic sugar, fructose leads to increased plasma non-esteriied fatty acid (NEFA), leptin and adi-ponectin levels, as well as to abdominal adiposity
and impaired insulin sensitivity (Melanson et al., 2008).
insu-lin resistance (Horton et al., 1997; Riant et al., 2009). Besides, male rats are more prone to diet-induced hypertension and hyperinsulinemia (Roberts et al., 2001), while female rats develop these symptoms only ater ovariectomy (Galipeau et al., 2002).
he hypothalamus is the key site for regulation of food intake, body weight and energy expenditure (Morton et al., 2006). Leptin is a hormone secreted by adipose tissue, and is known to reduce food in-take and stimulate energy expenditure (Friedman and Halaas, 1998). In the hypothalamus, leptin sup-presses food intake by modulating the synthesis and secretion of both orexigenic and anorexigenic pep-tides. Leptin acts through the leptin receptor (ObR). Five alternatively spliced isoforms of the receptor dif-fer in the length of the C-terminus and the long form (ObRb) is capable of activating intracellular signal-ing (Myers et al., 2008). By bindsignal-ing to ObRb, leptin stimulates tyrosine phosphorylation of Janus kinase 2 (JAK2), which then phosphorylates and activates the signal transducer and activator of transcription 3 (STAT3). Ater dimerization, activated STAT3 trans-locates to the nucleus and stimulates gene transcrip-tion. Leptin may also lead to the inhibition of its own signaling pathway through feedback inhibitors, such as the suppressor of cytokine signaling 3 (SOCS3) (Myers et al., 2008).
Obesity is frequently associated with elevated plasma leptin concentrations and leptin resistance (Oswal and Yeo, 2010). Leptin resistance is charac-terized by a decreased expression of ObRb, JAK2 and STAT3, as well as with increased expression of SOCS3 in the hypothalamus (Howard and Flier, 2006). Additionally, an impaired leptin transport across the blood-brain barrier may contribute to the development of leptin resistance. Available data from diet-induced obesity in rodents strongly suggest that central leptin resistance contributes to the develop-ment of obesity (Schwartz et al., 1996).
Glucocorticoids are important metabolic regula-tors of glucose availability and energy balance. Over the past decades, it has been shown that glucocorti-coid excess is causatively linked to obesity and
meta-bolic syndrome (Vegiopoulos and Herzig, 2007). Glucocorticoids afect appetite indirectly, through inluencing the levels of other hormones and neu-rotransmitters, such as orexigenic neuropeptide Y (NPY), Agouti-related protein (AgRP) and anorexi-genic proopiomelanocortin (POMC) (Shimizu et al., 2008). In the hypothalamus, glucocorticoids coun-teract the anorexigenic actions of leptin and insulin, and interplay between these hormones is crucial for metabolic homeostasis (Vegiopoulos and Herzig, 2007). At the molecular level, glucocorticoids exert their physiological efects through binding to the glucocorticoid receptor (GR), which belongs to the nuclear receptor superfamily of transcription factors. he intracellular concentration of glucocorticoids is determined not only by their plasma levels, but also by the activity of 11β-hydroxysteroid dehydrogenase type 1 (11βHSD1), the enzyme which catalyzes the intracellular conversion of inactive glucocorticoids to active forms (Seckl et al., 2004).
Considering the link between increased fructose intake and the growing rate of metabolic disturbanc-es, including obesity and metabolic syndrome, as well as gender diferences in the susceptibility and pro-gression of these disturbances, the objective of this study was to examine alterations in leptin and gluco-corticoid signaling in the hypothalamus of male and female rats subjected to a fructose-rich diet.
MATERIALS AND METHODS
Animals and treatment
calculated as the sum of calories ingested as food and liquid. All animal procedures complied with the EEC Directive (86/609/EEC) on the protection of animals used for experimental and other scientiic purposes, and were approved by the Ethical Committee for the Use of Laboratory Animals of the Institute for Biological Research “Siniša Stanković”, University of Belgrade.
Blood plasma preparation, tissue collection and determination of plasma parameters
Animals were sacriiced by rapid decapitation af-ter overnight fasting. Immediately aaf-ter decapitation, visceral omental adipose tissue and hypothalamus were carefully isolated, weighed and frozen in liquid nitrogen for subsequent processing. Adiposity index (%) was calculated as [(adipose tissue mass/body mass) x 100].
Trunk blood was rapidly collected into EDTA containing tubes and the triglyceride concentration in the blood was measured on site by MultiCare strips (Biochemical Systems International, Italia). Plasma was obtained by centrifugation at 1600 x g for 10 min at room temperature and stored at -70ºC. he plasma level of non-esteriied fatty acids (NEFA) was determined using a modiied version of Duncombe’s method (Duncombe, 1964). Leptin concentrations in both plasma and hypothalamic tissue were deter-mined by Rat Leptin ELISA Kit (EZRL-83K, Milli-pore), according to the manufacturer’s instructions. Absorbance at 450 nm (reference 650 nm) was read using a plate reader (Multiskan Spectrum, hermo Electron Corporation, Finland). he data were itted by 4PL curve (RedaerFit Sotware, MiraiBio Group of Hitachi Solutions America, Ltd.) and leptin con-centration is expressed in ng/ml for plasma samples, and in ng/mg of protein for tissue samples.
Preparation of hypothalamic whole cell extracts
Hypothalami from 3 animals were pooled and ho-mogenized in 4 vol. (w/v) of RIPA bufer (25 mM Tris, pH 7.4, 150 mM NaCl, 1% Nonidet NP40, 0.1% SDS, 2 mM DTT, 1 mM EDTA-Na2, protease and
phosphatase inhibitors) using a glass/telon (Potter-Elveiheim) homogenizer. he homogenates were sonicated on ice (3 x 10 s at 10 MHz, Hielscher Ultra-sound Processor) and incubated 60 min at 00C prior
to 20 min centrifugation at 14000 x g. he resulting supernatants were stored at -700C. Protein content
was determined according to Spector (1978).
SDS-PAGE and immunoblotting
Proteins were resolved on 7.5% SDS-polyacrylamide gels using Mini-Protean II Electrophoresis Cell (Bio-Rad Laboratories, Hercules, CA). Transfer of proteins from acrylamide gels to PVDF membranes (Immobilon-FL, Millipore) was performed in 25 mM Tris bufer, pH 8.3 containing 192 mM glycine and 20% (v/v) methanol, at 135 mA overnight in Mini Trans-Blot Electrophoretic Transfer Cell (Bio-Rad Laboratories, Hercules, CA). he membranes were blocked by phosphate-bufered saline (PBS, 1.5 mM KH2PO4, 6.5 mM Na2HPO4, 2.7 mM KCl, 0.14 M
NaCl, pH 7.2) containing 2% non-fat dry milk for 90 min at room temperature. Ater extensive wash-ing (PBS containwash-ing 0.1% Tween20), membranes were incubated overnight at 4ºC with respective pri-mary antibodies: rabbit polyclonal anti-leptin recep-tor (ab5593, Abcam), rabbit polyclonal anti-GR (sc-1004, Santa Cruz Biotechnology), rabbit polyclonal anti-11β-HSD1 (ab109554, Abcam), rabbit polyclo-nal anti-H6PD (sc-67394, Santa Cruz Biotechnol-ogy) and mouse monoclonal anti-β-actin (AC-15, Sigma-Aldrich), which was used as an equal load-ing control. Ater extensive washload-ing, all membranes were incubated with alkaline phosphatase conju-gated secondary antibodies (Amersham Pharmacia Biotech, 1:20000). he immunoreactive proteins were visualized by an enhanced chemiluorescence method (ECF, Amersham Pharmacia Biotech, UK) and quantitative analysis was performed by Image-Quant sotware (GE Healthcare, USA).
RNA isolation and Reverse Transcription
Total hypothalamic RNA was isolated using TRIrea-gent® (AmBion). RNA was dissolved in RNase-DNase
pu-rity were tested spectrophotometrically (OD 260/280 > 1.8 was considered satisfactory). RNA integrity was conirmed by 1% agarose gel electrophoresis. RNase inhibitor (Applied Biosystems) was added and the samples were frozen at -80˚C until use. Prior to cDNA synthesis, DNA contamination was removed by DNase I treatment (Fermentas). cDNA was syn-thesized from 2 µg of RNA. Reverse transcription was performed using High-Capacity cDNA Reverse Transcription Kit (Applied Biosystems), according to the manufacturer’s instructions, and cDNA was stored at -80˚C until use.
Real-time PCR
Quantiication of ObR, GR, NPY and SOCS3 mRNA levels in the hypothalamus was performed by TaqMan®
Real Time PCR. Primers and probes for GR, ObRb, NPY and SOCS3 (Rn01433205_m1, Rn00561369_ m1, Rn01410145_m1 and Rn00585674_s1, respec-tively) were obtained from Applied Biosystems Assay-on-Demand Gene Expression Products. TBP (Rn01455646_m1) was used as a previously vali-dated endogenous control. Real-time PCR was per-formed using the ABI Prism 7000 Sequence Detec-tion System (Applied Biosystems) in a total volume of 25 μl containing 1× TaqMan® Universal Master
Mix with AmpErase UNG, 1× Assay Mix (Applied Biosystems) and the cDNA template (20 ng of RNA converted to cDNA) at cycle conditions: 95˚C for 10 min, followed by 40 cycles at 95˚C for 15 s and 60˚C for 90 s. No template control was used in each run. All reactions were run in triplicate. Relative quantii-cation of target genes was performed using the com-parative 2−ΔΔCt method (Livak and Schmittgen, 2001).
he obtained results were analyzed by Sequence De-tection Sotware version 1.2.3 for 7000 System SDS Sotware RQ Study Application (Applied Biosystem) with a conidence level of 95 % (p ≤ 0.05).
Statistical analyses
Statistical analyses were performed using Prism sot-ware 5.00 (GraphPad, San Diego, CA, USA) and SPSS 13.0 for Windows (SPSS Inc., Chicago, IL). To ana-lyze the efects of two factors, gender and fructose,
as well as their interaction, we performed two-way ANOVA, followed by the Bonferroni post hoc test. he results are expressed as mean ± SD for biochemi-cal and hormonal parameters, and as mean ± SEM for data from Western blot analysis and qPCR. Anal-ysis of covariance (ANCOVA) was used to evaluate between-group diferences in plasma leptin levels af-ter adjusting for body mass. Values were considered statistically signiicant when the P value was less than 0.05.
RESULTS
Body parameters of male and female fructose-fed rats
Daily food and liquid intake was measured during 9 weeks of treatment. Two-way ANOVA revealed the signiicant efects of gender and fructose on ca-loric intake (Table 1). Subsequent post-hoc analyses showed that the caloric intake of both female and male fructose-fed rats was signiicantly increased in comparison to the rats of the same gender on stand-ard diet (Table 1, P<0.05 for males and females, con-trol vs. fructose).
Two-way ANOVA analysis showed a signiicant efect of gender on body mass and signiicant efects of both factors, gender and fructose on visceral adi-pose tissue mass and adiposity index (Table 1). Post-hoc analysis showed a signiicant diference in body mass between males and females in both control and fructose-fed groups (Table 1, *P<0.05 control males vs. control females, ##P<0.01 fructose-fed males vs.
fructose-fed females). Visceral adipose tissue mass and adiposity index were signiicantly increased in fructose-fed females in comparison to the control female group (Table 1, P<0.05). he adiposity in-dex was also signiicantly higher in fructose-fed fe-male rats compared to fructose-fed fe-males (Table 1,
#P<0.05).
Plasma levels of triglycerides and NEFA in male and female fructose-fed rats
efect of gender on plasma NEFA concentrations (Table 1). Increased triglycerides were observed in both female and male fructose-fed rats in compari-son to control ones (Table 1, P<0.01, fructose-fed fe-males vs. control females, P<0.05, fructose-fed males vs. control males). A signiicant increase in plasma NEFA concentrations was observed in the male
fructose-fed rats in comparison to controls (Table 1, P<0.05). Post-hoc analysis showed a signiicant diference in plasma NEFA concentrations between males and females in both control and fructose-fed groups (Table 1, *P<0.05 control males vs. control females, #P<0.05 fructose-fed males vs. fructose-fed
females).
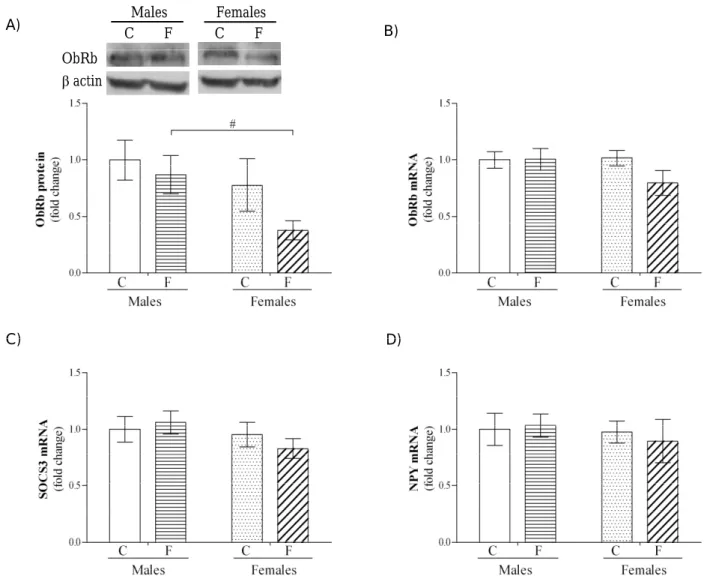
Fig. 1. Efects of high fructose diet on the ObRb protein level and ObRb, SOCS3 and NPY mRNA levels in the hypothalamus. Representative Western blots and relative quantiication of ObRb protein (A) in the hypothalamic whole cell extracts of control male and female rats, as well as male and female rats on a fructose-rich diet. Lower parts of the blots were probed with β-actin antibody as a loading control. Relative quantiication of ObRb (B), NPY (C) and SOCS3 (D) mRNA levels in the hypothalamus ofcontrol male and female rats, and male and female rats on a fructose-rich diet. C – control rats, F – fructose-fed rats. Data are presented as mean ± SEM. A value of P<0.05 was considered statistically signiicant. Signiicant between group diference is indicated as #P<0.05 for fructose-fed
Leptin concentrations in the plasma and hypothala-mus of male and female fructose-fed rats
Two-way ANOVA showed a signiicant efect of fruc-tose diet on plasma leptin levels (Table 1, P<0.01), while the efect of gender was not observed. Plasma leptin concentrations were increased in fructose-fed rats of both genders compared to the controls
(Ta-ble 1, P<0.05). When the analysis of plasma leptin was repeated by ANCOVA, with body mass as a co-variate, a between-group diference was observed (F(3,32)=2.92, P<0.05). Ater adjusting for body mass, estimated plasma leptin concentrations were 1.23 ± 0.41 ng/ml for control males, 2.39 ± 0.41 ng/ ml for fructose-fed males, 1.47 ± 0.42 ng/ml for con-trol females and 2.51 ± 0.42 ng/ml for fructose-fed
females, with no diferences in plasma leptin concen-trations between genders.
Leptin concentration in the hypothalamic whole-cell extract was higher in the fructose-fed males compared to the rats on control diet (Table 1, P<0.05), while in females the leptin concentration in the hypothalamus remained unaltered by fructose overconsumption (Table 1).
Leptin signaling in the hypothalamus of male and fe-male fructose-fed rats
he efects of a high fructose diet on the expression of hypothalamic ObRb isoform, NPY and SOCS3 were examined by quantitative Real-time PCR and semi-quantitative Western blot. he results from two-way ANOVA showed a signiicant efect of gen-der on ObRb relative protein concentration in the hypothalamus (F(1.21)=4.40, P<0.05), while there were no efects of fructose or interaction of both factors. Subsequent post-hoc analysis showed that fructose-fed females had signiicantly decreased hypothalamic ObRb relative protein concentration compared to fructose-fed males (Fig. 1, #P<0.05).
Besides, fructose-fed females showed a tendency to-ward a decrease of ObRb at the protein and mRNA level (P<0.1) in comparison to females on the
nor-mal diet. When the level of ObRb, NPY and SOCS3 mRNA in the hypothalamus were analyzed, two-way ANOVA did not reveal any signiicant efect of gen-der and fructose, or their interaction (Fig. 1).
Glucocorticoid signaling in the hypothalamus of male and female fructose-fed rats
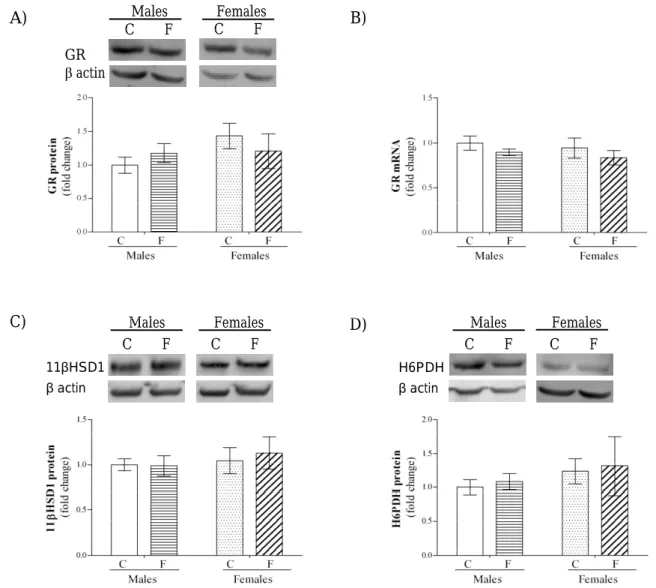
he impact of a high fructose diet on glucocorticoid signaling was also assessed in the hypothalamus of male and female rats. he results of two-way ANO-VA showed no signiicant efects of gender and fruc-tose, or they interaction, on the GR mRNA and GR, 11βHSD1 and H6PDH protein levels. he expression of the key enzymes of pre-receptor glucocorticoid metabolism, 11βHSD1 and H6PDH, was not afect-ed by the high-fructose diet in animals of both sexes (Fig. 2), and was paralleled by unaltered expression of both GR protein and mRNA (Fig. 2).
DISCUSSION
he results of the present study demonstrate that a fructose-rich diet induces an increase in plasma leptin concentrations in both female and male rats. However, the impact of fructose on hypothalamic leptin sensitivity difers in a gender-speciic man-ner. Females display a tendency towards decrease in
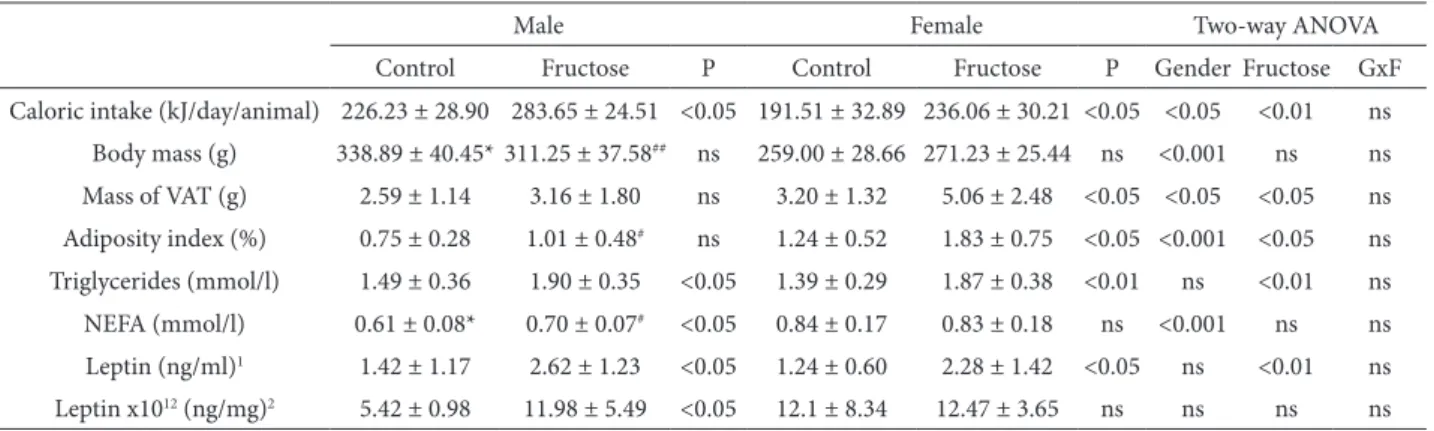
Table 1. Caloric intake, body weight, visceral adipose tissue mass, adiposity index, plasma parameters and concentration of leptin in the hypothalamus.
Male Female Two-way ANOVA
Control Fructose P Control Fructose P Gender Fructose GxF
Caloric intake (kJ/day/animal) 226.23 ± 28.90 283.65 ± 24.51 <0.05 191.51 ± 32.89 236.06 ± 30.21 <0.05 <0.05 <0.01 ns Body mass (g) 338.89 ± 40.45* 311.25 ± 37.58## ns 259.00 ± 28.66 271.23 ± 25.44 ns <0.001 ns ns Mass of VAT (g) 2.59 ± 1.14 3.16 ± 1.80 ns 3.20 ± 1.32 5.06 ± 2.48 <0.05 <0.05 <0.05 ns Adiposity index (%) 0.75 ± 0.28 1.01 ± 0.48# ns 1.24 ± 0.52 1.83 ± 0.75 <0.05 <0.001 <0.05 ns Triglycerides (mmol/l) 1.49 ± 0.36 1.90 ± 0.35 <0.05 1.39 ± 0.29 1.87 ± 0.38 <0.01 ns <0.01 ns NEFA (mmol/l) 0.61 ± 0.08* 0.70 ± 0.07# <0.05 0.84 ± 0.17 0.83 ± 0.18 ns <0.001 ns ns Leptin (ng/ml)1 1.42 ± 1.17 2.62 ± 1.23 <0.05 1.24 ± 0.60 2.28 ± 1.42 <0.05 ns <0.01 ns Leptin x1012 (ng/mg)2 5.42 ± 0.98 11.98 ± 5.49 <0.05 12.1 ± 8.34 12.47 ± 3.65 ns ns ns ns
he data represent the mean values ± SD of 9 animals per group. GxF indicates gender and fructose-diet interactive efect. 1Plasma level; 2Level in the hypothalamus. A value of P<0.05 was considered statistically signiicant. *P<0.05 control males vs. control females; #P<0.05
ObRb protein and mRNA levels in parallel with the development of visceral adiposity. On the other hand, male rats have elevated plasma NEFA and hypotha-lamic leptin concentrations. Expression of the key components of the glucocorticoid signaling pathway (GR, 11βHSD1 and H6PDH) and leptin signaling pathway (NPY and SOCS3) did not difer between fructose-fed and control animals of both genders.
Both male and female rats on the fructose-rich diet had elevated caloric intake originating from increased fructose consumption. Interestingly, in-creased caloric intake did not inluence the rat body mass, regardless of sex. However, females on the fructose diet displayed increased visceral adipose tissue mass and signiicantly elevated adiposity in-dex. Furthermore, in female rats the fructose diet led to hypoglycemia and triglyceridemia, which are im-portant parameters of metabolic disturbance. It was previously shown that fructose-induced increase in rat abdominal fat is accompanied by hypertriglycer-idemia (Bocarsly et al., 2010). In contrast to females, male rats on the fructose-rich diet did not present an increased mass of visceral adipose tissue and adiposity index, but had increased triglycerides and NEFA. Visceral adiposity is characterized not only by the diferent distribution of body fat, but also by changes in certain hormone levels, such as leptin and insulin, which may afect the hypothalamus (Melan-son et al., 2008). A number of studies demonstrated a relationship between increased adiposity and in-creased plasma leptin and insulin levels (Clegg et al., 2006). It is known that leptin and insulin send aferent signals to the hypothalamus in an endocrine feedback loop that regulates body adiposity and that the receptors for these hormones share common sig-naling pathways in this brain structure (Gerozissis, 2008). Our results showed that a fructose-rich diet led to elevated plasma leptin levels in both genders. It should be noted that the existing literature data regarding plasma leptin concentrations in female and male rats are contradictory. While some authors reported unchanged plasma leptin level (Wu-Peng et al., 1999), others showed increased (Clegg et al., 2003) or even decreased leptin concentration in fe-males compared to fe-males (Mulet et al., 2003). In this
on the periphery, as evidenced by increased NEFA release from this tissue and depleted lipid deposi-tion in the adipose tissue (Gallardo et al., 2007; Shi-mabukuro et al., 1997). Moreover, the elevation of plasma NEFA in male fructose-fed rats could be at-tributed to lipolysis that originates from enhanced glucocorticoid actions in the adipose tissue, as pre-viously demonstrated in our laboratory (Bursać et al., 2012).
Other factors contributing to leptin resistance in obesity involve the downregulation of ObRb and disturbed downstream signaling at the level of STAT and SOCS proteins (Howard and Flier, 2006; Myers et al., 2008). As previously mentioned, fructose-fed females had an unchanged hypothalamic leptin level accompanied with a tendency towards decreased ObRb protein and mRNA levels. It has already been shown that leptin administration causes a reduction in ObRb expression in cell lines (Liu et al., 2004) and Liu et al. (2007) have reported a negative relationship between plasma leptin concentration and ObRb gene expression in the hypothalamus and liver. In our study, a decrement in ObRb protein level in fructose-fed females was signiicantly lower compared to the males, and this tendency towards leptin resistance in females could develop further if the animals were ex-posed to the diet for a longer period. In line with this assumption, Shapiro et al. (2008) have shown that chronic (6 months) fructose consumption induced leptin resistance through decreased hypothalamic STAT3 phosphorylation and elevated triglycerides, but with no changes in SOCS3 gene expression. Our results also did not conirm fructose-related changes in the hypothalamic SOCS3 mRNA level in both gen-ders, and we assume that the impaired hypothalamic leptin sensitivity in the females could be caused by alterations downstream of the leptin receptor.
Apart from leptin efects on the regulation of food intake and energy metabolism, there is evi-dence suggesting that glucocorticoids also play an important role in the control of feeding behavior (la Fleur, 2006). For example, glucocorticoids may afect the nutritional state through the regulation of hy-pothalamic expression of orexigenic peptides, such
as NPY, AgRP and POMC (Shimizu et al., 2008). Tis-sue-speciic glucocorticoid concentrations depend on the activity of 11βHSD1, which may be regulated by diet regime (London and Castonguay, 2009; Seckl et al., 2004). Our results showed that a fructose-rich diet did not change the pre-receptor metabolism of glucocorticoids, GR protein and mRNA levels in the hypothalami of males and females. Additionally, unchanged GR levels coincided with an unchanged expression of its transcriptional target, NPY. Since NPY is not the only orexigenic peptide produced in the hypothalamus, it is possible that the efects of the fructose diet were mediated through other orexigen-ic signals in the brain.
In summary, the results of the present study show that long-term fructose consumption exerted more harmful efects on central leptin sensitivity in female than in male rats, probably shaping a gender-speciic metabolic phenotype characterized by increased vis-ceral adiposity only in females.
Acknowledgments - his work was supported by the Ministry
of Education, Science and Technological Development of the Republic of Serbia, Grant III41009.
REFERENCES
Ainslie, D. A., Morris, M. J., Wittert, G., Turnbull, H., Proietto, J. and horburn, A. W. (2001). Estrogen deiciency causes central leptin insensitivity and increased hypothalamic neuropeptide Y. Int J Obes Relat Metab Disord.25, 1680-1688.
Banks, W. A., Coon, A. B., Robinson, S. M., Moinuddin, A., Shultz, J. M., Nakaoke, R. and Morley, J. E. (2004). Triglycerides induce leptin resistance at the blood-brain barrier. Diabe-tes.53, 1253-1260.
Bocarsly, M. E., Powell, E. S., Avena, N. M. and Hoebel, B. G.
(2010). High-fructose corn syrup causes characteristics of obesity in rats: increased body weight, body fat and trig-lyceride levels. Pharmacol Biochem Behav.97, 101-106.
Bray, G. A. (2008). Fructose: should we worry? Int J Obes (Lond). 32 Suppl 7, S127-131.
Bursać, B. N., Djordjevic, A. D., Vasiljević, A. D., Vojnović Milutinović, D. D., Veličković, N. A., Nestorović, N. M.
Clegg, D. J., Brown, L. M., Woods, S. C. and Benoit, S. C. (2006). Gonadal hormones determine sensitivity to central leptin and insulin. Diabetes.55, 978-987.
Clegg, D. J., Riedy, C. A., Smith, K. A., Benoit, S. C. and Woods, S. C. (2003). Diferential sensitivity to central leptin and insulin in male and female rats. Diabetes.52, 682-687.
Denzer, C., hiere, D., Muche, R., Koenig, W., Mayer, H., Kratzer, W. and Wabitsch, M. (2009). Gender-speciic prevalences of fatty liver in obese children and adolescents: roles of body fat distribution, sex steroids, and insulin resistance. J Clin Endocrinol Metab.94, 3872-3881.
Duncombe, W. G. (1964). he colorimetric micro-determination of non-esteriied fatty acids in plasma. Clin Chim Acta.9, 122-125.
Friedman, J. M. and Halaas, J. L. (1998). Leptin and the regula-tion of body weight in mammals. Nature.395, 763-770.
Galipeau, D., Verma, S. and McNeill, J. H. (2002). Female rats are protected against fructose-induced changes in metabo-lism and blood pressure. Am J Physiol Heart Circ Physiol. 283, H2478-2484.
Gallardo, N., Bonzon-Kulichenko, E., Fernandez-Agullo, T., Mol-to, E., Gomez-Alonso, S., Blanco, P., Carrascosa, J. M., Ros, M. and Andres, A. (2007). Tissue-speciic efects of central leptin on the expression of genes involved in lipid metabo-lism in liver and white adipose tissue. Endocrinology.148, 5604-5610.
Gerozissis, K. (2008). Brain insulin, energy and glucose homeo-stasis; genes, environment and metabolic pathologies. Eur J Pharmacol.585, 38-49.
Horton, T. J., Gayles, E. C., Prach, P. A., Koppenhafer, T. A. and
Pagliassotti, M. J. (1997). Female rats do not develop sucrose-induced insulin resistance. Am J Physiol. 272, R1571-1576.
Howard, J. K. and Flier, J. S. (2006). Attenuation of leptin and insulin signaling by SOCS proteins. Trends Endocrinol Metab.17, 365-371.
la Fleur, S. E. (2006). he efects of glucocorticoids on feeding behavior in rats. Physiol Behav.89, 110-114.
Liu, Z. J., Bian, J., Liu, J. and Endoh, A. (2007). Obesity reduced the gene expressions of leptin receptors in hypothalamus and liver. Horm Metab Res.39, 489-494.
Liu, Z. J., Endoh, A., Li, R. and Ohzeki, T. (2004). Efects of lep-tin and dexamethasone on long and short leplep-tin receptor mRNA. Pediatr Int.46, 561-564.
London, E. and Castonguay, T. W. (2009). Diet and the role of 11beta-hydroxysteroid dehydrogenase-1 on obesity. J Nutr Biochem.20, 485-493.
Melanson, K. J., Angelopoulos, T. J., Nguyen, V., Zukley, L., Lowndes, J. and Rippe, J. M. (2008). High-fructose corn syrup, energy intake, and appetite regulation. Am J Clin Nutr.88, 1738S-1744S.
Morton, G. J., Cummings, D. E., Baskin, D. G., Barsh, G. S. and
Schwartz, M. W. (2006). Central nervous system control of food intake and body weight. Nature.443, 289-295.
Mulet, T., Pico, C., Oliver, P. and Palou, A. (2003). Blood leptin homeostasis: sex-associated diferences in circulating lep-tin levels in rats are independent of tissue leplep-tin expres-sion. Int J Biochem Cell Biol.35, 104-110.
Myers, M. G., Cowley, M. A. and Munzberg, H. (2008). Mecha-nisms of leptin action and leptin resistance. Annu Rev Physiol.70, 537-556.
Oswal, A. and Yeo, G. (2010). Leptin and the control of body weight: a review of its diverse central targets, signaling mechanisms, and role in the pathogenesis of obesity. Obe-sity (Silver Spring).18, 221-229.
Regitz-Zagrosek, V., Lehmkuhl, E. and Weickert, M. O. (2006). Gender diferences in the metabolic syndrome and their role for cardiovascular disease. Clin Res Cardiol.95, 136-147.
Riant, E., Waget, A., Cogo, H., Arnal, J. F., Burcelin, R. and Gourdy, P. (2009). Estrogens protect against high-fat diet-induced insulin resistance and glucose intolerance in mice. Endo-crinology.150, 2109-2117.
Roberts, C. K., Vaziri, N. D. and Barnard, R. J. (2001). Protective efects of estrogen on gender-speciic development of diet-induced hypertension. J Appl Physiol.91, 2005-2009.
Schwartz, M. W., Peskind, E., Raskind, M., Boyko, E. J. and Porte, D., Jr. (1996). Cerebrospinal luid leptin levels: relation-ship to plasma levels and to adiposity in humans. Nat Med. 2, 589-593.
Seckl, J. R., Morton, N. M., Chapman, K. E. and Walker, B. R.
(2004). Glucocorticoids and 11beta-hydroxysteroid de-hydrogenase in adipose tissue. Recent Prog Horm Res.59, 359-393.
Shapiro, A., Mu, W., Roncal, C., Cheng, K. Y., Johnson, R. J. and
Scarpace, P. J. (2008). Fructose-induced leptin resistance exacerbates weight gain in response to subsequent high-fat feeding. Am J Physiol Regul Integr Comp Physiol.295, R1370-1375.
Shimabukuro, M., Koyama, K., Chen, G., Wang, M. Y., Trieu, F., Lee, Y., Newgard, C. B. and Unger, R. H. (1997). Direct an-tidiabetic efect of leptin through triglyceride depletion of tissues. Proc Natl Acad Sci U S A.94, 4637-4641.
Glucocorti-coids increase neuropeptide Y and agouti-related peptide gene expression via adenosine monophosphate-activated protein kinase signaling in the arcuate nucleus of rats. En-docrinology.149, 4544-4553.
Spector, T. (1978). Reinement of the coomassie blue method of protein quantitation. A simple and linear spectrophoto-metric assay for less than or equal to 0.5 to 50 microgram of protein. Anal Biochem.86, 142-146.
Tappy, L. and Le, K. A. (2010). Metabolic efects of fructose and the worldwide increase in obesity. Physiol Rev.90, 23-46.
Vegiopoulos, A. and Herzig, S. (2007). Glucocorticoids, metabo-lism and metabolic diseases. Mol Cell Endocrinol.275, 43-61.
Verploegen, S. A., Plaetinck, G., Devos, R., Van der Heyden, J. and
Guisez, Y. (1997). A human leptin mutant induces weight gain in normal mice. FEBS Lett.405, 237-240.
Wajchenberg, B. L. (2000). Subcutaneous and visceral adipose tissue: their relation to the metabolic syndrome. Endocr Rev.21, 697-738.