The impact of anemia and body mass index (BMI) on neuromotor
development of preschool children
SELEN OZAKAR AKCA1*, MEHMET ÖMER BOSTANCI2
1Health School, Hitit University, Çorum, Turkey
2Department of Physiology, Medical Faculty, Hitit University, Çorum, Turkey
S
UMMARYStudy conducted at Hitit University, Çorum, Turkey
Article received: 2/17/2017
Accepted for publication: 3/1/2017
*Correspondence:
Hitit University, Health School Address: Çevre Yolu Bulvarı
Çorum – Turkey Postal code: 19000 [email protected]
http://dx.doi.org/10.1590/1806-9282.63.09.779
Objective: According to data from the World Health Organization (WHO), anemia is a prevalent health problem that leads to increased morbidity and mortality, especially in preschool children. Anemia is recognized as a major health problem due to its negative effects on the mental and physical development during childhood. The aim of our study was to determine the levels of anemia of children in a kindergarten affiliated to the Directorate of National Education using a non-invasive method, and to investigate the effects of anemia on the physical, mental and neuromotor development of children.
Method: The levels of anemia was evaluated by using a non-invasive measurement device. Data collection was performed by means of a questionnaire to evaluate the children’s physical development and set Denver Developmental Screening Test II scores.
Results: Our findings show that 21% of non-anemic and 15% of anemic children are in the suspected abnormal group according to their DDST II total score. Furthermore, it has been identified that mild anemia has a positive effect on neuromotor development, while overweight and obesity affect neuromotor development in a negative way.
Conclusion: According to the results obtained from the study, mild anemia may have a positive effect on the children’s neuromotor development, while malnutrition could have a negative impact.
Keywords: anemia, Denver Developmental Screening Test II (DDST II), neuromotor development, obesity, child, preschool.
I
NTRODUCTIONAnemia is defined as a decrease in the amount of red blood cells or hemoglobin in the blood and results in a decline of oxygen-carrying capacity and the amount of oxygen that reaches the body’s tissues. Normal hemoglobin, he-matocrit and average erythrocyte volume values are dif-ferent according to age and gender. Therefore, a separate assessment of each patient is made to diagnose anemia. Levels two standard deviations below the normal value are considered to be anemia.1,2 Since anemia is a symptom
of many diseases rather than a primary illness itself, it may often worsen the dysfunction of other organs.3
The World Health Organization (WHO) sees anemia as a common health problem that especially leads to in-creased mortality and morbidity in preschool children.
Worldwide prevalence of anemia is between 22.9 and 26.7%.4,5 The WHO has issued a social health problem
rating according to anemia prevalence and as a result of this, it was reported that countries with a prevalence of anemia at 5% or less do not have a health problem, while prevalence at the 5-19% range is considered a mild prob-lem, between 20-39% is considered a moderate one, and above 40% is seen as a major health issue.6 The anemia
rate above 40% seen in Turkey is regarded by WHO as a serious public health problem.4
development period, anemia-related problems (growth retardation, motor and mental performance decline, be-havior disorders etc.) are of great concern.7
Similarly to anemia, obesity is also regarded as an im-portant public health problem.8 Childhood obesity
oc-curs especially in developed countries but increased prev-alence is observed all over the world.9 This increased
prevalence of obesity is so serious that it could be de-scribed as an epidemic. Although prevalence varies from country to country, it has rapidly grown over the last 20 years. Comparing the results between the years 1988-1994 and 2003-2004 according to the National Health and Nu-trition Examination Survey (NHANES) in the United States (US), the prevalence of overweight in the age range between 2 and 5 years has increased from 7.2 to 13.9%. At the same time, the frequency between 6 and 11 years old rose from 11 to 19%.10 It is reported that the obesity
prev-alence in Turkey has increased in the last 20 years from 6-7% to 15-16%.11
Obesity causes many physical, emotional and psy-chosocial problems, leading to educational and social issues (e.g., economic burden) as well. Awareness is thus extremely important in winning the battle against obe-sity. Obesity not only leads to chronic diseases later in life, but also during childhood. These include many dis-eases that affect the neurological system.12,13 In addition,
obesity has a negative impact on children’s education. Studies performed on this topic determined that over-weight/obese children have lower reading skills and math-ematic scores, poorer classroom performance, less success as students, less connection to schoolmates, greater de-sire to quit school, and they cannot proceed to further education in life with the same level of success as normal weight children.12,14
Considering the clinical and social impacts of anemia and obesity, taking necessary measures are not only im-portant for the purpose of individual treatment but also in terms of public health. Having in mind that health checks are not a habit in our society, every child must be evaluat-ed individually according to their growth/development.
After having reviewed the available literature, we did not find any studies showing the impact of anemia and obesity on 5-6 year-old children regarding physical, men-tal and neuromotor development. Our study aimed to determine the presence of anemia and obesity in children at a kindergarten facility affiliated with the Directorate of National Education of Corum using a non-invasive method, and to investigate the impact of anemia and obesity on the children’s physical, mental and neuromo-tor development.
M
ETHODPreparation
The study included all 5-6 year-old children enrolled in the kindergarten affiliated with the Directorate of National Education of Çorum. The research was done by means of a descriptive method and avoiding sample selection. All children (916) aged between 5 to 6 years who were present at the kindergarten during the study’s dates (January – June 2015) and whose parents/guardians did not refuse the ap-plication of the Denver Developmental Screening Test II (DDST II) constituted the study sample. The DDST II was applied to all participating 5-6 year-old children. Addition-ally, hemoglobin values were measured using a non-invasive method, and body mass index (BMI) was determined.
Before initiating the study, approval was obtained from the Provincial Directorate of National Education (23.12.2014/6817100) and the Ankara Numune Educa-tion and Research Hospital ethics committee (19.02.2015/ E-15-424). After receiving information pertaining the study’s purpose and method, the parents/guardians of the children expected to participate signed a proper con-sent form. Furthermore, they were made aware that if anemia and/or obesity were detected, they would be in-formed and referred for treatment. DDST II was evalu-ated and performed by the screener.
Instruments
Research data was collected by interview using a question-naire, the children’s anemia and obesity status assessment form, and the DDST II screening test. The sociodemograph-ic characteristsociodemograph-ics of the children were also investigated using the questionnaire.
The children’s levels of anemia (hemoglobin value) as-sessment was performed using a non-invasive hemoglobin measurement device (Masimo, rainbow DCI-mini SC1000). This device was chosen due to its portability and capacity of proving fast results to determine anemia or blood loss in a non-invasive manner.15,16 The purpose of hemoglobin
measurement in children is to obtain a concrete feedback about their levels of anemia. In our study, the WHO hemo-globin cut-off values of anemia were taken as reference and, therefore, the lower limit for hemoglobin levels in children between the ages of 5 to 11 years was accepted as 11.5 g/dL. Children with hemoglobin levels lower than that were con-sidered anemic.3 Anemia is classified as mild, moderate
or severe based on the concentrations of hemoglobin in the blood. In our study, hemoglobin concentration at 10.0 g/dL was accepted as the lower limit for mild anemia.17
Health Statistics (NCHS) and approved by the Center for Disease Control and Prevention (CDC) and the WHO. Percentage curves established for Turkish children yield-ed the BMI of the children evaluatyield-ed.18-20
Height was measured using a standard stadiometer, with the children standing barefoot. During height mea-surement, researchers made sure that the most protrud-ing point of the head, shoulders, hips and heels were in contact with the vertical plane and feet were adjacent to each other. Weight was obtained using a digital scale sensitive to 20 g variations, and the children were asked to remove their jackets before their weight was read. The remaining clothing was accepted as weighing approxi-mately 1 kg, which was subtracted from the weight read from the digital scale. In order to compare the children’s height and weight measurements in a healthy way, the same weight and height measurement device was used and the measurement was performed by the same person with the appropriate technique.
Body mass index was calculated by using the for-mula: Weight [kg]/height2 [m2]. The CDC defines the BMI
percentage range 85-95% as overweight and over 95% as obese during childhood and adolescence.19-21 In our study,
the percentage curve defined for Turkish children was used, and the ones with BMI < 5 were accepted as under-weight, 5-84 as normal, 85-95 as overweight and BMI > 95 as obese.
The evaluation of the neuromotor status of children was done based on the DDST II score.This test was de-veloped by Frankenburg, Dodds, Fandal, Kazuk and Cohrs (1967) in order to help medical personnel detect develop-mental problems in children. The test was reviewed in 1990 and the Denver II was then created. The first stan-dardization of the Denver Developmental Screening Test in Turkey was done in 1987 by Yalaz and Epir. The test-retest reliability of the Turkish version is 89%, while inter-rater liability is 95%.22,23
Denver II consists of 121 items and assesses four development areas, including the children’s personal, social, fine and gross motor and language skills. There are five “Test Behavior” items at the end, which help the test screener assess how children use their behavior and skills. Each item is scored according to a combination of answers by the caregivers, the child’s evaluation and observation. Children are assessed as a result of the performed test and in accordance with their total score by dividing them into four defining classes as normal, abnormal, suspect and untestable. While forming these groups, caution and delay of children’s motor perfor-mance were taken into consideration. The caution
con-cept in DDST II can be explained as follows: children who are to the left of the age line or on more than one item intersected by the age line in the area of 75-90% or refusing to perform those items get a caution point. The reason is that in the standardization sample more than 75% of the children were able to perform this task ear-lier than the surveyed child. A delay is indicated when a child fails or refuses an item that falls completely to the left of the age line or when a child refuses to fulfill that task. This indicates that the child has failed an item that 90% of children in the standardization sample passed at an earlier age. In light of this information, children who were included in the normal group in terms of his/her development have no delays and a maximum of one caution. On the other hand, children with one delay and/or two or more cautions have been included in the suspect group. Children with two or more delays were allocated into the abnormal develop-ment group. The age line of children is drawn in the test form from top to bottom. Age scales located on the top and bottom of the test scale show the ages from 15-day to 6 years. Every test item is shown with a horizontal rectangle on the test scale. If the child shows normal development in terms of behavior, he/she will pass. If abnormal development is detected, the child will fail, and if the child refuses to attempt the requested task, this will be evaluated as a refusal.23
The identification of children to be included in the study was done according to the following conditions: major congenital malformation absence, being a singleton, not having been born premature, dysmature and mal-nourished, lack of chronic illness, lack of metabolic dis-orders, not having been exposed to surgical intervention for any reason, and having considered to get the consent of families whose children have participated in the study. Furthermore, children who have refused to perform the test have not been included in the study. This study is limited to data obtained from 916 children who were at the kindergarten in Çorum, were available, and included in the study.
Statistical analysis
R
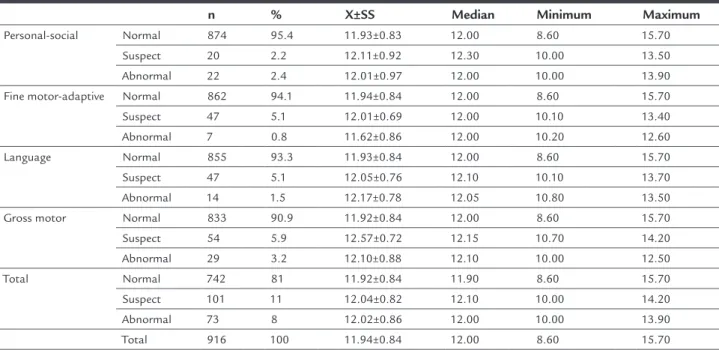
ESULTSOur study included 916 children, comprising 428 girls and 488 boys. DDST II has been analyzed in two sections by dividing it into a normal group and an abnormal-suspect group. Of the examined children, 19% were allocated into the suspect-abnormal group based on their DDST II scores for personal-social (4.6%), fine motor (5.9%), language (6.6%) and gross motor (9.1%) categories (Table 1).
While the hemoglobin average of 5-6 years old children who participated in the study was 11.94±0.84, 29.8% of children were found to be anemic (Table 1, Figure 1). Our study did not show any child with severe or moderate ane-mia. In Table 1, DDST II distribution results are given according to the hemoglobin value. When comparing the personal-social, fine motor, language and gross motor test results of DDST II separately with hemoglobin values, no statistically significant difference was seen (p>0.05). 21% of the children without anemia were allocated into the suspect-abnormal group, whereas 15% of the anemic chil-dren were also in the same group. Furthermore, it has been proven that total score of DDST II compared with hemo-globin values of the children shows a statistically significant difference according to the neuromotor development of children with and without anemia (p<0.05; Figure 1).
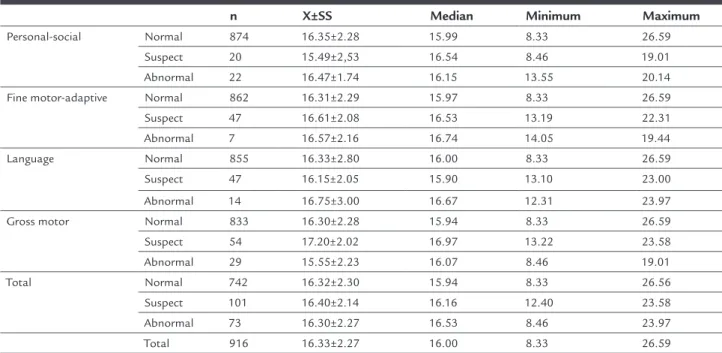
The average BMI of the surveyed children was 16.33±2.27, and it has been determined that 39.6% were normal, 8.2% were overweight, and 24.7% were obese. The distribution of DDST II results according to BMI is given in Table 2. Fourty-six (46) out of 252 underweight children,
63 out of 363 children with normal weight, 16 out of 75 overweight children and 49 out of 226 obese children were ranked in the suspect-abnormal group. Furthermore, it was seen that the total score of DDST II is statistically significant according to their BMI (p<0.05; Figure 2).
We have found a rate of underweight children of 27.5% in our study. Our study shows that 26.4% of suspect-ab-normal children were underweight (Figure 2). However, being underweight did not prove to lead to significant changes in neuromotor development of children (p>0.05).
D
ISCUSSIONThe data which we have obtained from our study shows that obesity is affecting neuromotor development in a negative way according to the total score of DDST II, while mild anemia has a positive effect on neuromotor development. Growth retardation is shown as one of the most com-mon problems in children within the first 6 years of life, and there is a growth retardation rate of 12-16% during childhood.24 As developmental disorders may pass
un-noticed during regular inspections, especially in early childhood, it is necessary to perform a standard assessment in order to diagnose growth retardation. For this reason, developmental screening tests have to be used for the age group 0-6.25-27 In light of these findings, the standardized
DDST II, which provides information about a child’s personal-social, fine motor, language and gross motor features, was used. In total, 19% of the 5-6 year-olds in our study were allocated into the suspect-abnormal group
TABLE 1 Distribution according to the hemoglobin values of DDST II results (N=916).
n % X±SS Median Minimum Maximum
TABLE 2 Distribution according to body mass index (BMI) of DDST II results (N=916).
n X±SS Median Minimum Maximum
Personal-social Normal 874 16.35±2.28 15.99 8.33 26.59 Suspect 20 15.49±2,53 16.54 8.46 19.01 Abnormal 22 16.47±1.74 16.15 13.55 20.14 Fine motor-adaptive Normal 862 16.31±2.29 15.97 8.33 26.59 Suspect 47 16.61±2.08 16.53 13.19 22.31 Abnormal 7 16.57±2.16 16.74 14.05 19.44 Language Normal 855 16.33±2.80 16.00 8.33 26.59 Suspect 47 16.15±2.05 15.90 13.10 23.00 Abnormal 14 16.75±3.00 16.67 12.31 23.97 Gross motor Normal 833 16.30±2.28 15.94 8.33 26.59 Suspect 54 17.20±2.02 16.97 13.22 23.58 Abnormal 29 15.55±2.23 16.07 8.46 19.01 Total Normal 742 16.32±2.30 15.94 8.33 26.56 Suspect 101 16.40±2.14 16.16 12.40 23.58 Abnormal 73 16.30±2.27 16.53 8.46 23.97 Total 916 16.33±2.27 16.00 8.33 26.59
FIGURE 1 Comparison between total score of DDST II and hemoglobin levels (N=916).
Normal
Number of childr
en
Suspect-abnormal
p-value: 0.046 600
500
400
300
200
100
0
Mild anemia 10.0
232
41
510
133
11.5 Normal
Hb level (g/dL) due to their total DDST II score (Table 1). It was
report-ed that in the study performreport-ed by Güven et al.,26 25.7% of
the 0-6 age group of children were in the abnormal and suspect group. The study published by Doğan and Baykoç27 shows that 19.45% of 5-6 year-old children were
in the abnormal and suspect group, which is in line with our research findings. Our study included preschool
chil-dren and comprised a large sample to represent all chilchil-dren in this age group. It is reported that early identification of developmental delays is kept equivalent with early treatment and is helping to reduce loss of function and secondary behavioral problems.28 Children with identified
treat-ment, which shows the importance of our study in terms of social contribution.
Anemia is defined as having a hemoglobin value un-der -2 SD according to age group.3 Anemia is commonly
reported all over the world and should be monitored by screening programs due to more severe effects in infancy.29
Out of 2,872 4-6 year-old children, 3.4% surveyed by Karagün et al.were determined to be anemic.30 In the
retrospective study conducted in Balıkesir (Turkey), 563 children between the ages of 0 to 18 were investigated and the frequency of anemia among 5-7 year-old children was found at 13.6%.31 In our study, 5-6 years old children have
been taken into consideration and all of those with a value of 11.5 g/dL or lower were considered anemic. Based on the non-invasive evaluation, it was determined that the hemoglobin average of 916 children is 11.94±0.84 (Table 1). Furthermore, it was seen that 29.8% (n=273) of children who participated in the study have a hemoglobin value of ≤ 11.5 g/dL (Figure 1). The high incidence of anemia in our study reveals the importance of follow-up with anemia screening programs in the preschool period, and treatment support.
Anemia is a disease that has an impact on biochem-ical processes, cellular function, growth and development, mental and behavioral development, the immune system, physical capacity, thermoregulation and many hemato-logic and non-hematohemato-logic systems, such as the gastro-intestinal tract.30-33 According to conducted studies, the
decrease of one unit in hemoglobin in a child increases the mild to moderate mental retardation risk 1.28 times. Even if these children get treated, their Bayley test scores (used for developmental follow-up) will still be low after ten years.34 Furthermore, it is emphasized that early
diagnosis and treatment of anemia is very important due to anemia’s significant effects on children’s growth, development and cognitive functions.31 The relation of
total DDST II score between anemic and non-anemic 5-6 year-old children was found to be statistically sig-nificant (p<0.05; Figure 1). Additionally, it was deter-mined that 21% of non-anemic and 15% of the anemic children was in the suspect-abnormal group according to their DDST II scores. Considering that children who participated in our study did not show any severe or moderate anemia, our study’s results show that the neu-romotor development of children with mild anemia is better than that of children without anemia. While some published studies35,36 support neurogenesis of
physio-logical hypoxia (3% O2), they reported that anoxia (< 1%
O2)and severe hypoxia (1% O2)have negative effects. Data
obtained by our study reveals that mild hypoxia may have positive effects on neuromotor development. In order to explain the mechanisms behind this, new stud-ies must be conducted.
In terms of growth and development, the age range 3 to 6 years is an important period. As for body adipos-ity, the preschool period is of great importance. While FIGURE 2 Comparison between total score of DDST II and body mass index (N=916).
Normal
Number of childr
en
Suspect-abnormal
p-value: 0.047 350
300
250
200
150
100
50
0
Underweight normal overweight obese
206
300
46
63 59
177
49
16
the amount of adipose tissue decreases after infancy until the age of 6-8 years, it than increases thereafter. This early adiposity increase poses a big risk with regard to obesity.21 The BMI average of 916 children within our
study was determined at 16.33±2.27 (Table 2); 8.2% of these were overweight and, 24.7% were obese (Figure 2). In addition to obesity, protein energy deficiency is a very common nutritional problem among pre-school children in our country. Nevertheless, our study revealed that being underweight does not have a significant impact on the children’s neuromotor development. The relation-ship between the children’s BMI and DDST II total scores was considered statistically significant, and we found that 26.4% of the suspect-abnormal children were un-derweight, 36.2% were normal, 9.2% were overweight and 28.2% were obese (Figure 2).
As a result, mild anemia seems to present a positive effect on neuromotor development, while malnutrition may have a negative impact on children’s neuromotor development. To investigate the underlying causes of the relationship between neuromotor development and mal-nutrition, further studies are required. In addition, new studies also are needed to evaluate the effects of severe or moderate anemia on neuromotor development. Raising awareness in families regarding anemia, malnutrition and neuromotor development is expected to provide a positive contribution in terms of early diagnosis and treatment of diseases.
A
CKNOWLEDGMENTSThis study was supported by the Scientific Research Fund of Hitit University (Project No. SYO19002.15.001). All of the authors contributed to the planning, development and reporting of the work. All contributors are respon-sible for the overall content as guarantors. All authors thank Atakan Comba for reviewed hemoglobin results.
C
ONFLICT OF INTERESTThe authors declare no conflict of interest.
R
EFERENCES1. Lanzkowsky P, editor. Manual of pediatric hematology and oncology. 5. ed. London: Academic Press; 2010.
2. Kalinyak KA. Anemias and other disorders of red blood cells. In: Osborn LM, DeWitt TG, First LR, Zenel JA, editors. Pediatrics. Philadelphia: Elsevier Mosby; 2005. p. 686-92.
3. Glader B. Iron deficiency anemia. In: Kliegman RM, Behrman RE, Jensen HB, Stanton BF, editors. Nelson textbook of pediatrics. 18. ed. Philadelphia: Saunders Elsevier; 2007. p. 2014-7.
4. Benoist B, McLean E, Egli I, Cogswell M. Worldwide prevalence of anaemia 1993-2005: WHO global database on anaemia. Geneva: World Health Organization; 2008.
5. Brugnara C, Oski FA, Nathan DG. Diagnostic approach to the anemic patient. In: Orkin HS, Fisher DE, Look AT, editors. Nathan and Oski’s hematology of infancy and childhood. 7. ed. Philadelphia: W.B. Saunders Co; 2009. p. 456-63.
6. World Health Organization Department of Nutrition for Health and Development. Iron deficiency anemia: assessment, prevention and control: a guide for programme managers. Geneva: World Health Organization; 2001. 7. Watkins D, Whitehead VM, Rosenblatt DS. Megaloblastic anemia. In: Orkin HS, Fisher DE, Look AT, editors. Nathan and Oski’s hematology of infancy and childhood. 7. ed. Philadelphia: W.B. Saunders Co; 2009: p. 469-501. 8. McClung JP, Karl JP. Iron deficiency and obesity: the contribution of
inflammation and diminished iron absorption. Nutr Rev. 2009; 67(2):100-4. 9. Slyper AH. The pediatric obesity epidemic: causes and controversies. J Clin
Endocrinol Metab. 2004; 89(6):2540-7.
10. CDC National Center for Health Statistics. NHANES data on the prevalence of Overweight among children and adolescents: United States, 2003-2006. Health E-Stats.
11. Türkiye Obezite (Şişmanlık) ile Mücadele ve Kontrol Programı (2010-2014). Ankara: T.C. Sağlık Bakanlığı Temel Sağlık Hizmetleri Genel Müdürlüğü; 2010. 12. Judge S, Jahns L. Association of overweight with academic performance and social and behavioral problems: an update from the early childhood longitudinal study. J Sch Health. 2007; 77(10):672-8.
13. Sinha R, Fisch G, Teague B, Tamborlane WV, Banyas B, Allen K, et al. Prevalence of impaired glucose tolerance among children and adolescents with marked obesity. N Engl J Med. 2002; 346(11):802-10.
14. Ergül Ş, Kalkım A. A major chronic disease: obesity in childhood and adolescence. TAF Prev Med Bull. 2011; 10(2):223-30.
15. Giraud B, Frasca D, Debaene B, Mimoz O. Comparison of haemoglobin measurement methods in the operating theatre. Br J Anaesth. 2013; 111(6):946-54.
16. Schweinitz BA von, De Lorenzo RA, Cuenca PJ, Anschutz RL, Allen PB. Does a non-invasive hemoglobin monitor correlate with a venous blood sample in the acutely ill? Intern Emerg Med. 2015; 10(1):55-61.
17. Capellini MD, Motta I. Anemia in clinical practice-definition and classification: does hemoglobin change with aging? Semin Hematol. 2015; 52(4):261-9. 18. Akçam M, Boyacı A, Pirgon Ö, Dündar B. Evaluation of the change in the
prevalence of childhood obesity in ten schools of Isparta city. Turk Arch Ped. 2013; 48:152-5. Available from: http://www.turkpediatriarsivi.com/ sayilar/195/buyuk/152-155-ing.pdf.
19. Hering E, Pritsker I, Gonchar L, Pillar G. Obesity in children is associated with increased health care use. Clin Pediatr (Phila). 2009; 48(8):812-8. 20. Neyzi O, Bundak R, Gökçay G, Günöz H, Furman A, Darendeliler F, et al.
Reference values for weight, height, head circumference, and body mass index in Turkish chidren. J Clin Res Pediatr Endocrinol. 2015; 7(4):280-93. 21. Bradford NF. Overweight and obesity in children and adolescents. Prim
Care. 2009; 36(2):319-9.
22. Celebioglu Morkoc O, Aktan Acar E. Effectiveness of multipurpose unit early classroom intervention program for 4-5-year old children. Educational Sciences: Theory & Practice 2014; 14(5):1851-60.
23. Anlar B, Bayoğlu B, Yalaz K. Denver II gelişimsel tarama testi “Türk Çocuklarına Uyarlanması ve Standardizasyonu”. Ankara; 2009. 24. Rydz D, Srour M, Oskoui M, Marget N, Shiller M, Birnbaum R, et al. Screening
for developmental delay in the setting of a community pediatric clinic: a prospective assessment of parent-report questionnaires. Pediatrics. 2006; 118(4):e1178-86.
25. Demirci A, Kartal M. A significant problem in childhood: developmental-delay and the importance of early diagnosis. Turkish Fam Physician. 2012; 3(4):1-6. 26. Güven F, Say A, Sarı İ, Sarı E, Değirmenci S, Külcü NU. The effect of
socio-economic level on Denver II Test. Medical Bulletin Zeynep Kamil. 2012; 43:108-13.
27. Doğan A, Baykoç N. Hastanede çocuk gelişimi birimine yönlendirilen çocukların değerlendirilmesi. Hacettepe University Faculty of Health Sciences J. 2015; 1:101-13.
28. Sices L, Feudtner C, Mclaughlin J, Drotar D, Williams M. How do primary care physicians identify young children with developmental delays? A national survey. J Dev Behav Pediatr. 2003; 24(6):409-17.
29. Pasricha SR. Should we screen for iron deficiency anaemia? A review of the evidence and recent recommendations. Pathology. 2012; 44(2):139-47. 30. Karagün BŞ, Korkmaz Ö, Gürsu AH, Cevit O, Bayram B, Aslan E, et al. The
31. Yazıcı SY, Çelik T, Seyrek K. Prevalance of anemia. J Behçet Uz Children’s Hospital. 2012; 2:6-9.
32. Kaya Z, Gürsel T, Bozkurt R, Kocak Ü, Ziyaaral Y. The incidence of anemia in children and the association with anemia and infection. Ege J Med. 2007; 46:37-40.
33. Yıldız I. Iron deficiency anemia. Turk Arch Ped. 2009; 44:14-8.
34. Halterman JS, Kaczorowski JM, Aligne CA, Auigner P, Szilagyi PG. Iron deficiency and cognitive achievement among school aged children and adolescents in the United States. Pediatrics. 2001; 107(6):1381-6.
35. Ortega JA, Sirois CL, Memi F, Glidden N, Zecevic N. Oxygen levels regulate the development of human cortical radial glia cells. Cereb Cortex. 2016 [Epub ahead of print].