ISSN 1517-7076 artigo e-11850, 2017
Corresponding Author : Gustavo Cervi Received on: 27/03/2017 Accepted on: 17/05/2017
10.1590/S1517-707620170002.0183
Differential Scanning Calorimetry study
on curing kinetics of diglycidyl ether
of bisphenol A with amine curing
agents for self-healing systems
Gustavo Cervi 1, Sérgio Henrique Pezzin 1, Marcia Margarete Meier 1
1
Chemistry Department, Santa Catarina State University, 89.219-710 Joinville, Santa Catarina, Brazil e-mail: [email protected]; [email protected]; [email protected]
ABSTRACT
Epoxy resin is one of the most important polymeric matrixes for diverse uses, such as aeronautical, mobile, electronics and others. Providing a material capable of self-healing microcracks will allow it to have a more reliable and longer use. In order to study this new property of self-healing to an epoxy resin, a Differential Scanning Calorimetry (DSC) study was carried out to measure physical chemical properties such as activation energy, enthalpy of polymerization, order of reaction and pre-exponential factor based on an Arrhenius equation modelling. The materials used are diglycidyl ether of bisphenol A (DGBA) as the core material, triethylenetetramine (TETA) and an aminated polydimethylsiloxane (ADM), as curing agent and poly(urea-formaldehyde) (PUF) as microcapsule wall. Tests were done by dynamic and isothermal DSC of systems containing the resin and microencapsulated curing agent and also the resin with the free curing agent. The results showed the necessity of heating for the cure and the self-healing to be initiated.
Keywords: Epoxy resin, microencapsulation, self-healing, DSC, kinetics.
1. INTRODUCTION
The use of polymers and composite materials has been increased in structural engineering applications. Usually, these materials are exposed to mechanical and thermal fatigue as well as UV radiation, chemical and environmental change which can lead to the formation of microcracks. These microcracks are difficult to detect and repair, thus compromising its use along time and possibly causing accidents. Moreover, the usual methods of repair have shown to be inefficient [1].
With the proposal of solving this issue are the polymeric composites with self-healing function which permit a new conception for the design of engineering materials, providing long life and more reliable plastic materials for high value-added applications [2]. Conceptually, self-healing polymers containing microcapsules filled with an agent of regeneration, usually monomers and / or primers, dispersed in the polymer matrix. If eventually a crack is generated in the material, this will find the microcapsule that will be broken, releasing the regeneration agent into the crack, which, in turn, will polymerize preventing crack propagation [3-5].
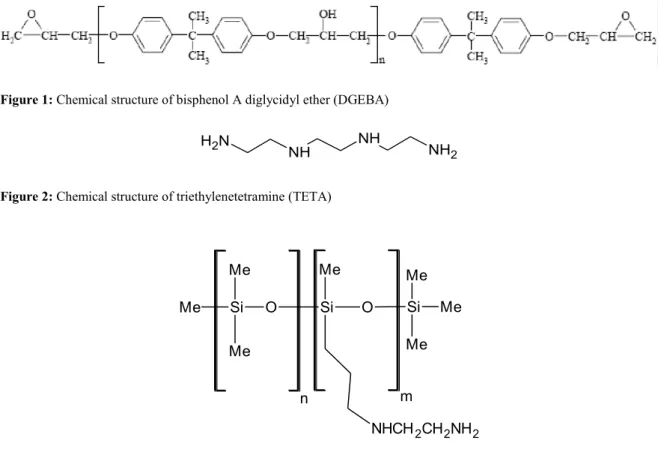
Figure 1: Chemical structure of bisphenol A diglycidyl ether (DGEBA)
N H2
NH NH NH2
Figure 2: Chemical structure oftriethylenetetramine (TETA)
Me Si Me Me O Me Si
NHCH2CH2NH2 O
Me
Si Me
Me
n m
Figure 3: Chemical structure of the aminated polydimethylsiloxane (ADM) used in this work.
The Boerchardt and Daniels approach allows one to calculate the Arrhenius parameters from only a single DSC scan [6]. However, the values of the pre-exponential factor (A) have shown to vary according to the heating rate of the scan [7]. First of all, this approach assumes that the reaction follows the order n and the rate of reaction is describe as Eq. 1.
dα/dt
= K(T)(1-
α
n (1)Where α is the degree of conversion, dα/dt is the rate conversion over time, K is the velocity constant at temperature T, and n which is the order of the reaction. The velocity constant is the one obtained through the kinetic Arrhenius equation (Eq.2), where A is pre-exponential factor, E is the activation energy and R is the ideal gas constant.
� = ��
−�/�� (2)The DSC scan is used to obtain the basic parameters, (dα/dt, α and T) required to solve the equations. And for that, it is assumed that the conversion rate is proportion to the heat flow at time T and the total en-thalpy of this thermal event, the area under the curve, ΔH0, as show in Eq. 3, and for these assumptions, it also requires to assume that the heat rate over the time is directly proportional to the number of moles con-verted during the same period of time.
�� ��
=
�� ��
1
∆�0 (3)
Also, the degree of conversion at time T is assumed to be the rate between the heat from time 0 to T, ΔHp (again, it is the area under de curve from 0 to p) by the total enthalpy of the thermal event, ΔH0, as shown in Eq.4.
� =
��Once these data are obtained, one can have the other Arrhenius parameters through a linear regres-sion taken with 19 more points. The multiple linear regresregres-sion of this set of 20 values of the model z = a + bx + cy following Eq.5, which is obtained by manipulating Eq.1 and Eq.2 will give the pre-exponential factor (A), order of reaction (n) and the activation energy (E).
ln
����= ln � + � ln 1 − � −
�� �1 (5)Also, plotting ln[k(T)] by1/T with the obtained data from the linear regression, a descendent line should appear if all the assumptions made are true and thus, this model is secure to be trusted in this such case.
2. MATERIALS AND METHODS
2.1 Preparation of DGEBA/TETA and DGEBA/ADM mixtures
The epoxy resin used was Araldite GY 251, based on diglycidyl ether of bisphenol A (DGEBA), was mixed in a vessel with HY 956 hardener (based on triethylenetetramine), both manufactured by Huntsman. An ali-quot of the mixture was rapidly transferred to a DSC aluminium crucible and submitted to the assay. A new sample was prepared for every one of the scans so the cure processes would occur only in the equipment. Alternatively, the same procedure was carried out using an aminated polydimethylsiloxane (ADM), commer-cially available as Belsil® ADM 1650.
The resin/hardener ratios were calculated according to the given manufacturer’s amine number, resulting in a 4:1 ratio for DGEBA/TETA and a 10:7 ratio for DGEBA/ADM systems.
2.2 Differential scanning calorimetry
According to the literature [6], a dynamic scan followed by a series of isothermal scanning surrounding the temperature where the thermal event had its peak in the dynamic scan should show if the aimed process fol-lows order n or if it is self-catalytic. A single scan was made for the dynamic and for each temperature of the isotherms. For the dynamic scan, a 10k/min ratio was used under nitrogen 20mL/min flux atmosphere. For the isotherms the temperatures were 60, 80, 90 and 102.5 °C.
3. RESULTS
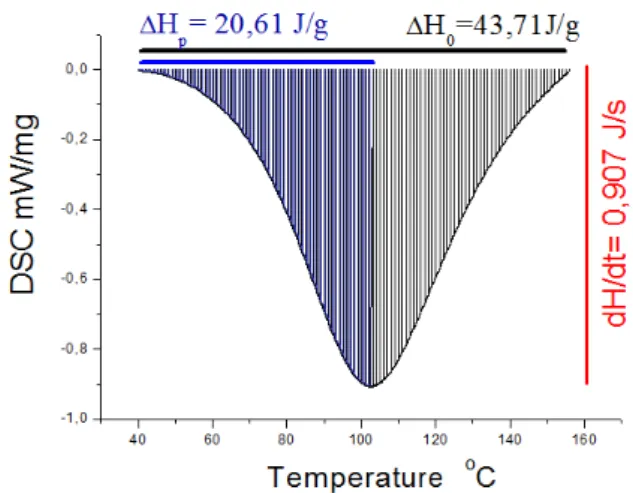
The isotherms show that the systems behave as nth order and, thus, the Boerchardt and Daniels model could be applied. Fig. 4 and Fig. 5 show the normalized dynamic scan for the TETA resin, where it is observed a curing peak at 102.5°C, as well as the values of ΔHp, the total enthalpy, ΔH0, and dH/dt.
Figure 4: DSC scan of DGEBA/TETA system for Boerchardt and Daniels modelling.
same calculations were made for more 19 temperatures. After the linear regression, the equation
z=25.29276+ 1.93325x -10486.78162y was obtained, and according to Eq.5, one can assume that A= 9.64952. 1010 s-1; n=1.9332 and Ea= 87.192 kJ/g.
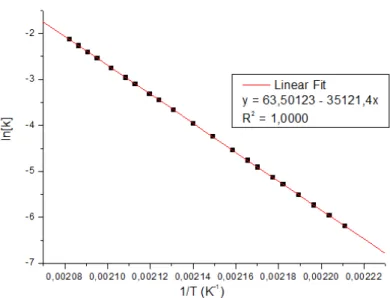
The same procedure was used for the DGEBA/ADM system (Fig. 5), where the curing peak is visualized at 173.1 °C. Using the same parameters of the DGEBA/TETA system for the DSC dynamic and isothermals scans, the resulting equation is z=63,5013+1,7692x - 31521,463y where, Ea= 262,08 kJ/g; A= 3,78673.1027 s-1 and n=1,77.
Figure 5: DSC scans of DGEBA/TETA and DGEBA/ADM systems.
The verification plots were also done for both samples (Fig.6 and Fig. 7, respectively), showing that all the assumptions made in this model are true and, thus, this model is secure to be trusted in such case. In other words, the cure processes is of nth order and self-catalysis does not occur.
Figure 7: Verification plot for DGEBA/ADM systems.
Table 1 summarizes the results. From that, it is clearly seen that the cure of DGEBA/ADM systems occurs at higher temperatures, presenting a much higher activation energy and exponential factor. Further-more, this data shows that if a self-healing material is made with these curing agents, heating should be pro-vided in order to start the polymerization process.
Table 1: Kinetic curing parameters of DGEBA/TETA and DGEBA/ADM systems.
CURING AGENT ACTIVATION ENERGY ORDER OF REACTION PRE-EXPONENTIAL FACTOR
TETA 87,2 kJ/g 1,933 9,65.1010 s-1
ADM 262,1 kJ/g 1,769 3,79.1027 s-1
In comparison, in another calorimetric a study using diethylenetriamine [8], the activation energy was in the same order of magnitude (59.2 kJ/mol). The reaction order, however, was around 1, which possibly denotes a more complex reaction mechanism for tetra- and poly-amines.
4. CONCLUSIONS
The cure process of a diglycidyl ether of bisphenol A (DGBA) resin with triethylenetetramine (TETA) and an aminated polydimethylsiloxane (ADM) as curing agents was evaluated by DSC using the Boerchardt and Daniels approach and it showed to be satisfactory to compare the curing agents potentially useful for self-healing materials, since the cure processes was an n-order reaction. Calorimetric and kinetics data as the order of reaction, pre-exponential factor, enthalpy of polymerization and activation energy were obtained by mathematical modeling based on the Arrhenius equations and DSC dynamic scans. Also, the data showed the necessity of providing heat in order to initiate the polymerization processes, which starts at 40 °C for TETA and at for 180 °C ADM. Thus, the respective activation energies for the DGEBA/TETA (Ea = 87.2 kJ/g) and DGEBA/ADM (Ea = 262.1 kJ/g) systems must be taken into account when self-healing is aimed.
5. ACKNOWLEDGMENTS
CNPq, CAPES, FAPESC.
6. BIBLIOGRAPHY
[2] WU, D. Y., MEURE, S., SOLOMON, D., “Self-healing polymeric materials: A review of recent devel-opments”, Progress in Polymer Science, v. 33, pp. 479-522, 2008.
[3] BLAISZIK, B.J., SOTTOS, N.R., E WHITE, S.R., “Nanocapsules for self-healing materials”, Composites Science and Technology, v. 68, pp. 978–986, 2008.
[4] KESSLER, M.R., SOTTOS, N.R., WHITE, S.R. “Self-healing structural composite materials”, Compo-sites Part A, v. 34, pp. 743–753, 2003.
[5] KNOP, W. R., MEIER, M. M., PEZZIN, S. H., “Mechanical behavior of epoxy systems using microen-capsulated amino-functional siloxanes”, AIP Conference Proceedings, v.1779, pp. 080011, 2016.
[6] COSTA, M.L., PARDINI, L.C., REZENDE, M.C., “Métodos de Estudo da Cinética de Cura de Resinas Epóxi”, Polímeros, v.9, pp 37-44, 1999.
[7] JANG, W., A review of DSC kinetic methods, Du Pont Instruments. 1981.