ISSN 0104-6632 Printed in Brazil
www.abeq.org.br/bjche
Vol. 25, No. 03, pp. 553 - 561, July - September, 2008
Brazilian Journal
of Chemical
Engineering
EXTRACION OF CITRIC ACID IN 2-OCTANOL
AND 2-PROPANOL SOLUTIONS
CONTAINING TOMAC: AN EQUILIBRIA
AND A LSER MODEL
H. Uslu
*Beykent University, Engineering & Architecture Faculty, Department
of Chemical Engineering, Ayazağa Köyü, İstanbul, Turkey.
E-mail: [email protected]
(Received: Feburary 1, 2007 ; Accepted: March 1, 2008)
Abstract - Studies on the extraction of citric acid by TOMAC (trioctyl methyl ammonium chloride) dissolved in 2-propanol and 2-octanol (active solvents) and their mixture (1 : 1 volume ratio) are reported. Experimental results of batch extraction experiments are calculated and reported for partitioning coefficients (D), loading factors (Z), and extraction efficiency (E). All measurements were carried out at 298.15 K. The results of the liquid-liquid equilibrium measurements were correlated with a linear solvation energy relationship (LSER) model which takes into account physical interactions. Solvatochromic parameters of the model were obtained
from the literature. The remaining parameters were fitted to the experimental results.Experimental results for
the liquid-liquid equilibrium were compared to the model.
Keywords: Extraction LSER; 2-propanol; 2-octanol; Citric acid; TOMAC.
INTRODUCTION
Tertiary aliphatic amines with C7 to C10/C12 alkyl
groups (TAA) have been proposed as suitable extractants for carboxylic and hydroxycarboxylic acids (Vanura and Kuca, 1976; Wennersten, 1983; Kertes and King 1996). The amine extractants are dissolved in a diluent that dilutes the extractant to the desired composition and controls the viscosity and density of the solvent phase. It has been found that, in extraction of acids by amine, the type of diluent and the composition of extraction mixture affect the equilibrium.
Reactive liquid-liquid extraction of the acid by a suitable extractant has been found to be a promising alternative to conventional processes. Physical extraction using common organic solvents has
acids because of their high affinity for water, and consequently, low partitioning coefficients. Accordingly, for reactive extraction, extractants with functional groups effective for reversible complexation with acids should be used. The most suitable extractants are the phosphorous-based oxygen-containing extractants and amine-based extractants. Polar diluents have been shown to be more effective diluents than nonpolar ones due to their higher partitioning coefficients (Tamada and King, 1990; Poposka et al., 1998; Tamada et al., 1990; Yang, et al., 1991; Yerger and Barrow, 1955).
amine complex. Some authors suggest the formation of acid-amine complexes of only one type (one acid, one amine) or (one acid, two amines), depending on the diluent (Bizek et al., 1992; Qin et al., 2003). Others have suggested the formation of at least two types of acid + amine complex. It has been found that diluents, especially those with functional groups, can significantly affect the extraction behavior of amines. The stoichiometry of the solute-amine complex and the loading of amine as well as the third phase formation are affected by the diluent. Third phase formation is not desired in the extraction processes. The effect of the diluent can be understood in terms of its ability to solvate to organic phase species; therefore it is necessary to distinguish general solvation from electrostatic, dispersion or other forces and specific solvation due to hydrogen bonding (Schmidt, et all. 1980).
The extraction process can be described by the reaction,
+
-4 4
HA + R N Cl → HA . R N + Cl
The resulting acid-amine complexes are supposed to be stabilized due to the hydrogen bonding with the diluent. The structure of the acid-amine complex in the diluents was determined by Yerger and Barrow (1955). They proposed that the first acid interacts directly with the amine to form an ion pair and the OH of the carboxyl of the second acid forms a hydrogen bond with the conjugated CO of the carboxylate of the first acid to form a complex.
Uslu examined extraction of propionic acid with Alamine 336 in toluene solution and he found a very high distribution coefficient (Uslu, 2006). Furthermore, Inci studied the extraction of citric acid by Alamine 336 and trioctylamine in four diluting solvents and determined that partitioning coefficients for citric acid are high (Inci, 2002). However, there are no data for citric acid and trioctyl methylammonium chloride in 2-propanol, 2-octanol and a mixture of the two. In the present work citric acid was extracted from aqueous solutions by trioctyl methylammonium chloride (0.36 to 1.77 mol. L-1).
Extraction experiments were carried out with trioctyl methylammonium chloride dissolved in the active diluents 2-propanol and 2-octanol. As a result of the batch extraction experiments, partitioning coefficients were calculated. In addition to partitioning coefficients, extraction efficiency and variation of loading factors were obtained.
THEORETICAL
Equilibrium Theory
The extraction of citric acid (HA) with trioctyl methylammonium chloride (R4N Cl) can be
described by the following reaction.
4
+
-4
HA (1) + *R NCl (2)
*(HA) .(R N) (3) + Cl (4)
↔
(1)
where HA represents the nondissociated part of the acid present in the aqueous phase and organic phase species are marked with an asterisk (*). Reaction 1 can be characterized by the overall thermodynamic extraction constant K.
3 4 1 2
K = (a ) · ( a ) / (a ) · ( a ) (2)
Eq. 2 can be written in terms of dissociated species–hydrogen ions and acetate anions – as used in the literature on amine extraction of acids. Taking into account the dissociation equilibrium, one can show that both concepts are equivalent, the only difference being in the values of equilibrium constants. Replacing the activities by the products of molalities and molal activity coefficients eq. 2 takes the form
3 3 4 4
1 1 2 2
K = (m · ) · (m · ) /
(m · ) · (m · )
γ γ
γ γ (3)
where mi is the molality of component i and γi, the
molal activity coefficient of component i and where water and diluent are the solvents for the aqueous or organic phases, respectively.
The loading of the extractant, Z, is defined as the total concentration of acid in the organic phase divided by the total concentration of amine in the organic phase (Kertes and King, 1996). The expression for Z can be written in the form
l l
1 2
Z = C / C (4)
In eq. 4, Cl1 is total concentration of acid in the
organic phase, mol/L and Cl 2 is the total concentration
l
1 1
D = C / C (5)
The efficiency of extraction, E, is expressed as
0
1 a
E = [1- (C / C )] 100⋅ (6)
where C 1 is the concentration of acid in the aqueous
phase after extraction and C0a is the initial
concentration of acid in the aqueous phase (İnci, 2002; Chaikorski et al., 1966; Ricker, 1978; Ricker et all., 1979).
LSER Model Theory
According to Kamlet (Kamlet et al., 1983) the linear solvation energy relationship (LSER) that measures the property XYZ in terms of solvent properties is
2 0
XYZ = XYZ + P ( h ) / 100 +
s ( * + d ) + b + a
δ
π δ β α (7)
In eq. 7, where δh is the Hildebrand solubility parameter and π* and δ are the solvatochromic parameters that measure solute + solvent, dipole + dipole, and dipole + induced dipole interactions, respectively. The solvatochromic parameter α scale of solvent HBD (hydrogen-bond donor) acidities describes the ability of the solvent to donate a proton in a solvent-to-solute hdyrogen bond. The β scale of HBA (hydrogen-bond acceptor) basicities provides a measure of the solvent’s ability to accept a proton (donate an electron pair) in a solute-to-solvent hydrogen bond. The coefficients P, s, d, a and b include the properties of the solute come from regression. The values of solvatochromic parameters
π*, δ, α, and β have been found for several hundreds of compounds (Kamlet et al., 1983). Eq. 7 can be adopted to describe the effect of diluents on the values of partitioning coefficients D in the form
0 2 h
lnD = lnD + P ( ) / 100 +
s ( * + d ) + b + a
δ
π δ β α (8)
In eq. 7, the parameters π*, δ, α, and β refer to the diluent, and D represents the partitioning coefficients for an ideal inert diluent. The second term of eq. 8, which contains the solubility parameter δh, does not
affect the values of the objective function significantly. Thus eq. 8 reduces to
0
lnD = lnD +s ( *+d )+ b + a π δ β α (9)
The solvatochromic parameters of the solvent mixtures are calculated according to eq. 10 by (Bizek at al., 1993).
12 1 1 2 2
SP = X SP + (1 - X ) SP (10)
In eq. 10, X1 is the mole fraction of the first
solvent and X2 is the mole fraction of the second
solvent. SP1 is the solvatochromic parameter of the
first solvent and SP2 is the solvatochromic parameter
of the second solvent in the solvent mixtures.
MATERIALS AND METHOD
Materials
Trioctyl methylammonium chloride (M = 442 g/mol), citric acid, and solvents were purchased from Merck Company. All chemicals were used without further purification. Purities of 2-propanol (code=100995) and 2-octanol (code=820925) were >99.7% and >99.6, respectively.
Methods
analyzed and the amount of acid known from preparing the solutions by mass did not exceed 3%. Inci and Uslu studied extraction of gluconic and glycolic acid with an Aliquat 336 + solvent system in accordance with this procedure (Inci et al., 2005; Inci and Uslu, 2005).
RESULTS AND DISCUSSION
Equilibrium Results
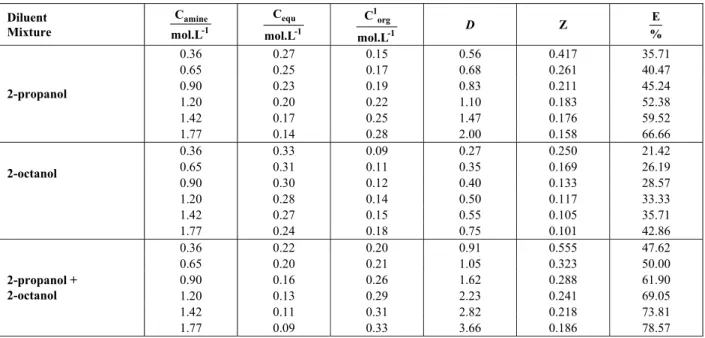
In Table 1 a survey of the experimental liquid-liquid phase equilibrium experiments for the partitioning of citric acid is presented. The amine concentration in the initial organic solution amounted to up to 0.36 mol/L, 0.65 mol/L, 0.90 mol/L, 1.20 mol/L, 1.42 mol/L, and 1.77 mol/L in 2-propanol, 2-octanol, and a mixture of the two (2-porpanol + 2-octanol). The citric acid concentration in the initial aqueous phase was 0.42 mol/L (8%). The experimental results are given in Table 1. In Figure 1 the effect of trioctyl methylammonium chloride in the organic phase on the distribution ratio of citric acid is demonstrated, the ratio of the citric acid concentration in the organic phase to that
in the aqueous phase. In the experiments, the concentration of citric acid in the aqueous phase varied between about 0.27 and 0.09 mol/L. The distribution ratio of citric acid in that range is between about 3.66 and 0.75 mol/L in 2-propanol + 2-octanol.
It can be observed in Table 1 that a considerable amount of citric acid was removed from the aqueous solution by trioctyl methylammonium chloride. The amount of acid removed strongly depended on the concentration of trioctyl methylammonium chloride and diluting solvents. The maximum removal of citric acid was 78.57 % with the propanol + 2-octanol mixture for an initial concentration of trioctyl methylammonium chloride of 1.77 mol/L.
The acid concentration of water at equilibrium (C1) decreased from 0.28 mol/L-1 to 0.15 mol/L-1 with the increase in amount of trioctyl methylammonium chloride from 0.36 mol/L to 1.77 mol/L with 2-propanol.The partitioning coefficientincreased from 0.75 to 2.50 with the increase in the amount of trioctyl methyl ammonium chloride from 0.36 mol/L to 1.77 mol/L for propanol. For propanol and 2-octanol removal of citric acid was respectively 66.66% and 42.86% for initial concentration of trioctyl methyl ammonium chloride of 1.77mol/L.
Table 1: Molar Concentration of Amine in the Organic Phase, Camine,Molar Concentration of Acid in the
Aqueous Phase, Cequ, Molar Concentration of Acid in the Organic Phase, Corg, Partitioning coefficient, D, Loading Factor, Z, Extraction Efficiency, E, for the Extraction of Citric Acid with Trioctyl Methyl
Ammonium Chloride and Diluting Solvents.
Diluent Mixture
amine -1 C
mol.L
equ -1 C
mol.L
1 org
-1 C
mol.L
D Z E
%
0.36 0.27 0.15 0.56 0.417 35.71
0.65 0.25 0.17 0.68 0.261 40.47
0.90 0.23 0.19 0.83 0.211 45.24
1.20 0.20 0.22 1.10 0.183 52.38
1.42 0.17 0.25 1.47 0.176 59.52
2-propanol
1.77 0.14 0.28 2.00 0.158 66.66
0.36 0.33 0.09 0.27 0.250 21.42
0.65 0.31 0.11 0.35 0.169 26.19
0.90 0.30 0.12 0.40 0.133 28.57
1.20 0.28 0.14 0.50 0.117 33.33
1.42 0.27 0.15 0.55 0.105 35.71
2-octanol
1.77 0.24 0.18 0.75 0.101 42.86
0.36 0.22 0.20 0.91 0.555 47.62
0.65 0.20 0.21 1.05 0.323 50.00
0.90 0.16 0.26 1.62 0.288 61.90
1.20 0.13 0.29 2.23 0.241 69.05
1.42 0.11 0.31 2.82 0.218 73.81
2-propanol + 2-octanol
0 0.5 1 1.5 2 2.5 3 3.5 4
0 0.5 1 1.5 2
C l2 / (mol/L)
D
Figure 1: Partitioning coefficients, D, vs. Cl2 ,concentration of trioctyl methylammonium chloride
in different diluting solvents: ■, 2-octanol; ◊, 2-propanol ▲; 2-propanol + 2-octanol.
Extraction of carboxylic acids with tertiary amine + solvent systems can be explained by the formation of acid-amine complexes, which are affected by the diluents in different ways. Solvation of the complex by the diluent is a critical factor in the extraction of acid. The interactions between the complex and diluent can be divided into general solvation and specific interactions of the diluent with the complex. Polar diluents have been shown to be more effective diluents than inert ones (nonpolar) due to the higher distributions.
In Figure 1 the influence of trioctyl methylammonium chloride in the organic phase on
the distribution ratio of citric acid is demonstrated. In the experiments, the concentration of citric acid in the aqueous phase varied between about 0.33 and 0.09 mol/L. The distribution ratio of citric acid in that range was between about 3.66 and 0.27.
In Figure 2, the effect of trioctyl methylammonium chloride concentration on loading is shown. The loading curve is a plot of loading factor (Z) vs. amine concentration. In this work, the loading factor of all solvent mixtures increased as the concentrations of trioctyl methylammonium chloride (Aliquat 336) decreased. The data on distribution data of citric acid between water and solvents are presented in Table 2.
0 0.1 0.2 0.3 0.4 0.5 0.6
0 0.5 1 1.5 2
C l
2 / ( m o l/ L)
Z
Figure 2: Loading factors, Z, vs Cl2, concentration of trioctyl methylammonium chloride
Table 2:Molar Concentration of Acid in the Aqueous Phase, Cequ, Molar Concentration of Acid in the Organic Phase, Corg, Partitioning coefficient, D, Extraction Efficiency, E, for
the Extraction of Citric Acid between Solvents and Water.
Diluent Mixture
equ -1 C
mol.L
1 org
-1 C
mol.L
D E
%
2-propanol 0.31 0.11 0.355 26.19
2-octanol 0.35 0.07 0.200 16.66
2-propanol + 2-octanol 0.28 0.14 0.500 33.33
LSER Model Results
Kamlet et al., 1983 gave the values of solvatochromic parameters for several hundred compounds. Knowing the values of the D, s, d, b, and a parameters for the given extraction system (trioctyl methylammonium chloride + aqueous citric acid in this case) eq, 9 enabled to estimatation of partitioning coefficients for a wide range of diluents, for which a comparatively narrow confidence interval was found.
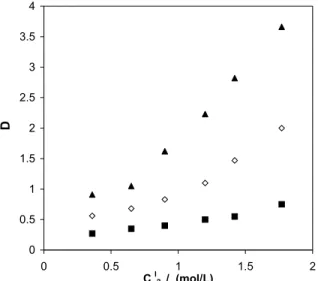
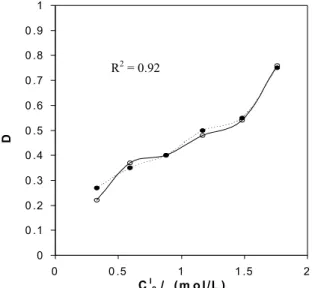
The values of solvatochromic parameters of diluents were taken from Table 3. The remaining parameters were fitted to the experimental results. Experimental results are compared to model predictions in Table 4 and Figures 3 and 4. It can be seen that the final correlation gives a good description of the distribution of citric acid over a wide range of concentration. The values of D, s, d, b, and a are presented in Table 5.
For the optimal estimation of the model parameters, a regression technique using a computer program (ANALYSE) minimized deviation between the model prediction and experimental data. All predicted partition coefficients agree well with each other, and also the agreement between predictions and measurements is acceptable considering experimental uncertainty. The estimated values of
the parameters of the model are presented in Table 5. The comparison of model simulation and experimental data for the partitioning coefficient of citric acid is given in Table 4 and Figures 3 and 4. The experimental data show a good correlation with the calculated values. It can be concluded that by using this model, distribution coefficents for citric acid in the water and amine + diluent system can be described.
The system constants in Tables 3 to 5 reveal that the partition coefficients are strongly correlated with thea partition coefficient of a solute, which means that the organic solute-amine partitioning equilibrium of a solute is strongly affected by the cavity effect and dispersive solute-amine interactions. The solute hydrogen acidity and basicity, a and b, also show a significant correlation with the partition coefficient. This confirms that organic solvent serves as both hydrogen donor and acceptor. The relative size of the standardized system constants (β), which are the regression coefficients derived from standardized variables, relays information on the relative importance of different types of solute-solvent interactions, suggesting that the strength of the interaction decreases from dispersive interactions, hydrogen bonding, solute/solvent and σ /π electron pair interaction to solute-solvent and dipolarity-polarizability interaction.
R2 = 0.92
0 0.5 1 1.5 2 2.5
0 0.5 1 1.5 2
C l2 / ( m o l/ L)
D
0 0 . 1 0 . 2 0 . 3 0 . 4 0 . 5 0 . 6 0 . 7 0 . 8 0 . 9 1
0 0 . 5 1 1 . 5 2
Cl2 / ( m o l /L )
D
R2 = 0.92
Figure 4: Variation in partitioning coefficients, D, vs. concentration of trioctyl methylammonium chloride, Cl 2, and model predictions for 2-octanol; ●, experimental ; --, model.
Table 3: Solvatohromic Parameters, Hydrogen-bond Donor Acidities,π* and δ, Hydrogen-
bond Acceptor Basicities, α, β, for propanol and octanol. (Kamlet et all.)
π* β α δ
propanol 0.52 0.95 0.78 0
octanol 0.40 0.45 0.33 0
Table 4: Molar concentration of Amine in the Organic Phase, Camine, Experimental Results,
D, Model Results, Dl, for comparison of experimental results and model predictions.
Diluents amine
-1 C
mol.L D D
l
0.36 0.56 0.61 0.65 0.68 0.62 0.90 0.83 0.88 1.20 1.10 1.05 1.42 1.47 1.44
2-propanol
1.77 2.00 2.07 0.36 0.27 0.22 0.65 0.35 0.37 0.90 0.40 0.40 1.20 0.50 0.48 1.42 0.55 1.54
2-octanol
1.77 0.75 1.76
Table 5: The values of LSER model parameters (s, d, b, a), coefficient of linear regression, R2.
lnD0 S d a b R2
The root mean square deviations (rmsd) are calculated from the difference between the experimental data and the predictions of the LSER model using the following equation:
n
i,exp i,calc i 1
1
RMSD (D D ) N =
=
∑
− (11)where Di,exp is the experimental distribution
coefficient and Di,calc is the calculated distribution
coefficient. N is the number of experimental data. The rmsd value of the LSER model was found to be 0.083.
The rmsd value shows that all predicted distribution coefficients agree well with each other, and also that the agreement between predictions and measurements is acceptable considering experimental uncertainty.
CONCLUSIONS
In this study, the maximum removal of citric acid is 78.57% with 2-propanol + 2-octanol at an initial concentration of trioctyl methylammonium chloride of 1.77 mol/L. The maximum extraction efficiencies for diluents at a maximum Aliquat 336 were found to be
2-propanol + 2-octanol > 2-propanol >> 2-octanol
The values of distribution coefficients can be correlated with the solvatochromic parameters of the diluents, π*, δ, α, and β, in accordance with eq. (9). The LSER model predicted distribution coefficients and measurements of distribution coefficients agree well with each other and are acceptable considering experimental uncertainty, R2, is calculated to be 0.92.
The resulting fitting curves are included in Figures 3, 4, and 5. The resulting LSER regression is
ln D = 0.3287+1.2754 ( * - 0 )-1.1611 +2.0613 π δ β α
This equation was used to predict lnD for the organic solutes.
REFERENCES
Bizek, V., Horacek, J., and Kousova, M., Amine Extraction of Citric Acid: Effect of Diluent, Chem. Eng. Science, 48, 1447 (1993).
Bizek, V., Horacek, J., Kousova, A., Herberger, A., and Prochazka, J., Mathematical Model of Extraction of Malic Acid with Amine, Chem. Eng.. Sci., 47, 1433 (1992).
Chaikorski, A. A., Niklskii, B. P. and Mikhailov, B. A., Complex Formation in Nonaqueous Solutions X. Interaction of Tridecylamine with Citric Acid, Sov. Radiochem., 152 (1966).
İnci, İ., Extraction of aqueous solution of gluconic acid with organic solutions of Alamine 336, Chem. Biochem. Eng. Q. 16, 185 (2002).
Inci, I. and Uslu, H., Extraction of Glycolic Acid from Aqueous Solutions by Trioctyl Methylammonium Chloride and Organic Solvents, J. Chem. Eng. Data., 50, 536 (2005). Inci, I., Uslu, H., and Ayhan S. T., Partitioning of
Gluconic Acid between Water and Trioctyl Methylammonium Chloride and Organic Solvents, J. Chem. Eng. Data 50, 961 (2005). Kamlet, M. J., Abboud, M., Abraham, M. H., and
Taft, R. W., Linear Solvation Energy Relationships, 23. A Comprehensive Collection of the Solvatochromic Parameters, п*, α, β, and Some Methods for Simplifying the Generalized Solvatochromic Equation, J. Org. Chem., 48, 2877 (1983).
Kertes, A. S. and King, C. J., Extraction Chemistry of Fermentation Product Carboxylic Acids, Biotechnol. Bioeng., 28, 269 (1996).
Kirsch, T. and Maurer, G., Distribution of Oxalic Acid between Water and Tri-n-Octylamine, Ind. Eng. Chem. Res., 35, 1722 (1996).
Qin, W., Yaohong, Z., Zhenyui, L., and Youyuan, D., Extraction Equilibria of Glycolic Acid and Glyoxylic Acid with Trialkylphospine Oxide and Trioctylamine as Extractant, J. Chem. Eng. Data, 48, 430 (2003).
Poposka, F. A., Nikolovski, K., and Tomovska, R., Kinetics, Mechanism and Mathematical Models of Extraction of Citric Acid with Isodecanol/n-Paraffins Solutions of Trioctylamine, Chem. Eng. Sci., 18, 3227-3237 (1998).
Ricker, N. L., Recovery of Carboxylic Acids and Related Organic Chemicals from Wastewater by Solvent Extraction, PhD. Dissertation, University of California, Berkeley (1978).
Ricker, N. L., Michels, J. N., and King, C. J., Solvent Properties of Organic Bases for Extraction of Citric Acid from Water, J. Sep. Proc. Techno., 1, 36 (1979).
Various Monobasic Acids by Salts of Quarternary Ammonium Bases, Russ. J. Inorg. Chem., 25, 1062 (1980).
Tamada, J. A. and King, C. J., Extraction of Carboxylic Acids with Amine Extractants 2: Chemical Interactions and Interpretation of Data, Ind. Eng. Chem. Res., 9, 1327 (1990).
Tamada, J. A., Kertes A. S., and King, C. J., Extraction of Carboxylic Acids with Amine Extractants 1: Equilibria and Law of Mass Action Modelling, Ind. Eng. Chem. Res., 29, 1319 (1990).
Uslu, H., Linear Solvation Energy Relationship (LSER) Modeling and Kinetic Studies on Propionic Acid Reactive Extraction Using Alamine 336 in a Toluene Solution, Ind. Eng.
Chem. Res., 16, 5788 (2006).
Wennersten, R., The Extraction of Malic Acid from Fermentation Broth using a Solution of Tertiary Amine, J. Chem. Technol. Biotechnol., 33, 85 (1983).
Vanura, P. and Kuca, L., Extraction of Citric Acid by the Toluene Solutions of Trilaurylamine, Collect. Checz. Chem. Commun., 41, 2857 (1976).
Yang, S. T., White, S. A., and Hsu, S. T., Extraction of Carboxylic Acids with Tertiary and
Quarternary Amines, Ind. Eng. Chem. Res., 30, 1335 (1991).