Article
Printed in Brazil - ©2015 Sociedade Brasileira de Química 0103 - 5053 $6.00+0.00
A
*e-mail: [email protected]
Separation, Concentration and Determination of Trace Thiamphenicol in Egg, Milk
and Honey Using Polyoxyethylene Lauryl Ether-Salt Aqueous Two-Phase System
Coupled with High Performance Liquid Chromatography
Hui Yao,a,b Yang Lu,a,b Juan Han,a Yun Wanga and Yongsheng Yan*,a
aSchool of Chemistry and Chemical Engineering, Jiangsu University, 301 Xuefu Road,
212013 Zhenjiang, China
bSchool of Computer Science, Jilin Normal University, 1301 Haifeng Street, 136000 Siping, China
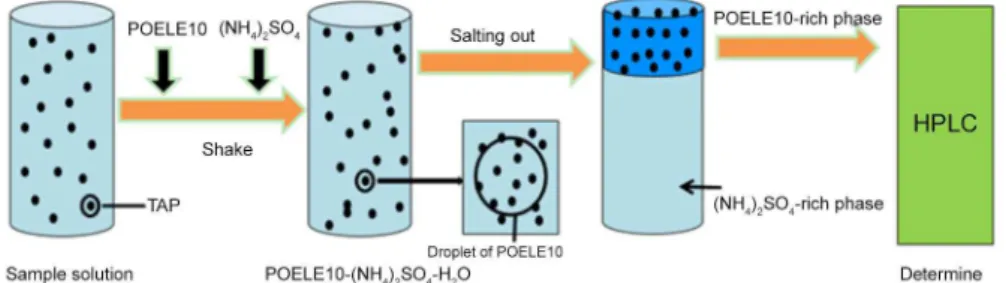
As a pretreatment technique to trace analysis, polyoxyethylene lauryl ether (POELE10)-salt aqueous two-phase extraction system (ATPES) is coupled with high performance liquid chromatography to analyse thiamphenicol (TAP) in egg, milk and honey. The analysis of the phase behaviors of the ATPES found that the extraction efficiency and enrichment factor of TAP was influenced by the types of salts, the concentration of salt, the concentration of POELE10, the concentration of 1-propanol and the temperature. The optimized conditions of experiment were determined in the multi-factor experiment by using response surface methodology. The extraction efficiency of TAP is up to 99.59% and the optimal values of enrichment factor of TAP was 27 under the optimized conditions. The limit of detection and the limit of quantification of TAP are 0.5 µg kg−1 and 1.5 µg kg−1, which meet the needs of determination of trace or ultratrace TAP in food.
Keywords: aqueous two-phase system, polyoxyethylene lauryl ether,trace thiamphenicol,
determination
Introduction
Thiamphenicol1
[D(+)-threo-2-di-chloroacetamido-1-(4-methylsulphonylphenyl) propane-1, 3-diol; (TAP)] is an analogue of chloramphenicol in which the nitro group on the benzene ring is replaced with a methylsulfonic group (Figure 1).2 As a member of chloramphenicol family, TAP is
a broad spectrum antibiotics against most of Gram negative and Gram positive pathogens and especially effective against anaerobic organisms. It was reported that TAP has excellent performance in the treatment of infectious diseases, including respiratory infections, bacterial prostatitis and venereal diseases.3 TAP has been widely
used in veterinary medicine for the treatments of various infections. TAP has been found in various foods, such as fish, liver, milk, poultry, honey and even egg because of the abuse of TAP in various types of animal farms. In the USA, China and European Union, the clinical applications of TAP is strictly controlled because of the potential for the emergence of drug resistant bacteria and the drug residues in animal tissues.4 However, illegal use of TAP in livestock
and aquaculture still exists because of its steady antibiosis effectiveness and low price.
Many different analytical methods have been reported for the determination of TAP in animal tissues, such
as liquid chromatography (LC),5 gas chromatography
(GC),6 LC-mass spectrometry (MS),7 LC-MS/MS,8 and
GC-MS.9 However, these methods have some defects
and insufficiencies such as long sample preparation time, complex analyzing processes and expensive equipment. Therefore, it is necessary to develop a simple, rapid and sensitive method to determine the concentration of TAP in food commodities.
Aqueous two-phase system (ATPS)10 is a powerful
green extraction technique, and it is more and more widely applied in the separation and extraction of the biological materials, including nucleic acids,11 proteins,12 viruses,13
S H3C O
O
OH
N H
Cl
Cl O
OH
antibiotics14 and other biological molecules.15 The ATPSs
mainly divide into four kinds that are the polymer-polymer ATPSs,16 polymer-salt ATPSs,17 ion liquid-salt ATPSs18 and
micromolecule alcohol-salt ATPSs.19 However, there are
no public reports on the ATPS separation and enrichment method for TAP. In our previous article,20 it was found
that nonionic surfactant polyoxyethylene (10) lauryl ether (POELE10, C32H66O11) was an appropriate choice to form polymer-salt ATPS because it consisted of the hydrophobic alkyl domain and hydrophilic polyoxyethylene tail. The phase behaviors of the ATPSs, composed of POELE10 and various salts, were studied and it was found that the critical concentration of POELE10 was quite low for the POELE10-salt ATPS forming. Therefore, the POELE10-salt ATPSs can work well in the isolation and concentration of materials. In this paper, we studied the extraction and determination of TAP by using POELE10-salt ATPSs coupled with high performance liquid chromatography (HPLC).
Experimental
Materials
Salts (K2HPO4, ZnSO4, (NH4)2SO4, NaH2PO4,
K2C4H4O4, Na2C4H4O6 and K2C2O4) and 1-propanol were purchased from the Sinopharm Chemical Reagent Co., Ltd. (Shanghai, China), which were analytical grade reagents (GR, min. 99% by mass fraction). Nonionic surfactants POELE10 with a quoted purity of greater than 0.99 mass fractions was obtained from Aladdin reagent company (Shanghai, China). The thiamphenicol standard sample was purchased from Chinese National Institute for the Control of Pharmaceutical and Biological Products (Beijing, China). The water used in experiments was double distilled. All reagents were used without further purification.
Apparatus and procedure
An HPLC (Agilent 1200, Agilent, USA) equipped with UV-Vis detector was employed for the qualitative
and quantitative analysis of the TAP. The Agilent ChemStation software was used to control the machine and process data. An analytical balance (BS124S, Beijing Sartorius Instrument Co., China) with an uncertainty of ± 1.0 × 10⁻⁷ kg was used to weigh.
The appropriate amounts of POELE10, salt, 1-propanol and TAP were put into the vessel from stock solutions, and water was added until the total volume is up to 10 mL. The mixed solution was kept for 30 min under mechanical shaking, and then it was placed in the thermostat water bath. The temperature of the thermostat water bath was maintained at the constant temperature (T = 298.15 K). The concentration of TAP in the top phase was determined by using HPLC when the system was separated to two phases. An Eclipse XDB-C18 reversed-phase column (serial No. G1314B, 250 mm × 4.6 mm, 5 µm) was used for the chromatographic separation, and the column temperature was at 298.15 K. The mobile phase consisted of water and methanol with the ratio of 3:1, and the flow rate was 1.0 mL min−1. The injected volume of sample was 20 µL, and the column effluent was monitored at the wavelength of 225 nm (Figure 2).
Preparation of real samples
Egg, milk, and honey samples were purchased from the local supermarket. 50 mL of sample and 20 mL of trichloroacetic acid (10%) were placed into a 100 mL tube, and the TAP working solution was added. Then, water was added into the tube until the total volume reached 100 mL. The mixture solution was shaken by using homogenizer-disperser (SJB-S450, Shanghai Siehe Instrument Co., China) until it was thoroughly mixed. The sample was put into centrifugal tube and was centrifuged at 4000 rpm for 30 min (Anke TDL-4, Shanghai Chemical Machinery Plant Co., Ltd., China). The supernatant was taken out and filtered through the microfilter (Fushun filter paper factory, China) with a pore size of 0.45 µm to remove the proteins. The homogenization and centrifugation was carried out at room temperature. Finally, the filter liquor was stored at 4 °C.
Determination of the partition parameters of TAP
The enrichment factor and extraction efficiency was used to measure the standard of partition and enrichment efficiency of TAP. The enrichment factor (F) was defined as a ratio of the concentration of TAP in the top phase to that in the initial system.
s t
C C
F= (1)
where Ct was the concentration of TAP in the top phase, Cs was the concentration of TAP in the initial system before the two phases were separated. The extraction efficiency (E%) was calculated by the following equation:
100
%= × ×
s t t
m V C
E (2)
where Ct was the concentration of TAP in the top phase, Vt was the column of top phase, ms was the total mass of
TAP added in the initial system. The phase ratio (R%) was defined as a ratio of the volume of top phase to the volume of bottom phase.
100
%= ×
b t
V V
R (3)
where Vt and Vb were the volume of top phase and bottom
phase.
Statistical analysis
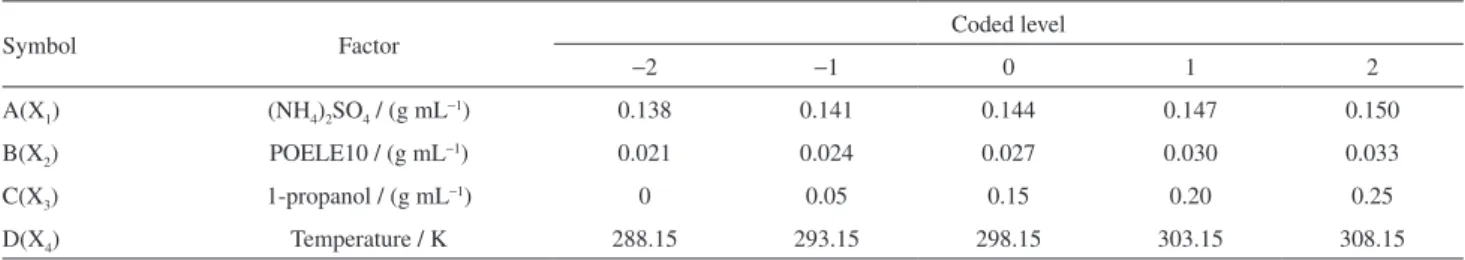
The range of optimized conditions of the aqueous two phase extraction system for the extraction and determination of trace TAP was obtained by the single factor test. The response surface methodology (RSM) was used to design the multiple-factor and multiple-level experiment to determine the optimized conditions of experiment. RSM includes two steps: the factorial designs and the regression analysis. In this experiment, factorial design of RSM was
performed by a central composite design (CCD) with four factors and five levels. The independent factors were the concentration of (NH4)2SO4 (X1), the concentration
of POELE10 (X2), the concentration of 1-propanol (X3) and the temperature (X4). The CCD was applied by using
Design-Expert 7.0. The four factors at five levels are shown in Table 1.
The regression analysis of experimental data was performed by the response surface regression procedure, and analysis model was conducted according to the following quadratic equation (equation 4).
∑
∑
∑
+ ++ =
ij
j i ij i
i ii i
i
iX X X X
Y β β β 2 β
0 (4)
where Y is the response, Xi and Xj represent the factors,
β0, βi, βii and βij are regression coefficient for the intercept, linear, quadratic and interaction coefficients, respectively. The ranges of i and j is 1 to 4. The evaluation method of statistical significance of model was F-test.
Results and Discussion
The choice of salt for ATPS
In our previous work,20 we have discussed some
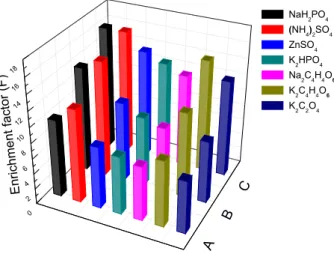
ATPSs composed of POELE10 and various salts, and found that the salt type is one important factor affecting the phase diagram. This means that salt type will also affect the extraction of TAP. Thus, the study on the extraction efficiency and enrichment factor of TAP using different ATPS that contained POELE10 and various salts (K2HPO4,
ZnSO4, (NH4)2SO4, NaH2PO4, K2C4H4O, Na2C4H4O6 and K2C2O4) was conducted. The extraction efficiency and
enrichment factor of the various ATPSs for TAP at three temperatures are shown in Figures 3 and 4. It was found that POELE10-(NH4)2SO4 ATPS is obviously better than other POELE10-salts ATPSs in terms of the extraction efficiency and enrichment factor (Figures 3 and 4). The main reason for POELE10-salts to present different performance in extraction of TAP is out ability of salt. The salting-out ability of salt is affected by many factors, such as the
Table 1. Factors and their levels of CCD for extraction of TAP using ATPS
Symbol Factor Coded level
−2 −1 0 1 2
A(X1) (NH4)2SO4 / (g mL−1) 0.138 0.141 0.144 0.147 0.150
B(X2) POELE10 / (g mL−1) 0.021 0.024 0.027 0.030 0.033
C(X3) 1-propanol / (g mL−1) 0 0.05 0.15 0.20 0.25
valence of ions, the Gibbs free energy of hydration of the ions and the effective excluded volume.21 Therefore, the
POELE10-(NH4)2SO4 ATPSwas used to separate and enrich
TAP in this work.
TAP distribution in the POELE10-(NH4)2SO4 ATPS
Effect of concentration of (NH4)2SO4 on the distribution
From our previous research,21 it was found that the
binodal curve of POELE10-salt ATPS moves towards the axis with the increase in the concentration of salt. As an important factor affecting the distribution of TAP in two phases, the concentration of (NH4)2SO4 was discussed.
The extraction efficiency and enrichment factor of TAP at three temperatures was studied when the concentration of (NH4)2SO4 ranged from 0.126 g mL−1 to 0.159 g mL−1 and the other parameters were fixed, and the experiment
results are given in Figure 5. It was found that the extraction efficiency and enrichment factor improved with increase of (NH4)2SO4 concentration from Figure 5. That is because the
salting-out strength of system enhanced with increase of salt concentration, and therefore, more TAP was excluded to the rich-POELE10 phase from rich-salt phase. Figure 5 showed that the enrichment factor is too low when the concentration of (NH4)2SO4 is below 0.138 g mL−1 and the extraction efficiency and enrichment factor slowly grows when the concentration of (NH4)2SO4 is more than 0.150 g mL−1. Therefore, the ideal range of the concentration of (NH4)2SO4
is from 0.138 g mL−1 to 0.150 g mL−1 for the subsequent multi-factor experiment.
Effect of the added volume of POELE10 on the distribution of TAP
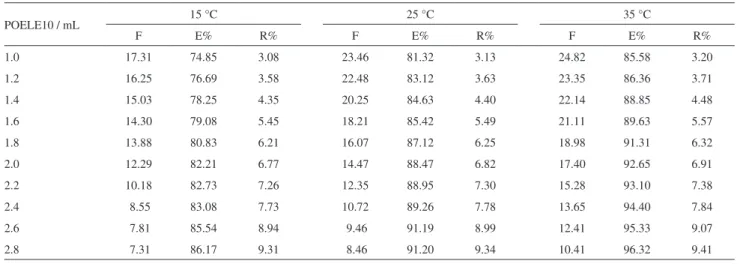
The volume of POELE10 added at the experiment is another important affecting factor for phase diagram, and the two phases area will expand with the added volume of POELE10 rising. We have determined the extraction efficiency (E%), enrichment factor (F) and phase ratio (R%) for the extraction system in which the volume of POELE10 is different, and the result is shown in Table 2. In Table 2, it was found that with the increase in the volume of POELE10, the extraction efficiency of TAP increased, however, the enrichment factor decreased. The reason is that the volume of top phase increased with the increase in the addition content of POELE10, which can be seen from the phase ratio (R%). This will cause the concentration of TAP in top phase to decrease. The concentration of TAP in top phase (Ct)
decreased, and the concentration of TAP in total system (Cs) remained the same, and therefore, the enrichment factor (F) would decrease. In the multi-factor experiment, the range of concentration of POELE10 will be set between 0.021 g mL−1 (volume: 1.4 mL) and 0.033 g mL−1 (volume: 2.2 mL) for balancing extraction efficiency and enrichment factor. 0 20 40 60 80 100 C B A
NaH2PO4
(NH4)2SO4 ZnSO4 K2HPO4 Na2C4H4O6
K2C4H4O6 K2C2O4
E x tr a c ti o n e ff c ie n c y (E% )
Figure 3. The changes of the extraction efficiency of TAP for the different
POELE10-salts ATPSs at three temperatures. A: 15 °C, B: 25 °C and C: 35 °C.
0 2 4 6 8 10 12 14 16 18 A C B
NaH2PO4
(NH4)2SO4 ZnSO4
K2HPO4 Na2C4H4O6 K2C4H4O6 K2C2O4
Enrichment factor
(F
)
Figure 4. The changes of the enrichment factor of TAP for the different
POELE10-salts ATPSs at three temperatures. A: 15 °C, B: 25 °C and C: 35 °C.
0.120 0.125 0.130 0.135 0.140 0.145 0.150 0.155 0.160 0.165 0 10 20 30 40 50 60 70 80 90 100 C: B: A: E n ri c h m e n t factor (F ) Extraction effcienc y (E% )
Concentration of(NH4)2SO4/(g mL-1
)
Extraction effciency (E%)
0 2 4 6 8 10 12 14 16 18 20
Enrichment factor (F)
Extraction effciency (E%) Enrichment factor (F)
Extraction effciency (E%) Enrichment factor (F)
Figure 5. The changes of the extraction efficiency and enrichment factor of
TAP with the concentration of (NH4)2SO4. A: 15 °C, B: 25 °C and C: 35 °C. 0 20 40 60 80 100 C B A
NaH2PO4
(NH4)2SO4
ZnSO4 K2HPO4 Na2C4H4O6 K2C4H4O6 K2C2O4
E x tr a c ti o n e ff c ie n c y (E% ) 0 2 4 6 8 10 12 14 16 18 A C B
NaH2PO4
(NH4)2SO4 ZnSO4 K2HPO4
Na2C4H4O6 K2C4H4O6 K2C2O4
Enrichment factor
(F
)
0.120 0.125 0.130 0.135 0.140 0.145 0.150 0.155 0.160 0.165 0 10 20 30 40 50 60 70 80 90 100 C: B: A: E n ri c h m e n t factor (F ) Extraction effcienc y (E% )
Concentration of(NH4)2SO4/(g mL-1 )
Extraction effciency (E%)
0 2 4 6 8 10 12 14 16 18 20
Effect of temperature on the distribution
Besides the concentration of two forming phase materials, temperature is one important influence
on the phase diagram of ATPS.20 It was found in
our previous works,21 that the phase-forming ability
of POELE10-ATPSs enhanced with the increase in temperature. Thus, temperature will influence the extraction efficiency and enrichment factor of TAP. The effect of temperature on the extraction efficiency and enrichment factor was studied and their relationship is shown in Figures 6 and 7. With the rising temperature, the extraction efficiency and enrichment factor increased. The hydrophobicity of POELE10 enhanced with the increase of the system temperature,21 which makes TAP
more prone to enrich in top phase. Because TAP may be inactivated when the temperature is too high or low and the extraction is easier to implement at near room
temperature, the temperature varies from 15 °C to 35 °C in the multi-factor experiment.
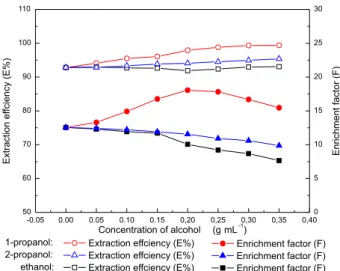
Effect of added amount of ethanol, 1-propanol and 2-propanol on the distribution
The extraction efficiency of POELE10-(NH4)2SO4 ATPS for TAP was up to 95.87%, and in order to increase the extraction efficiency of TAP, ethanol,22 1-propanol23
and 2-propanol24 were added in the system to enhance the
transfering ability to top phase, which is learned from the successful experience of Pan and Cisneros.22 The effect of
added amount of ethanol, 1-propanol and 2-propanol on the extraction efficiency and enrichment factor at 298.15 K was studied, and the results are shown in Figure 8. It was found that the addition of ethanol had no effect on the extraction efficiency of TAP, and the extraction efficiency of TAP slightly increased as the 2-propanol was added, however,
Table 2. The effect of the amount of POELE10on extraction efficiency, enrichment factor and phase ratio of TAP
POELE10 / mL 15 °C 25 °C 35 °C
F E% R% F E% R% F E% R%
1.0 17.31 74.85 3.08 23.46 81.32 3.13 24.82 85.58 3.20
1.2 16.25 76.69 3.58 22.48 83.12 3.63 23.35 86.36 3.71
1.4 15.03 78.25 4.35 20.25 84.63 4.40 22.14 88.85 4.48
1.6 14.30 79.08 5.45 18.21 85.42 5.49 21.11 89.63 5.57
1.8 13.88 80.83 6.21 16.07 87.12 6.25 18.98 91.31 6.32
2.0 12.29 82.21 6.77 14.47 88.47 6.82 17.40 92.65 6.91
2.2 10.18 82.73 7.26 12.35 88.95 7.30 15.28 93.10 7.38
2.4 8.55 83.08 7.73 10.72 89.26 7.78 13.65 94.40 7.84
2.6 7.81 85.54 8.94 9.46 91.19 8.99 12.41 95.33 9.07
2.8 7.31 86.17 9.31 8.46 91.20 9.34 10.41 96.32 9.41
15 20 25 30 35
0 20 40 60 80 100
Concentration of NH( 4 2)SO / (g mL )4 -1
0.155 g mL-1 0.145 g mL-1 0.135 g mL-1
Extraction effciency (E%)
T
e
m
p
e
ra
tu
re
/
°C
Figure 6. The changes of the extraction efficiency of TAP with the
temperature.
Concentration of NH( 4 2)SO / (g mL )4 -1 15
20 25 30 35
0 2 4 6 8 10 12 14 16 18 20
0.155 g mL-1
0.145 g mL-1
0.135 g mL-1
Enrichment factor (F)
T
e
m
p
e
ra
tu
re
/
°C
Figure 7. The changes of the enrichment factor of TAP with the
temperature.
15 20 25 30 35
0 20 40 60 80 100
Concentration of NH( 4 2)SO / (g mL )4 -1
0.155 g mL-1 0.145 g mL-1 0.135 g mL-1 Extraction effciency (E%)
T
e
m
p
e
ra
tu
re
/
°C
Concentration of NH( 4 2)SO / (g mL )4 -1 15
20 25 30 35
0 2 4 6 8 10 12 14 16 18 20
0.155 g mL-1
0.145 g mL-1
0.135 g mL-1
Enrichment factor (F)
T
e
m
p
e
ra
tu
re
/
the extraction efficiency of TAP significantly increased as the 1-propanol was added. This may be because the TAP would mix more easily with 1-propanol, and meanwhile, ethanol, 1-propanol and 2-propanol are much likely to come into top phase due to salting-out effect. Therefore, the extraction efficiency of TAP rised with the increase in added amout of 1-propanol.
Then the enrichment factor of TAP decreased as ethanol or 2-propanol was added, because the addition of ethanol and 2-propanol has nothing to promote TAP into top phase. However, the volume of top phase increases, and the enrichment factor of TAP decreases. The enrichment factor of TAP first increased and then decreased along with the increasing amount of added 1-propanol. The reason may be that the concentration of TAP in top phase rised with the increase in the added amount of 1-propanol at first, and when most of TAP have been in top phase and the concentration of TAP in top phase decreased with the increase in the added amount of 1-propanol. Therefore, it was concluded that adding suitable amount of 1-propanol can improve the extraction efficiency and enrichment factor of TAP.
The multi-factor experiment by using RSM
Factors affecting enrichment of TAP
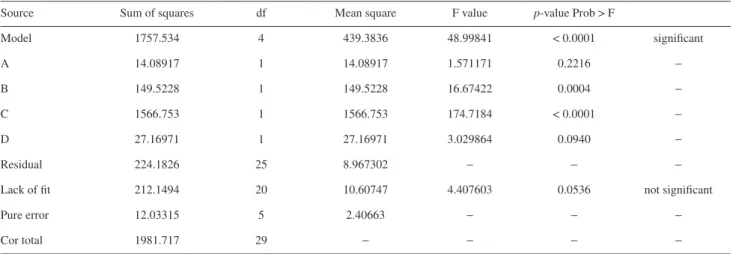
The specific design for the multi-factor experiment by using CCD with four factors at five levels and the experimental results are given in Table 3. In order to test the statistical analysis of the extraction efficiency and enrichment factor by using RSM, the Fisher’s F-test was used for the analysis of variance and the results are given in Tables 4 and 5. The probability equals to the proportion
of the area under the curve of the F-distribution that lies beyond the observed F-value was expressed as the “Prob > F” value. The small probability values called for the rejection of the null hypothesis, in other words, the particular term was statistically significant.25 The value of
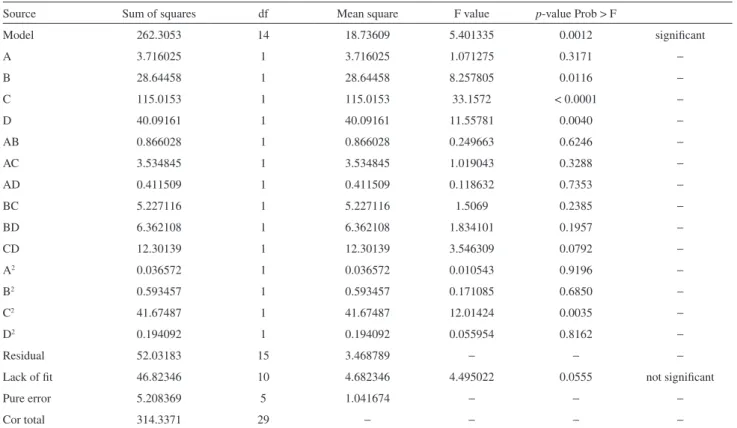
“Prob > F” is less than 0.05 and it indicates that the model terms are significant, and the value is greater than 0.1, that indicates the model terms are not significant. In this work, the factors B, C, D have an important effect on extraction efficiency of TAP as shown in Table 3. On the other hand, the factors B, C, D as well as the interaction of factors CD, and C2 were significant in affecting enrichment factor of
TAP according to the data in Table 4.
Regression analysis
The response function (equation 4) was fit by the equation regression analysis to predict the outcome of enrichment of TAP. The multiple regression analysis was performed according to the experimental data of extraction efficiency of TAP (Table 3), and the coefficients of the model were evaluated for the significance. The equation for predicting the extraction efficiency of TAP was obtained, and it is given as follows:
D C
B A
E X X X X
Y 89.42 0.77 2.50 8.08 1.06
%= + + + + (5)
For the enrichment factor of TAP, the final predictive equation was also obtained according to the experimental data of enrichment factor of TAP in Table 3.
29 . 1 19 . 2 09 . 1 39 . 0 45 . 21 D C B A
F X X X X
Y 2 68 . 0 D X + 2 23 . 1 C X − 2 15 . 0 B X + 2 037 . 0 A X − 88 . 0 D cX X − 63 . 0 D BX X + 57 . 0 C BX X + 16 . 0 D AX X + 47 . 0 C AX X − 23 . 0 B AX X − + − − + = (6)
In the above mentioned two equations, YE% represents
the extraction efficiency of TAP, YF represents the enrichment factor of TAP, and XA, XB, XC, XD are four
factors. The proportion of total variation attributed to each fit can be evaluated by the value of R-square. The R-square value was 0.9869 for the extraction efficiency of
TAP, which indicated that the fitting between the model and the experimental results were good. However, for the enrichment factor of TAP, lower R-square value of 0.9345
was obtained.
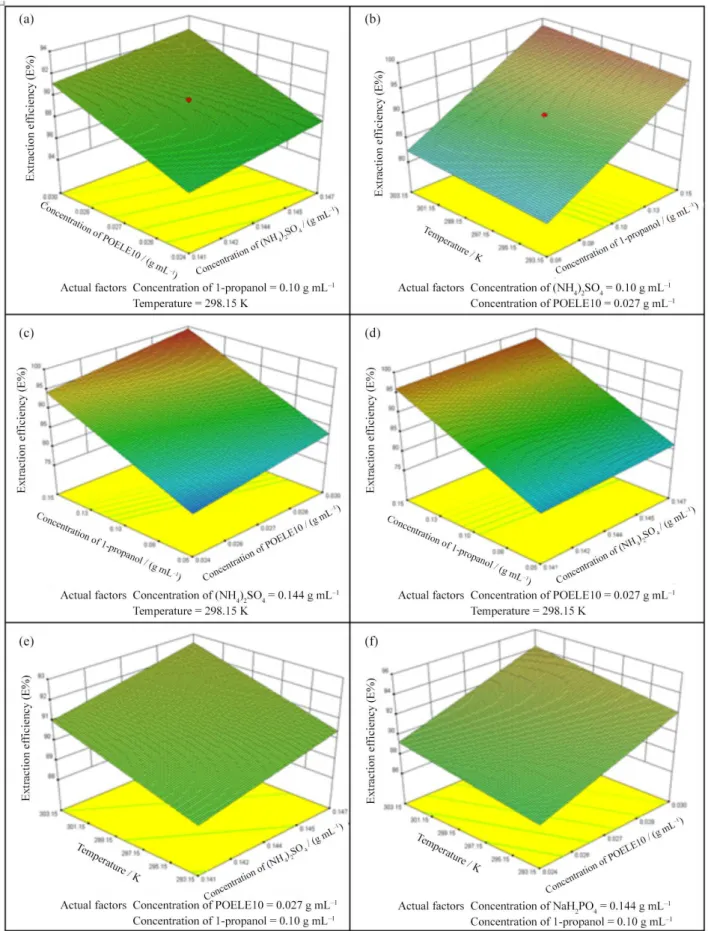
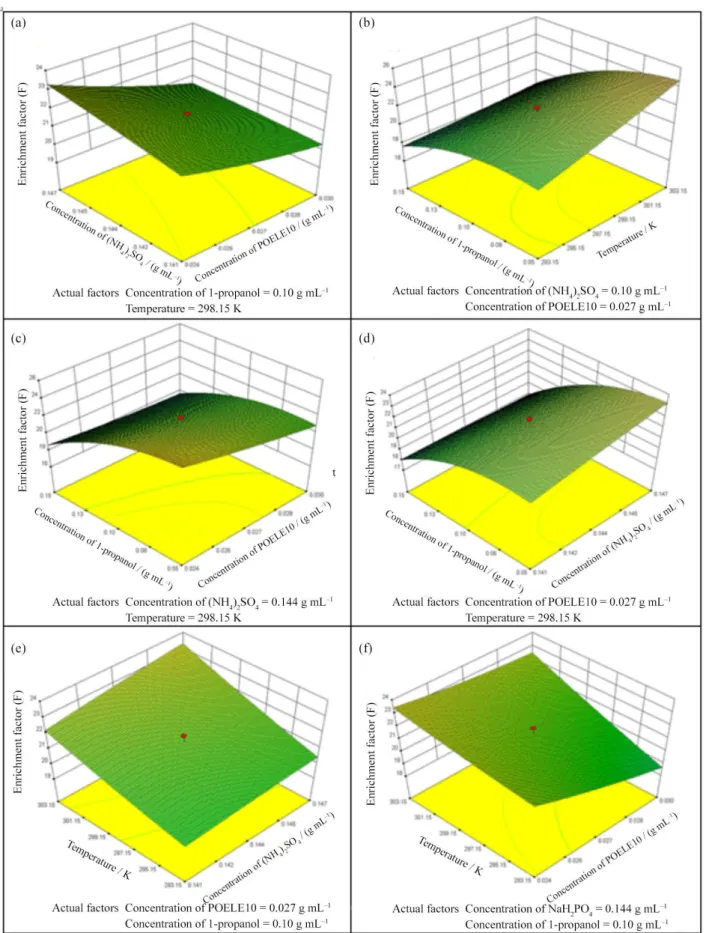
Response surface plot
The factors influencing the extraction efficiency of TAP and enrichment factor of TAP were shown as the response surface plots in Figures 9 and 10. The relationship -0.05 0.00 0.05 0.10 0.15
50 60 70 80 90 100 110 ethanol: 2-propanol:
1-propanol: Extraction effciency (E%) Extraction effciency (E%) Extraction effciency (E%)
Extraction ef
fciency (E%)
Concentration of alcohol
0,20 0,25 0,30 0,35 0,40
Enrichment factor (F
)
(g mL-1 ) 0 5 10 15 20 25 30
Enrichment factor (F) Enrichment factor (F) Enrichment factor (F)
Figure 8. The changes of the extraction efficiency and enrichment factor
of TAP with the concentration of ethanol, 1-propanol and 2-propanol. -0.05 0.00 0.05 0.10 0.15
50 60 70 80 90 100 110 ethanol: 2-propanol:
1-propanol: Extraction effciency (E%) Extraction effciency (E%) Extraction effciency (E%)
Extraction ef
fciency (E%)
Concentration of alcohol
0,20 0,25 0,30 0,35 0,40
Enrichment factor (F
)
(g mL-1
) 0 5 10 15 20 25 30
Table 3. The extraction efficiency and enrichment factor in the upper phase for each experiment of the CCD
Run
A B C D Y1 Y2
(NH4)2SO4 /
(g mL−1)
POELE10 / (g mL−1)
1-propanol /
(g mL−1) Temperature / K
Extraction efficiency (E%)
Enrichment factor (F)
1 0.147 0.03 0.15 303.15 99.50 17.82
2 0.144 0.027 0.1 298.15 89.66 21.87
3 0.144 0.027 0.1 308.15 93.41 26.70
4 0.147 0.03 0.05 303.15 85.59 23.13
5 0.141 0.03 0.15 303.15 99.59 18.20
6 0.147 0.03 0.05 293.15 82.45 17.58
7 0.141 0.024 0.05 293.15 75.50 21.60
8 0.141 0.024 0.15 293.15 97.56 18.20
9 0.144 0.033 0.1 298.15 98.19 20.22
10 0.141 0.03 0.15 293.15 99.26 16.51
11 0.141 0.024 0.05 303.15 75.40 21.55
12 0.144 0.027 0.1 288.15 85.02 20.01
13 0.147 0.024 0.05 303.15 76.72 26.70
14 0.141 0.03 0.05 293.15 78.24 17.30
15 0.147 0.024 0.05 293.15 76.62 22.20
16 0.147 0.024 0.15 303.15 96.21 17.05
17 0.147 0.024 0.15 293.15 98.84 17.80
18 0.144 0.027 0.2 298.15 99.46 13.03
19 0.141 0.03 0.05 303.15 85.59 23.13
20 0.144 0.027 0.1 298.15 85.86 19.37
21 0.144 0.027 0 298.15 78.39 23.14
22 0.15 0.027 0.1 298.15 95.23 24.09
23 0.141 0.024 0.15 303.15 97.78 18.26
24 0.138 0.027 0.1 298.15 89.13 21.65
25 0.147 0.03 0.15 293.15 99.16 17.02
26 0.144 0.021 0.1 298.15 85.61 26.99
Table 4. Results of the analysis of variance (ANOVA) performed to the extraction efficiency models
Source Sum of squares df Mean square F value p-value Prob > F
Model 1757.534 4 439.3836 48.99841 < 0.0001 significant
A 14.08917 1 14.08917 1.571171 0.2216 −
B 149.5228 1 149.5228 16.67422 0.0004 −
C 1566.753 1 1566.753 174.7184 < 0.0001 −
D 27.16971 1 27.16971 3.029864 0.0940 −
Residual 224.1826 25 8.967302 − − −
Lack of fit 212.1494 20 10.60747 4.407603 0.0536 not significant
Pure error 12.03315 5 2.40663 − − −
between response (E% and F) and experimental levels of each variables was visualized in the 3D response surface plot, which, meanwhile, provides a method to directly observe the interactions between two test variables.26 The
interactions between variables and their optimum ranges can be well observed by studying the response surface plots. The analysis of Figures 9 and 10 and Table 3 shows that the optimal value of extraction efficiency of TAP (E%) was 99.59%, and it occurred when the concentration
of (NH4)2SO4, the concentration of POELE10, the
concentration of 1-propanol and temperature were 0.141 g mL−1, 0.030 g mL−1, 0.15 g mL−1 and 303.15 K, respectively. The optimized condition for the enrichment factor of TAP (F) was 26.99 under the following conditions: the concentration of (NH4)2SO4 was 0.144 g mL−1;
the concentration of POELE10 was 0.021 g mL−1;
the concentration of 1-propano was 0.10 g mL−1 and
temperature was 298.15 K.
Samples analysis
This POELE10-(NH4)2SO4 aqueous two-phase
extraction technique was applied to separate and enrich TAP in egg, milk and honey under the optimal conditions as previously discussed in this paper. After POELE10-(NH4)2SO4 ATPS separation procedures, TAP in real samples was separated to top phase, and then it
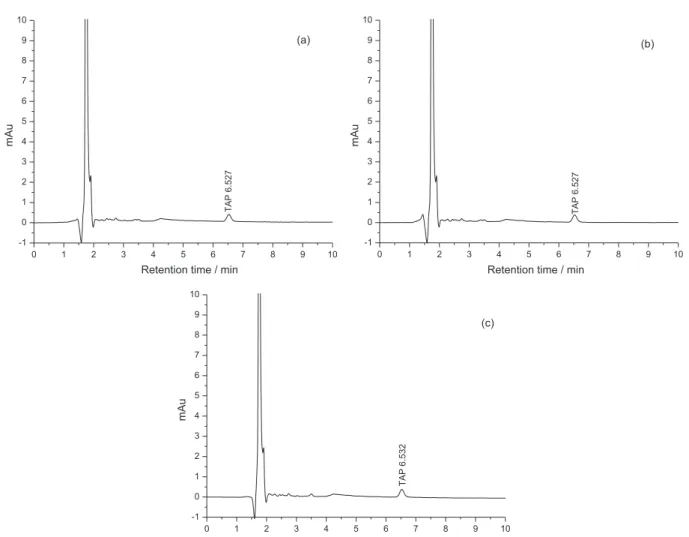
was determined by HPLC-UV method mentioned above. In the linear range of 0.5-3 µg mL−1, TAP in real samples was analyzed by using this extraction method. The limit of detection (LOD) and the limit of quantification (LOQ) are 0.5 µg mL−1 and 1.5 µg mL−1 with the standard deviation of 0.9984 and 0.9991. The extraction efficiency of TAP and HPLC spectrogram is shown in Table 6 and Figure 11. It was found that the recovery of TAP was 96.80-99.89% with a RSD of 0.46-2.47% when the concentration of the added TAP was 10-100 ng mL−1 as shown in Table 6. All this illustrated that this extraction technique has a satisfactory recovery and reproducibility for the determination of the TAP in a wide range of concentrations. Thus, this method can be applied to the quantitative analysis of residual trace TAP in the food and environment.
Conclusions
In this paper, the POELE10-(NH4)2SO4 ATPS was applied to separate and purify trace of TAP in food. The RSM was used to design multi-factor experiment in order to determine the optimized conditions for the extraction efficiency of TAP (E%) and enrichment factor of TAP (F). Under the optimized conditions, the trace TAP in egg, milk and honey was successfully quantitatively determined by this preprocessing method with HPLC. The LOD and LOQ
Table 5. Results of the analysis of variance (ANOVA) performed to the enrichment factor models
Source Sum of squares df Mean square F value p-value Prob > F
Model 262.3053 14 18.73609 5.401335 0.0012 significant
A 3.716025 1 3.716025 1.071275 0.3171 −
B 28.64458 1 28.64458 8.257805 0.0116 −
C 115.0153 1 115.0153 33.1572 < 0.0001 −
D 40.09161 1 40.09161 11.55781 0.0040 −
AB 0.866028 1 0.866028 0.249663 0.6246 −
AC 3.534845 1 3.534845 1.019043 0.3288 −
AD 0.411509 1 0.411509 0.118632 0.7353 −
BC 5.227116 1 5.227116 1.5069 0.2385 −
BD 6.362108 1 6.362108 1.834101 0.1957 −
CD 12.30139 1 12.30139 3.546309 0.0792 −
A2 0.036572 1 0.036572 0.010543 0.9196
−
B2 0.593457 1 0.593457 0.171085 0.6850
−
C2 41.67487 1 41.67487 12.01424 0.0035
−
D2 0.194092 1 0.194092 0.055954 0.8162
−
Residual 52.03183 15 3.468789 − − −
Lack of fit 46.82346 10 4.682346 4.495022 0.0555 not significant
Pure error 5.208369 5 1.041674 − − −
Figure 9. The 3D response surface plot for the interactive effect of (a) concentration of (NH4)2SO4 and concentration of POELE10; (b) temperature
and concentration of 1-propanol; (c) concentration of 1-propanol and concentration of POELE10; (d) concentration of 1-propanol and concentration of (NH4)2SO4; (e) temperature and concentration of (NH4)2SO4; and (f) temperature and concentration of POELE10 on the extraction efficiency of TAP, while
Figure 10. The 3D response surface plot for the interactive effect of (a) concentration of (NH4)2SO4 and concentration of POELE10; (b) temperature
and concentration of 1-propanol; (c) concentration of 1-propanol and concentration of POELE10; (d) concentration of 1-propanol and concentration of (NH4)2SO4; (e) temperature and concentration of (NH4)2SO4; and (f) temperature and concentration of POELE10 on the enrichment factor of TAP, while
Table 6. Analysis results (mean ± SD, n = 5) for TAP in real samples
Sample Added TAP / (ng mL−1) Determined TAP / (ng mL−1) Extraction efficiency (E%) RSD
Egg 0 ND − −
10 9.94 ± 0.21 99.40 ± 2.07 2.09
25 24.86 ± 0.11 99.44 ± 0.45 0.46
50 49.94 ± 0.42 99.89 ± 0.85 0.85
100 99.78 ± 1.16 99.79 ± 1.16 1.16
Milk 0 ND − −
10 9.68 ± 0.24 96.80 ± 2.39 2.47
25 24.64 ± 0.42 98.56 ± 1.66 1.69
50 49.80 ± 0.66 99.60 ± 1.31 1.32
100 99.14 ± 1.16 99.14 ± 1.16 1.17
Honey 0 ND − −
10 9.82 ± 0.15 98.20 ± 1.48 1.51
25 24.84 ± 0.11 99.36 ± 0.46 0.46
50 49.76 ± 0.74 99.52 ± 1.49 1.49
100 99.64 ± 0.87 99.64 ± 0.87 0.87
ND: not found.
0 1 2 3 4 5 6 7 8 9 10
-1 0 1 2 3 4 5 6 7 8 9 10
T
A
P
6
.5
2
7
Retention time / min
mAu
(a)
0 1 2 3 4 5 6 7 8 9 10
-1 0 1 2 3 4 5 6 7 8 9 10
T
A
P
6
.5
2
7
Retention time / min
mAu
(b)
0 1 2 3 4 5 6 7 8 9 10
-1 0 1 2 3 4 5 6 7 8 9 10
T
A
P
6
.5
3
2
Retention time / min
mAu
(c)
Figure 11. HPLC chromatograms with UV detection of real sample added with 10 ng mL−1 TAP after ATPS extraction. Real samples: (a) egg; (b) milk
of TAP are 0.5 µg mL−1 and 1.5 µg mL−1, and it coincides with the requirement of detecting the trace TAP in food.27
It also gives us an enlightenment for the future research on whether the POELE10-(NH4)2SO4 ATPE is more applicable to the extraction of trace TAP in environment samples.
Acknowledgements
This work was supported by the National Natural Science Foundation of China (No. 31470434, 21406090, 21206059, 21407058 and 61402204), the Natural Science Foundation of Jiangsu Province (No. BK20141289 and BK20131258), China Postdoctoral Science Foundation funded project (No. 2013M531284), the Natural Science Foundation of Jilin Province (No. 20150520062JH, 20140101206JC and 20130101179JC) and Science and Technology Research Foundation of Jilin Province Department of Education (No. 2014_158).
References
1. Suter, C. M.; Schalit, S.; Cutler, R. A.; J. Am. Chem. Soc.1953,
75, 4330.
2. Chen, H. X.; Chen, H.; Ying, J.; Huang, J. L.; Liao, L.; Anal. Chim. Acta2009, 632, 80.
3. Turton, J. A.; Andrews, C. M.; Havard, A. C.; Robinson, S.; York, M.; Williams, T. C.; Gibson, F. M.; Food Chem. Toxicol.
2002, 40, 1849.
4. Xie, K. Z.; Jia, L. F.; Yao, Y. L.; Xu, D.; Chen, S. Q.; Xie, X.; Pei, Y.; Bao, W. B.; Dai, G. J.; Wang, J. Y.; Liu, Z. P.;
J. Chromatogr. B: Anal. Technol. Biomed. Life Sci. 2011, 879, 2351.
5. Posyniak, A.; Zmudzki, J.; Niedzielska, J.; Anal. Chim. Acta2003,
483, 307; Giorgi, M.; Romani, M.; Bagliacca, M.; Mengozzi, G.; J. Vet. Pharmacol. Ther.2000, 23, 397; Vue, C.; Schmidt, L. J.; Stehly, G. R.; Gingerich, W. H.; J. Chromatogr. B: Anal. Technol. Biomed. Life Sci. 2002, 780, 111; Wrzesinski, C. L.; Crouch, L. S.; Endris, R.; J. AOAC Int.2003, 86, 515.
6. Pfenning, A. P.; Roybal, J. E.; Rupp, H.; Turnipseed, S. B.; Gonzales, S. A.; Hurlbut, J. A.; J. AOAC Int.2000, 83, 26;
Zhang, S. X.; Sun, F. Y.; Li, J. C.; Cheng, L. L.; Shen, J. Z.;
J. AOAC Int. 2006, 89, 1437.
7. Riet, J. M.; Potter, R. A.; Christie-Fougere, M.; Burns, B. G.;
J. AOAC Int.2003, 86, 510.
8. Bogusz, M. J.; Hassan, H.; Al-Enazi, E.; Ibrahim, Z.; Al-Tufail, M.; J. Chromatogr. B: Anal. Technol. Biomed. Life Sci. 2004, 807, 343; Forti, A. F.; Campana, G.; Simonella, A.; Multari, M.; Scortichini, G.; Anal. Chim. Acta2005, 529, 257;
Zhang, S. X.; Liu, Z. W.; Guo, X.; Cheng, L. L.; Wang, Z. H.; Shen, J. Z.; J. Chromatogr. B: Anal. Technol. Biomed. Life Sci.
2008, 875, 399.
9. Nagata, T.; Oka, H.; J. Agric. Food Chem.1996, 44, 1280; Li, P.; Qiu, Y. M.; Cai, H. X.; Kong, Y.; Tang, Y. Z.; Wang, D. N.; Xie, M. X.; Chin. J. Chromatogr.2006, 24, 14.
10. Albertsson, P. Â.; Partition of Cell Particles and Macromolecules,
3rd ed.; Wiley-Inter Science: New York, 1986; Zaslavsky, B. Y.;
Aqueous Two-Phase Partitioning; Matcel Dekker: New York,
1995; Tan, Z. J.; Song, S.; Han, J.; J. Iran. Chem. Soc. 2013, 10, 505; Kula, M. R.; Applied Biochemistry and Bioengineering,
Vol. 2; Enzyme Technology: New York, 1979.
11. Luechau, F.; Ling, T. C.; Lyddiatt, A.; Sep. Purif. Technol.2009,
66, 202.
12. Rawdkuen, S.; Pintathong, P.; Chaiwut, P.; Benjakul, S.; Food Bioprod. Process.2011, 89, 73; Ooi, C. W.; Hii, S. L.; Kamal, S. M. M.; Ariff, A.; Ling, T. C.; Process Biochem.2011,
46, 68; Yücekan, İ.; Önal, S.; Process Biochem.2011, 46, 226.
13. Luechau, F.; Ling, T. C.; Lyddiatt, A.; Food Bioprod. Process.
2011, 89, 322.
14. Li, C. X.; Han, J.; Wang, Y.; Anal. Chim. Acta 2009, 653, 178; Bi, P. Y.; Li, D. Q.; Dong, H. R.; Sep. Purif. Technol.2009, 69,
205; Xie, X. Q.; Wang, Y.; Han, J.; Yan, Y. S.; Anal. Chim. Acta
2011, 687, 61.
15. Silva, C. A. S.; Coimbra, J. S. R.; Rojas, E. E. G.; Teixeira, J. A. C.; Process Biochem. 2009, 44, 1213; Azevedo, A. M.;
Gomes, A. G.; Rosa, P. A. J.; Ferreira, I. F.; Pisco, A. M. M .O.; Aires-Barros, M. R.; Sep. Purif. Technol.2009, 65, 14; Gomes,
G. A.; Azevedo, A. M.; Aires-Barros, M. R.; Prazeres, D. M. F.;
Sep. Purif. Technol.2009, 65, 22.
16. Li, Y. J.; Cao, X. J.; Fluid Phase Equilib.2010, 298, 206. 17. Zafarani-Moattar, M. T.; Hosseinpour-Hashemi, V.; J. Chem.
Eng. Data2012, 57, 532.
18. Han, J.; Wang, Y.; Yu, C. L.; Li, Y. Y.; Kang, W. B.; Yan, Y. S.;
J. Chem. Thermodyn. 2012, 45, 59.
19. Lu, Y.; Hao, T. F.; Hu, S. P.; Han, J.; Tan, Z. J.; Yan, Y. S.;
Thermochim. Acta2013, 568, 209; Zafarani-Moattar, M. T.; Nemati-Kande, E.; Soleimani, A.; Fluid Phase Equilib.2012,
313, 107.
20. Han, J.; Sheng, C. Z.; Yu, P.; Tan, Z. J.; Yan, Y. S.; Thermochim. Acta2012, 543, 1.
21. Lu, Y.; Han, J.; Tan, Z. J.; Yan, Y. S.; J. Chem. Eng. Data2012,
57, 2313; Lu, Y.; Lu, Y.; Hao, T. F.; Zhou, Y.; Han, J.; Tan, Z. J.; Yan, Y. S.; J. Chem. Thermodyn. 2014, 71, 137; Lu, Y.; Hao,
T. F.; Yan, M.; Han, J.; Tan, Z. J.; Yan, Y. S.; J. Chem. Eng. Data
2014, 59, 1843; Lu, Y.; Han, J.; Tan, Z. J.; Yan, Y. S.; J. Chem. Eng. Data2013, 58, 118.
22. Pan, I. H.; Chiu, H. H.; Lu, C. H.; J. Chromatogr. A2002, 977,
239; Cisneros, M.; Benavides, J.; Brenes, C. H.; J. Chromatogr. B: Anal. Technol. Biomed. Life Sci. 2004, 807, 105.
23. Guan, W. X.; Li, W. J.; Han, J.; J. Instrum. Anal. 2012, 31, 600. 24. Zhang, Z. J.; Lu, C. Y.; Huang, W.; Li, W. J.; Zhou, Y.; Appl.
25. Ahmad, A. L.; Derek, C. J. C.; Zulkali, M. M. D.; Sep. Purif. Technol.2008, 62, 702.
26. Qiao, D. L.; Hu, B.; Gan, D.; Sun, Y.; Ye, H.; Zeng, X. X.;
Carbohydr. Polym. 2009, 76, 422.
27. The Commission of the European Communities; Commission Regulation (EU) No 37/2010, Official Journal of the European Union, 2009, L15, 1.