ACPD
11, 21489–21532, 2011Aqueous phase processing of secondary organic
aerosols
Y. Liu et al.
Title Page
Abstract Introduction
Conclusions References
Tables Figures
◭ ◮
◭ ◮
Back Close
Full Screen / Esc
Printer-friendly Version Interactive Discussion
Discussion
P
a
per
|
Dis
cussion
P
a
per
|
Discussion
P
a
per
|
Discussio
n
P
a
per
|
Atmos. Chem. Phys. Discuss., 11, 21489–21532, 2011 www.atmos-chem-phys-discuss.net/11/21489/2011/ doi:10.5194/acpd-11-21489-2011
© Author(s) 2011. CC Attribution 3.0 License.
Atmospheric Chemistry and Physics Discussions
This discussion paper is/has been under review for the journal Atmospheric Chemistry and Physics (ACP). Please refer to the corresponding final paper in ACP if available.
Aqueous phase processing of secondary
organic aerosols
Yao Liu1, T. Tritscher2, A. P. Praplan2, P. F. DeCarlo2,*, B. Temime-Roussel1,
E. Quivet1, N. Marchand1, J. Dommen2, U. Baltensperger2, and A. Monod1
1
Universit ´e Aix-Marseille I, II et III, Case 29, UMR6264, CNRS – Laboratoire Chimie Provence, 3 place Victor Hugo, 13331 Marseille Cedex 3, France
2
Paul Scherrer Institut (PSI), Laboratory of Atmospheric Chemistry, 5232 Villigen, Switzerland
*
now at: AAAS Science and Technology Policy Fellow Hosted at the US EPA, Washington, DC, USA
Received: 22 July 2011 – Accepted: 25 July 2011 – Published: 28 July 2011
Correspondence to: A. Monod ([email protected])
ACPD
11, 21489–21532, 2011Aqueous phase processing of secondary organic
aerosols
Y. Liu et al.
Title Page
Abstract Introduction
Conclusions References
Tables Figures
◭ ◮
◭ ◮
Back Close
Full Screen / Esc
Printer-friendly Version Interactive Discussion
Discussion
P
a
per
|
Dis
cussion
P
a
per
|
Discussion
P
a
per
|
Discussio
n
P
a
per
|
Abstract
The aging of secondary organic aerosol (SOA) by photooxidation in the aqueous phase was experimentally investigated. To simulate multiphase processes, the following ex-periments were sequentially performed in a smog chamber and in an aqueous phase photoreactor: (1) Gas-phase photooxidation of three different volatile organic
com-5
pounds (VOC): isoprene,α-pinene, and 1,3,5-trimethylbenzene (TMB) in the presence of NOx, leading to the formation of SOA which was subjected to on-line physical and chemical analysis; (2) particle-to-liquid transfer of water soluble species of SOA us-ing filter samplus-ing and aqueous extraction; (3) aqueous-phase photooxidation of the obtained water extracts; and (4) nebulization of the solutions for a repetition of the
10
on-line characterization. SOA concentrations in the chamber measured with a scan-ning mobility particle sizer (SMPS) were higher than 200 µg m−3, as the experiments were conducted under high initial concentrations of volatile organic compounds (VOC) and NOx. The aging of SOA through aqueous phase processing was investigated by measuring the physical and chemical properties of the particles online before and after
15
processing using a high resolution time-of-flight aerosol mass spectrometer (AMS) and a hygroscopicity tandem differential mobility analyzer (H-TDMA). It was shown that, af-ter aqueous phase processing, the particles were significantly more hygroscopic, and contained more fragmentation ions atm/z=44 and less ions atm/z=43, thus show-ing a significant impact on SOA agshow-ing for the three different precursors. Additionally,
20
the particles were analyzed with a thermal desorption atmospheric pressure ioniza-tion aerosol mass spectrometer (TD-API-AMS). Comparing the smog chamber SOA composition and non processed nebulized aqueous extracts with this technique re-vealed that sampling, extraction and/or nebulization did not significantly impact the chemical composition of SOA formed from isoprene andα-pinene, whereas it affected
25
ACPD
11, 21489–21532, 2011Aqueous phase processing of secondary organic
aerosols
Y. Liu et al.
Title Page
Abstract Introduction
Conclusions References
Tables Figures
◭ ◮
◭ ◮
Back Close
Full Screen / Esc
Printer-friendly Version Interactive Discussion
Discussion
P
a
per
|
Dis
cussion
P
a
per
|
Discussion
P
a
per
|
Discussio
n
P
a
per
|
chemical ionization mass spectrometer (APCI-MS) equipped with high pressure liquid chromatography (HPLC-MS). These analyses showed that aqueous phase processing enhanced the formation of some compounds already present in the SOA, thus confirm-ing the agconfirm-ing effect of aqueous phase processes. For isoprene experiments, additional new compounds, likely oligomers, were formed through aqueous phase
photooxida-5
tion, and their possible origins are discussed.
1 Introduction
Secondary organic aerosol (SOA), formed by the chemical transformation of atmo-spheric organic compounds, accounts for a large, and often a dominant fraction of total organic aerosol (Hallquist et al., 2009). More than 50 % of the total organic aerosol
10
mass can be attributed to SOA (Zhang et al., 2005; Lanz et al., 2007; Jimenez et al., 2009). Detailed knowledge of the formation, characterization, and fate of SOA is re-quired to evaluate its impact on atmospheric processes, climate and human health. The chemical characterization of SOA shows the presence of oxygenated and water soluble organic compounds such as carbonyl species, acids, esters, alcohols as well
15
as polymers or oligomers (Tolocka et al., 2004; Kalberer et al., 2004; Kourtchev et al., 2005; Edney et al., 2005; Baltensperger et al., 2005; Dommen et al., 2006; Surratt et al., 2006; M ¨uller et al., 2008; Healy et al., 2008; Hallquist et al., 2009). The atmo-spheric oxidation of these organic particles affects the physical and chemical properties of aerosols through a process known as aging. The most recent studies on aging of
or-20
ganic aerosol have focused on heterogeneous reactions, condensation, volatilization, as well as changes in hygroscopicity, O:C ratio (oxygen to carbon molar ratio), and density (Rudich et al., 2007; Kroll et al., 2008; Jimenez et al., 2009; Tritscher et al., 2011).
A fraction of the numerous organic compounds encountered in atmospheric water
25
ACPD
11, 21489–21532, 2011Aqueous phase processing of secondary organic
aerosols
Y. Liu et al.
Title Page
Abstract Introduction
Conclusions References
Tables Figures
◭ ◮
◭ ◮
Back Close
Full Screen / Esc
Printer-friendly Version Interactive Discussion
Discussion
P
a
per
|
Dis
cussion
P
a
per
|
Discussion
P
a
per
|
Discussio
n
P
a
per
|
present in the initial condensation nuclei (van Pinxteren et al., 2005; Hallquist et al., 2009). Clouds continuously appear and disappear through evapo-condensation cy-cles, thus inducing continuous re-partitioning of organic compounds between the gas, aqueous, and particle phases. It is known that the reactivity of organic compounds can be very different in the aqueous phase compared to the gas phase (Altieri et al.,
5
2006, 2008; Carlton et al., 2007; Liu et al., 2009; El Haddad et al., 2009; Poulain et al., 2010; Sun et al., 2010). Therefore, it is possible that the aging of SOA through evapo-condensation cycles of clouds results in very different physical and chemical composition than the aging in the gas phase alone. A number of recent studies have focused on the ability of aqueous phase reactivity of some single organic compounds
10
with OH radical to form oligomers, and potentially new SOA (Altieri et al., 2006, 2008; Carlton et al., 2006, 2007; Perri et al., 2009; El Haddad et al., 2009; Tan et al., 2009, 2010; Zhang et al., 2010; Liu et al., 2011). However, the effects of aqueous phase pho-tooxidation of a complex mixture of organic compounds, such as those encountered in SOA, have only very recently been experimentally investigated by a few authors (Lee
15
et al., 2011; Bateman et al., 2011) who have shown that this type of approach reveals a number of new aspects of SOA aging, that can be more atmospherically representative than the classical dry heterogeneous reactivity.
The aim of this study was to investigate the aging of different types of SOA by pho-tooxidation in the aqueous phase. In order to control the origin of the SOA, we
pro-20
duced SOA through smog chamber photochemical experiments from three different precursors: isoprene,α-pinene and 1,3,5-trimethylbenzene (TMB).
2 Experimental section
2.1 General overview
The aging of SOA during evapo-condensation cycles of a cloud was investigated
un-25
ACPD
11, 21489–21532, 2011Aqueous phase processing of secondary organic
aerosols
Y. Liu et al.
Title Page
Abstract Introduction
Conclusions References
Tables Figures
◭ ◮
◭ ◮
Back Close
Full Screen / Esc
Printer-friendly Version Interactive Discussion
Discussion
P
a
per
|
Dis
cussion
P
a
per
|
Discussion
P
a
per
|
Discussio
n
P
a
per
|
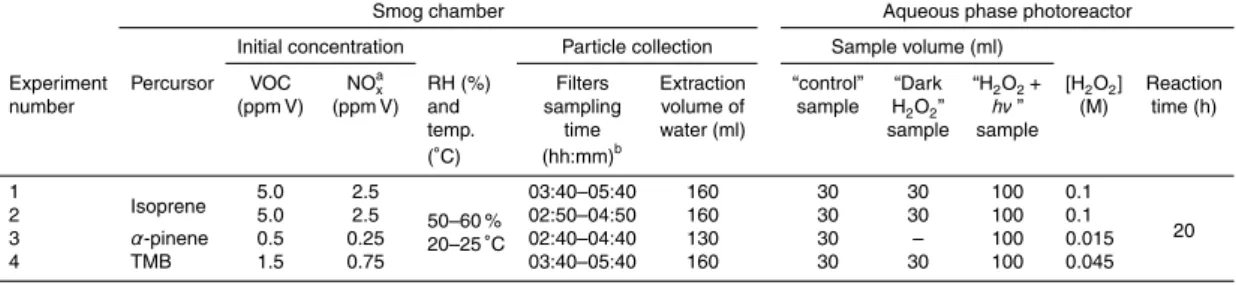
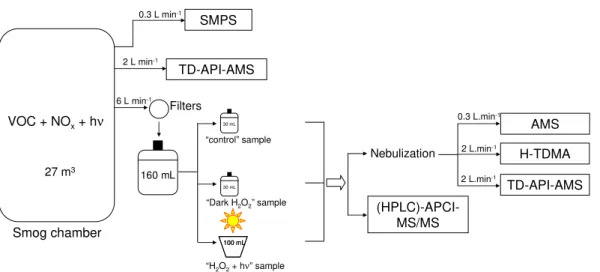
Figure 1 illustrates the experimental set-up. SOA formed by the gas-phase photooxi-dation of isoprene,α-pinene or TMB was generated in the smog chamber, under the conditions presented in Table 1. In order to obtain large quantities of SOA, high initial concentrations of VOCs and NOxwere used at room temperature and a relative humid-ity of about 50 %. The formed particles were collected on filters at 6 l min−1during 2 h,
5
and extracted by sonication of the filters in ultra-high quality (UHQ) water (Millipore). The extracted solution was then separated into three samples (Fig. 1): (i) “H2O2+hν”
sample: 100 ml of the solution was placed in an aqueous phase photoreactor to un-dergo photooxidation with OH radicals during 20 hours. OH radicals were generated in situ by the photolysis of hydrogen peroxide (H2O2), which was added to the solu-10
tion prior to photolysis, in concentrations indicated in Table 1. (ii) “Dark H2O2” sample: H2O2was added to 30 ml of the extracted solution and kept in the dark, in order to
com-pare the effects of H2O2 with those of OH radicals. (iii) “control” sample: 30 ml of the
solution was left in the dark during the same time as the two other samples, in order to check for reactive changes of the untreated solution, compared to its reactivity towards
15
H2O2 and/or OH radicals. In order to simulate a cloud evaporation process, each of
the above mentioned solution was then nebulized with an atomizer. The aerosol before and after the cloud simulation processes was analyzed with a suite of instruments as specified below. Four experiments are presented here in Table 1: two experiments with isoprene, one withα-pinene and one with TMB. The instruments used for these
20
experiments are described hereafter.
2.2 Analysis
2.2.1 On-line aerosol characterization
The physical and chemical characterization of the SOA was performed online in the smog chamber and after their aqueous phase processing and subsequent nebulization
25
ACPD
11, 21489–21532, 2011Aqueous phase processing of secondary organic
aerosols
Y. Liu et al.
Title Page
Abstract Introduction
Conclusions References
Tables Figures
◭ ◮
◭ ◮
Back Close
Full Screen / Esc
Printer-friendly Version Interactive Discussion
Discussion
P
a
per
|
Dis
cussion
P
a
per
|
Discussion
P
a
per
|
Discussio
n
P
a
per
|
SMPS: scanning mobility particle sizer
A condensation particle counter (CPC, TSI 3025A) monitored the evolution of the total aerosol particle number concentration. The number size distribution was measured with a scanning mobility particle sizer (SMPS) consisting of a differential mobility ana-lyzer (DMA, TSI 3071) and a CPC (TSI 3022A).
5
H-TDMA: hygroscopicity tandem differential mobility analyzer
The custom built H-TDMA selects a dry, narrow size fraction of the aerosol (DMA1), humidifies it at high relative humidity (RH 90 %) and scans the conditioned aerosol with a second DMA (DMA2) and a CPC (TSI 3022A). The used instrument is described in Tritscher et al. (2011). From the measured size distribution a hygroscopic growth
10
factor for a certain RH is calculated. The H-TDMA data were calibrated, analyzed and inverted with the TDMAinv procedure from Gysel et al. (2009). Measured dry particle diameters ranged from 35–150 nm during the nebulizer experiments. To exclude the Kelvin effect we present the data in the form of the hygroscopicity parameter kappa (κ) (Petters and Kreidenweis, 2007), assuming the surface tension of pure water.κranges
15
from 0 for insoluble, but wettable material to ca. 1.4 for very hygroscopic salts.
AMS
A high resolution time-of-flight aerosol mass spectrometer (DeCarlo et al., 2006) was used to measure online the bulk chemical composition of the non-refractory submicron particulate matter. Data was saved every two minutes during smog chamber
experi-20
ACPD
11, 21489–21532, 2011Aqueous phase processing of secondary organic
aerosols
Y. Liu et al.
Title Page
Abstract Introduction
Conclusions References
Tables Figures
◭ ◮
◭ ◮
Back Close
Full Screen / Esc
Printer-friendly Version Interactive Discussion
Discussion
P
a
per
|
Dis
cussion
P
a
per
|
Discussion
P
a
per
|
Discussio
n
P
a
per
|
TD-API-AMS: thermal desorption atmospheric pressure ionization aerosol mass spectrometer
Further on-line analysis of the chemical composition of SOA was performed using a modified version of a commercial (Varian 1200L) atmospheric pressure chemical ion-ization device, equipped with a triple quadrupole mass spectrometer (APCI-MS/MS).
5
The inlet of this instrument has been modified to transform it into an aerosol mass spec-trometer, named TD-API-AMS, as described and validated by Eyglunent et al. (2008). Briefly, the modified inlet consists of a charcoal denuder (to trap gas phase VOCs and semi-volatile organic compounds) followed by a modified thermal-desorption unit (held at 300◦C) attached to the APCI source. The aerosol was injected at a flow rate of
10
2 l min−1. In order to optimize the ionization, liquid methanol (10 µl min−1) was contin-uously vaporized in the air stream containing the volatilized organic aerosol prior to ionization by a corona discharge. The intensity of the corona discharge was set at 9 µA and the shield voltage at 600 V. The analyses were performed using alternatively the positive and the negative ionization modes with a capillary voltage of+40 V and−40 V,
15
respectively. Nitrogen served both as the drying gas and the auxiliary gas was deliv-ered at a pressure of 1.0×10⁵and 1.4×10⁴Pa, respectively. The drying gas temper-ature was held at 350◦C. The total ion current (TIC) of the mass spectra were recorded between 65 and 1000 Da (Dalton) for the negative mode, and between 59 and 1000 Da for the positive mode during the analysis, with a resolution of 1.0 Da and a scan time of
20
5 s. This instrument is complementary to the AMS as the atmospheric pressure chem-ical ionization is a soft ionization method resulting in minimal fragmentation, and thus it allows one to determine the molar mass of most of the compounds present in the mixture. In positive ionisation, ions are produced by protonation with H+ or cationiza-tion with sodium ions (Na+, present in all glasswares, and in particular in the syringe
25
ACPD
11, 21489–21532, 2011Aqueous phase processing of secondary organic
aerosols
Y. Liu et al.
Title Page
Abstract Introduction
Conclusions References
Tables Figures
◭ ◮
◭ ◮
Back Close
Full Screen / Esc
Printer-friendly Version Interactive Discussion
Discussion
P
a
per
|
Dis
cussion
P
a
per
|
Discussion
P
a
per
|
Discussio
n
P
a
per
|
2.2.2 Aqueous phase characterizations
The chemical composition of liquid samples before and after 20 h of reaction with OH, or H2O2, or untreated, was analyzed by an atmospheric pressure chemical ionization
mass spectrometer operated with either a direct infusion of the solutions (APCI-MS), or with a liquid chromatographic separation column (HPLC-APCI-MS), and ion
chro-5
matography coupled to a mass spectrometer (IC-MS).
APCI-MS and APCI-MS2
Direct analysis of the liquid samples was performed using the MS and APCI-MS2. Samples and standard solutions were directly injected into the APCI source (no chromatographic column) at a flow rate of 40 µl min−1. In order to optimize the
ion-10
ization of organic molecules, liquid methanol (0.2 µl min−1) was continuously vaporized into the APCI source using an HPLC pump. The nebulizing gas was nitrogen for the positive mode and synthetic air for the negative mode, delivered at a pressure of 55 psi at 300◦C. All other parameters (i.e. voltages, pressures and temperatures of drying and auxiliary gases, corona discharge intensity and voltage, mass range, resolution
15
and scan time) were set at the same conditions as those indicated above for the TD-API-AMS analyses. The compounds were identified by APCI-MS2 characterization. In this case, argon (collision gas) was delivered at a pressure of 0.27 Pa to the collision cell. The collision energy was between 5 and 20 V depending on the compound, with a resolution of 1.0 Da and a scan time of 0.5 s.
20
HPLC-APCI-MS
Liquid samples generated during the experiments with isoprene were also analyzed by HPLC-APCI-MS. The separation column was a synergi Hydro-RP 250×2.4 µm, phe-nomenex. The analytes were subjected to chromatography using a gradient of two sol-vents (A: 0.1 % acetic acid aqueous solution and B: methanol) delivered at a constant
ACPD
11, 21489–21532, 2011Aqueous phase processing of secondary organic
aerosols
Y. Liu et al.
Title Page
Abstract Introduction
Conclusions References
Tables Figures
◭ ◮
◭ ◮
Back Close
Full Screen / Esc
Printer-friendly Version Interactive Discussion
Discussion
P
a
per
|
Dis
cussion
P
a
per
|
Discussion
P
a
per
|
Discussio
n
P
a
per
|
flow rate of 0.2 ml min−1. The elution program was: 5 % of B from 0 to 12 min, then in-creased to 100 % from 12 min to 60 min, followed by 100 % of B from 60 to 65 min, and 5 % B until 90 min. The analyses were realized using single ion monitoring (SIM) in the positive and in the negative mode. The APCI parameters were the same as described above with a resolution of 1.0 Da and a scan time of 0.5 s.
5
IC-MS
Liquid samples were also analyzed by IC-MS, in order to detect the organic acids present in the extracts. The samples were directly injected onto a separation column (AS11-HC with guard column AG-11HC, Dionex) where they were eluted within 29 min with a hydroxy anion (OH−) gradient: 0 min 0.5 m M OH−, 5 min 0.5 m M, 15 min 20 m M,
10
21 min 60 m M, 23 min 60 m M, 23.1 min 0.5 m M, 29 min 0.5 m M. After elution, the OH− was eliminated by an anion self-regenerating suppressor (ASRS®Ultra 2mm, Dionex). The detector was a mass spectrometer coupled with an electrospray ionization source (ESI-MS) operated in the negative mode, with a capillary voltage of 3.5 kV and a source voltage of 50 V. The nebulizing gas was held at 450◦C. The acids were identified by
15
theirm/zvalues and their retention times (RT), by comparison to commercially available standards.
2.3 Chamber experiments
The Paul Scherrer Institute smog chamber has been described in detail elsewhere (Paulsen et al., 2005). Briefly, it is a 27-m3 Teflon bag (3 m×3 m×3 m) enclosed in
20
a thermally regulated housing. The chamber is illuminated with four 4-kW xenon arc lamps, to simulate the tropospheric solar spectrum. The lights are turned on after the gaseous precursors are equilibrated in the chamber (typically 15–30 min). Experiments were monitored with a variety of aerosol and gas-phase characterization instruments, as outlined above. All experiments were conducted at 50–60 % relative humidity, and
25
ACPD
11, 21489–21532, 2011Aqueous phase processing of secondary organic
aerosols
Y. Liu et al.
Title Page
Abstract Introduction
Conclusions References
Tables Figures
◭ ◮
◭ ◮
Back Close
Full Screen / Esc
Printer-friendly Version Interactive Discussion
Discussion
P
a
per
|
Dis
cussion
P
a
per
|
Discussion
P
a
per
|
Discussio
n
P
a
per
|
2.4 Aqueous phase experiments
OH-oxidation of the water extracts was performed in an aqueous phase photoreactor described in detail in Monod et al. (2005, 2000). Briefly, it is a Pyrex thermo-controlled reactor of 450 cm3, equipped with a xenon arc lamp (300 W; Oriel), and a pyrex filter to remove the UV irradiation below 300 nm. The resulting irradiance spectrum was
5
comparable to the one of the sun at the earth’s ground level (in the UV-visible re-gion), but much less intense (about 4 %). H2O2 was added to the water extracts prior to photolysis, in order to produce OH radicals. The aqueous solution was continu-ously stirred and maintained at a constant temperature (298±0.2 K). The initial H2O2
concentrations were chosen in order to produce sufficient quantities of OH radicals in
10
the aqueous phase to oxidize the extracted organic compounds from the SOA. The initial concentrations of H2O2 were calculated (i) using estimated values of the
aque-ous phase concentrations of soluble organic compounds; (ii) assuming for them an aqueous phase OH-oxidation rate constant similar to the one of methacrolein (Liu et al., 2009) (for isoprene experiments), and pinic acid (calculated using the
Structure-15
Activity Relationship – SAR – of Monod and Doussin, 2008) (for α-pinene and TMB experiments); and (iii) in order to favour the OH-oxidation of soluble organics rather than that of H2O2by a factor of more than 70 % (under the above assumptions).
2.5 Nebulization experiments
Liquid solutions were nebulized using a TSI 3076 type nebulizer, and an
experimen-20
tal set up described in details in Paulsen et al. (2006). The particle laden air out of the nebulizer, with a flow of ∼1.5 l min−1, was diluted by synthetic air with a flow of ∼1.5 l min−1from a gas bottle or a pure air generator (AADCO Instruments, Inc., USA, 737-250 series).
For all of experiments described here (No. 1 to 4, see Table 1), the “control”, “dark
25
ACPD
11, 21489–21532, 2011Aqueous phase processing of secondary organic
aerosols
Y. Liu et al.
Title Page
Abstract Introduction
Conclusions References
Tables Figures
◭ ◮
◭ ◮
Back Close
Full Screen / Esc
Printer-friendly Version Interactive Discussion
Discussion
P
a
per
|
Dis
cussion
P
a
per
|
Discussion
P
a
per
|
Discussio
n
P
a
per
|
a negative time trend. The reason for this variability is not clear but, in some cases, it may be due to changes in the chemical composition during nebulization (see Sect. 3.3). Relative measured parameters, such as relativem/z fractions (measured by the AMS) showed a slight time trend. Therefore, the results shown in the next sections are given as average values of 30 to 90 min of nebulization (45 min for AMS; 90 min for H-TDMA
5
and 30 min for TD-API-AMS), depending on the time step measurements of each in-strument.
2.6 Reagents
Isoprene (Fluka 99.5 %), α-pinene (Aldrich 98 %), TMB (Fluka 99 %), H2O2 (without stabilizer, Aldrich, 50 wt %), glyoxylic acid (Acros, 98 %), pyruvic acid (Aldrich, 98 %),
10
oxalic acid (Sima-Aldrich, ≥99 %), 3-butene-1,2-diol (Aldrich, ≥99 %), D-erythrose (Sigma,≥75 %), DL-glyceraldehyde (ABCR, 40 % in water), D-threitol (Aldrich, 99 %), 2-methylfuran (Aldrich, 99 %), 3-methylcrotonaldehyde (Aldrich, 97 %), and methanol (Acros, HPLC grade) were used. Following the protocol described by Claeys et al. (2004b), 2,3-dihydroxymethacrylic acid (DHMA) was synthesized from methacrylic
15
acid (Acros, 99.5 %) by reaction with hydrogen peroxide (50 % aqueous solution; 50 ml), in the presence of sulfuric acid (0.1 M; 25 ml). The pH of the mixture was around 2. The reaction mixture was shaken thoroughly and left at room temperature for 2 h before analysis. A detailed identification of this molecule by mass spectrometry can be found in Liu et al. (2009). The synthesis of 1-hydroxyethyhydroperoxide (1-HEHP)
20
was performed by mixing pure acetaldehyde (6 µl) and H2O2(50 % aqueous solution; 8 µl) in 10 ml of pure water during five days prior to analysis. Solutions were prepared using UHQ water (Millipore), including reverse osmosis, micro-filtration, nuclear-grade deionization and activated carbon modules. The resistivity of the obtained water was greater than 1.8×10⁷Ωcm−1.
ACPD
11, 21489–21532, 2011Aqueous phase processing of secondary organic
aerosols
Y. Liu et al.
Title Page
Abstract Introduction
Conclusions References
Tables Figures
◭ ◮
◭ ◮
Back Close
Full Screen / Esc
Printer-friendly Version Interactive Discussion
Discussion
P
a
per
|
Dis
cussion
P
a
per
|
Discussion
P
a
per
|
Discussio
n
P
a
per
|
3 Results and discussion
3.1 SOA formation in the smog chamber
Substantial quantities of SOA were formed in the smog chamber during the gas phase photooxidation of isoprene,α-pinene and TMB for all experiments (Fig. S1 in the Sup-plement). Maximum SOA concentrations were higher than 200 µg m−3. They were
5
collected for 2 h at 6 l min−1, and then extracted in 130 or 160 ml UHQ water (Millipore). The aqueous phase concentration of organic aerosol reached, after water extraction (and assuming a particle density of 1 g cm−3), 0.4 mg l−1 for SOA generated from iso-prene, and at least 0.9 mg l−1for SOA generated from TMB andα-pinene. This organic concentration in the extract is similar to dissolved organic carbon (DOC) concentration
10
found in bulk precipitation (0.5–5 mg l−1) at Zagreb and Sibenik, Croatia (Orlovic-Leko et al., 2009) and to the lower DOC concentration found in cloud water (1–9 mg l−1) at Puy de Dome, France (Marinoni et al., 2004). During the photooxidation ofα-pinene and TMB, once nucleation had started, the particle size increased rapidly, and ex-ceeded the measured range of the SMPS (i.e. >685 nm) after 1:30 h and 3:30 h of
15
photooxidation, respectively. This observation is due to the high initial concentrations of reactants introduced. Isoprene was introduced in even higher quantities (Table 1), but, due to its low ability to form SOA (Surratt et al., 2006; Dommen et al., 2009), the particles did not exceed the range of the SMPS (Fig. S1 in the Supplement). The num-ber and size distribution showed a very good agreement between experiments 1 and 2
20
ACPD
11, 21489–21532, 2011Aqueous phase processing of secondary organic
aerosols
Y. Liu et al.
Title Page
Abstract Introduction
Conclusions References
Tables Figures
◭ ◮
◭ ◮
Back Close
Full Screen / Esc
Printer-friendly Version Interactive Discussion
Discussion
P
a
per
|
Dis
cussion
P
a
per
|
Discussion
P
a
per
|
Discussio
n
P
a
per
|
3.2 Influence of aqueous phase processing on SOA aging
3.2.1 AMS measurements
The bulk composition as measured by the AMS showed a slightly higherf44 (ratio of
m/z=44 to total organic aerosol) for the water extracted organic aerosol than from the direct chamber measurement. This is in very good agreement with the observations
5
by Lee et al. (2011) who performed the same kind of SOA treatment and analysis, and is potentially due to the loss of less soluble species having a lower extraction efficiency than more oxidized species. The degree of oxidation can be characterized in terms of the two main ionsm/z=44 (CO+2) andm/z=43 (mostly C2H3O+), which were used to
follow the aging of organic aerosol in the atmosphere by a compilation study of AMS
10
data (Ng et al., 2010). In this study, low volatility oxygenated organic aerosol (LV-OOA) has a higherf44component compared to the semi-volatile oxygenated organic aerosol (SV-OOA) which in turn has a higherf43(ratio ofm/z=43 to total organic aerosol). Fig-ure 2 compares thef44versusf43 values to those provided in the compilation by Ng et al. (2010), and the results obtained by Lee et al. (2011). It is seen that thef44versusf43 15
values obtained here fall close to the lower half of the triangular region defined by Ng et al. (2010). This region of the triangle is characteristic of lower O:C ratios and pho-tochemical ages, and is the region where most of the laboratory SOA data are found (Ng et al., 2010; Lee et al., 2011). For the isoprene andα-pinene experiments No. 1 to 3, f43 decreases and f44 increases in “H2O2+hν samples” compared to “control 20
samples”. These observations show that aqueous phase photooxidation can induce SOA aging. Figure 2 shows thatf44 values of our “H2O2+hν sample” move towards
the values of LV-OOA observed in the field by Ng et al. (2010). However, the aging ef-fect observed here is small. This can be due to the difference of composition between laboratory generated and ambient SOA. In particular, the high initial precursor
concen-25
ACPD
11, 21489–21532, 2011Aqueous phase processing of secondary organic
aerosols
Y. Liu et al.
Title Page
Abstract Introduction
Conclusions References
Tables Figures
◭ ◮
◭ ◮
Back Close
Full Screen / Esc
Printer-friendly Version Interactive Discussion
Discussion
P
a
per
|
Dis
cussion
P
a
per
|
Discussion
P
a
per
|
Discussio
n
P
a
per
|
represented well that of the tropospheric sunlight in the UV-visible region, its intensity was only about 4 % of that of sunlight at noon in mid latitudes in summer. This obser-vation can also explain that the aging effect obtained here was also small compared to the study by Lee et al. (2011) who used a Hg lamp, which spectrum is highly intense only at 254 nm, deeper in the UV region than the tropospheric sunlight.
5
3.2.2 H-TDMA measurements
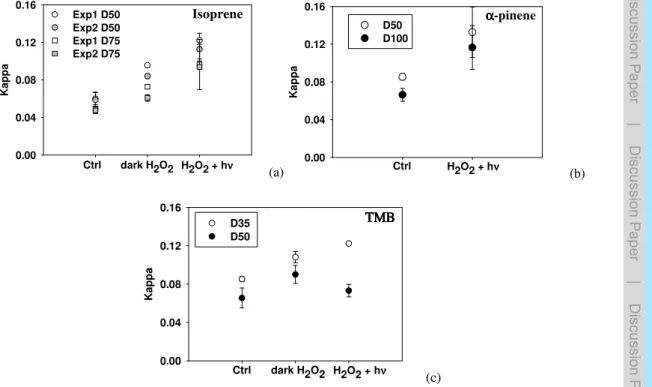
For all nebulized samples, the H-TDMA data were taken into account during 90 min. The dependence of the hygroscopicity on particle composition can be represented with the hygroscopicity parameterκ. According to Petters and Kreidenweis (2007), the val-ues ofκ range from 0.01 to 0.5 for slightly to very hygroscopic organic species. The
10
κ values obtained here for “control” samples are comprised between 0.04 and 0.08 for the three precursors, thus showing that the formed SOA are only slightly hygro-scopic (Fig. 3). The hygrohygro-scopicity of the particles increases significantly from “control” samples (κ=0.04–0.08) to “dark H2O2” samples (κ=0.06–0.10) and to “H2O2+hν”
samples (κ=0.1–0.13) for isoprene and α-pinene (Fig. 3a and b). This increase of
15
hygroscopicity indicates that the aged SOA (formed after aqueous phase processing) contains more hygroscopic products. This result is consistent with the AMS data which show a clear increase of the f44/f43 ratio from “control samples” to “H2O2+hν sam-ples” for isoprene andα-pinene. These observations of the bulk aerosol hygroscopic properties provide evidence that aqueous phase photooxidation induces SOA aging.
20
Comparing the two experiments performed with isoprene, Fig. 3a shows that, although both experiments start at the same values ofκ (for both selected particle diameters), the aqueous phase aging effect is significantly more pronounced for experiment 1 than for experiment 2. This observation is in excellent agreement with the AMS results. Figure 2 shows that thef44/f43 ratio are the same for “control samples” for both
exper-25
iments, while for “dark H2O2” and “H2O2+hν” samples, these ratios are significantly
ACPD
11, 21489–21532, 2011Aqueous phase processing of secondary organic
aerosols
Y. Liu et al.
Title Page
Abstract Introduction
Conclusions References
Tables Figures
◭ ◮
◭ ◮
Back Close
Full Screen / Esc
Printer-friendly Version Interactive Discussion
Discussion
P
a
per
|
Dis
cussion
P
a
per
|
Discussion
P
a
per
|
Discussio
n
P
a
per
|
the same experimental conditions. The only difference is that filter sampling (from the smog chamber) started one hour later for the first experiment than for the second one. For the TMB experiment, Fig. 3c shows no significant evolution of theκ values from “control” samples to “dark H2O2” samples and to “H2O2+hν” samples. One cannot
compare these results with the AMSf44/f43ratios (signal levels were too low during the
5
nebulisation for the AMS data to be interpreted with confidence), but we have observed an important effect of sampling and/or extraction and/or nebulization on the chemical composition of SOA formed from TMB (see next section).
3.3 Influence of sampling, extraction and/or nebulization on the chemical
composition of SOA 10
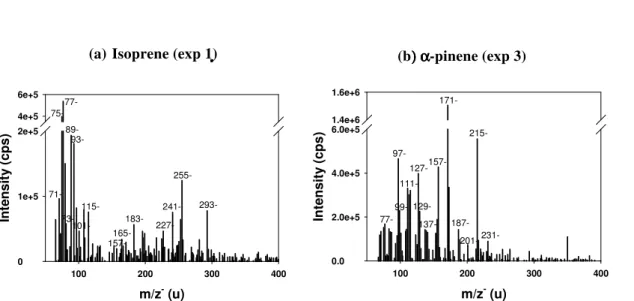
The mass spectra obtained using the TD-API-AMS directly connected to the smog chamber showed a large number of ions in both the positive and the negative modes (Fig. 4). The most abundant ions in both modes were observed in the mass range 75– 250 Da with some ions present up to 260 Da. Above 300 Da, no ions were observed under our instrumental conditions. As mentioned earlier, due to the low fragmentation
15
generated in this instrument, the ions detected provide the molar mass of most of the compounds present in the mixture. Comparing our mass spectra with existing data, the most intense peaks (Fig. 4) correspond to reaction products observed in SOA by earlier studies for the three precursors (Camredon et al., 2010; Hellen et al., 2008; Healy et al., 2008; Surratt et al., 2008; Claeys et al., 2004b). In particular, Camredon et al. (2010)
20
performed a detailed product analysis forα-pinene with a similar instrument (ESI-MS) and observed very similar mass spectra up to 300 Da (such as 10-hydroxypinonic, pinonic, norpinic, pinic acids).
In order to investigate the effects of sampling, extraction and nebulization on the chemical composition of SOA, Fig. 4 shows a comparison of the mass spectra obtained
25
ACPD
11, 21489–21532, 2011Aqueous phase processing of secondary organic
aerosols
Y. Liu et al.
Title Page
Abstract Introduction
Conclusions References
Tables Figures
◭ ◮
◭ ◮
Back Close
Full Screen / Esc
Printer-friendly Version Interactive Discussion
Discussion
P
a
per
|
Dis
cussion
P
a
per
|
Discussion
P
a
per
|
Discussio
n
P
a
per
|
for isoprene and by a factor of 4.0 forα-pinene (Fig. 4). These factors were determined by a linear regression of the intensity of the major masses (most intense peaks) be-tween the measurements from the smog chamber and the measurements after nebu-lization of “control samples”. The high correlation between each pair of measurements provides good evidence that the relative intensities are quite similar for isoprene and
5
α-pinene (R2=0.88 and 0.70 respectively), indicating that the chemical composition of SOA did not change significantly due to sampling, extraction and nebulization for isoprene and α-pinene. However, no correlation was observed for TMB (R2=0.12), which can indicate significant changes of chemical composition during nebulization for the SOA from this precursor.
10
Because of the low signal intensity obtained with the nebulized aerosol measure-ments, and because of the discrepancy of TMB mass spectra from the chamber and after nebulization, no further direct comparison between smog chamber SOA and pro-cessed SOA was performed for our experiments. Only the results obtained for the aqueous phase chemical composition before and after processing are presented in
15
detail below.
3.4 Influence of aqueous phase processing on SOA aging on the basis of
aqueous phase chemical characterization
In order to investigate the effects of aqueous phase processing on the chemical com-position of the sampled SOA (through oxidation by H2O2in the dark or oxidation by OH 20
radicals), comparisons between the chemical composition of (i) “control” samples and “H2O2+hν” samples (Fig. 5); (ii) “control” sample and “dark H2O2” samples (Fig. S2
in the Supplement); (iii) “dark H2O2” samples and “H2O2+hν” sample (Fig. S3 in the
Supplement) were performed. The mass spectra, obtained by direct infusion into the APCI-MS, showed significant differences in the negative mode for isoprene and α
-25
pinene.
ACPD
11, 21489–21532, 2011Aqueous phase processing of secondary organic
aerosols
Y. Liu et al.
Title Page
Abstract Introduction
Conclusions References
Tables Figures
◭ ◮
◭ ◮
Back Close
Full Screen / Esc
Printer-friendly Version Interactive Discussion
Discussion
P
a
per
|
Dis
cussion
P
a
per
|
Discussion
P
a
per
|
Discussio
n
P
a
per
|
presented in Fig. 4b, indicates that most of the formed ions correspond to compounds observed in the initial SOA formation in the smog chamber. It is thus likely that the corresponding reaction products are already present in the SOA collected from the smog chamber and their formation is enhanced within the aqueous phase (Tan et al., 2009, 2010; El Haddad et al., 2009; Carlton et al., 2009). The effects of H2O2cannot
5
be compared to those of OH radicals, because of the lack of “dark H2O2” samples
duringα-pinene experiments (Table 1).
For isoprene, many new compounds were formed during the aqueous phase pro-cessing, as seen by new ions signal appeared in two distinct mass ranges: 60–150 Da, and 150–300 Da (Fig. 5a). By comparing the “H2O2+hν” samples with the “dark H2O2” 10
samples and “control” samples (Figs. S2 and S3 in the Supplement), it becomes clear that the formation of these ions in these two mass ranges were caused by both OH radicals and H2O2.
– In the mass range 60–150 Da, most of the ion masses correspond to those ob-served in SOA formed from gas phase reactions (Fig. 4a). It is thus likely that
15
the aqueous phase aging of SOA leads to further formation of the corresponding products. Further identification of eleven of these aqueous phase products (in the mass range 60–150 Da) provide evidence for this assumption (see Sect. 3.5).
– In the mass range 150–300 Da, most of the ions are new compared to the initial SOA composition. Their molecular masses are 2–4 times higher than that of
20
isoprene, and the observed distribution is consistent with the development of an oligomer system that shows a highly regular pattern of mass differences of 14, 16, 18 and 28 Da. Therefore, we assume that the corresponding products have been formed by aqueous phase oligomerization processes.
3.5 Discussion on the isoprene results
25
ACPD
11, 21489–21532, 2011Aqueous phase processing of secondary organic
aerosols
Y. Liu et al.
Title Page
Abstract Introduction
Conclusions References
Tables Figures
◭ ◮
◭ ◮
Back Close
Full Screen / Esc
Printer-friendly Version Interactive Discussion
Discussion
P
a
per
|
Dis
cussion
P
a
per
|
Discussion
P
a
per
|
Discussio
n
P
a
per
|
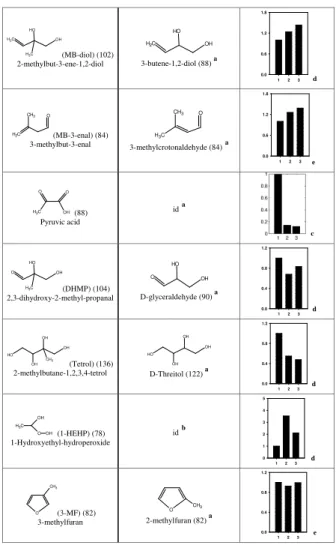
and 2. The identification of reaction products was done in “H2O2+hν” samples using APCI-MS2during experiment 1. Additionally, in order to determine the effects of aque-ous phase processing on SOA composition, the abundance of 33 specific products was compared between “H2O2+hν” samples, “dark H2O2” samples and “control” samples
using HPLC-MS during experiment 2. The results obtained using these two
comple-5
mentary analyses are discussed in the following, for the mass ranges 60–150 Da and 150–300 Da separately.
3.5.1 Mass range 60–150 Da
Identification using APCI-MS2
During experiment 1, nine reaction products were identified in “H2O2+hν” samples 10
using APCI-MS2in the positive and in the negative modes. The identification was per-formed by comparison of the APCI-MS2 fragments between “H2O2+hν” samples and
those of commercial or synthesized standards with exact or similar chemical structures (Table 2). We identified 2-methylbut-3-ene-1,2-diol (MB-diol), 2,3-dihydroxy-2-methyl-propanal (DHMP), trihydroxy-3-methylbutanal (THMB), 2-methylbutane-1,2,3,4-tetrol
15
(tetrol) in the negative mode using commercial standards that had the same chemi-cal structure except for a methyl group. The obtained mass spectra were similar, with a systematic shift of 14 Da corresponding to the missing methyl group in the standards. We identified 3-methylfuran (3-MF) and 3-methylbut-3-enal (MB-3-enal) in the posi-tive mode with commercial standard isomers. Finally, 1-hydroxyethyl-hydroperoxide
(1-20
HEHP) and 2,3-dihydroxy-methacrylicacid (DHMA) were identified using synthesized standards (see reagents). All these identified reaction products fall in the mass range 60–150 Da, and have been identified in SOA formed from isoprene photooxidation in earlier studies (Surratt et al., 2006; Edney et al., 2005; Ion et al., 2005; Kourtchev et al., 2005). Furthermore, some of them (such as DHMA and tetrol) have also been
25
ACPD
11, 21489–21532, 2011Aqueous phase processing of secondary organic
aerosols
Y. Liu et al.
Title Page
Abstract Introduction
Conclusions References
Tables Figures
◭ ◮
◭ ◮
Back Close
Full Screen / Esc
Printer-friendly Version Interactive Discussion
Discussion
P
a
per
|
Dis
cussion
P
a
per
|
Discussion
P
a
per
|
Discussio
n
P
a
per
|
al., 1999) and water droplets in a power plant plume, in clean clouds as well as in a maritime area (Sorooshian et al., 2006b; Warneck 2003).
Quantification using HPLC-MS and IC-MS
During experiment 2, HPLC-MS and IC-MS measurements were performed for the liquid samples, in order to compare the quantity of the 16 identified compounds
be-5
tween “H2O2+hν” samples, “dark H2O2” samples and “control” samples (Table 2).
The HPLC-MS and IC-MS techniques allowed separating species that had the same molecular mass and for a quantitative comparison between the three samples, which is much more precise than the direct infusion method. Because no systematic calibra-tion was performed for all these compounds, and because the analyses of the three
10
samples were performed under the same conditions, the chromatographic peak areas (which are proportional to the aqueous phase concentrations under our experimental conditions) are compared in Table 2. All peak areas were normalized to “control sam-ple”. The analytic standard deviation was 3 to 14 % for HPLC-MS analysis, and varied from 1 to 25 % for IC-MS analysis, depending on the species and their concentrations.
15
Among the 16 compounds, the concentrations of formic, glyoxylic, glycolic, bu-tyric, oxalic acid, DHMA, THMB, MB-diol, MB-3-enal, increased significantly in the “H2O2+hν” samples and “dark H2O2” samples compared to the “control” samples (Ta-ble 2). It is thus likely that these compounds are produced in the aqueous phase by oxidation of water soluble precursors by H2O2 and by photooxidation. The poten-20
tial precursors are small multifunctional carbonyls (glycolaldehyde, hydroxyacetone, glyoxal, methylglyoxal, hydroxymethylglyoxal, oxopropanedial, 2,3-dioxobutanal) that have been specifically studied by Healy et al. (2008) on SOA formed from isoprene photooxidation in smog chambers under similar conditions as ours. All these precur-sors are highly water soluble, thus they were likely transferred to the aqueous phase
25
ACPD
11, 21489–21532, 2011Aqueous phase processing of secondary organic
aerosols
Y. Liu et al.
Title Page
Abstract Introduction
Conclusions References
Tables Figures
◭ ◮
◭ ◮
Back Close
Full Screen / Esc
Printer-friendly Version Interactive Discussion
Discussion
P
a
per
|
Dis
cussion
P
a
per
|
Discussion
P
a
per
|
Discussio
n
P
a
per
|
acid which concentrations increase from the “control” to the “H2O2+hν” samples in the present study (Table 2). The formation of glyoxylic and oxalic acids has also been observed during the aqueous phase photooxidation of methylglyoxal (by Altieri et al., 2008; Tan et al., 2010) and glyoxal (Carlton et al., 2007; Tan et al., 2009), which are among the potential precursors identified by Healy et al. (2008). The aqueous phase
5
photooxidation of the other precursors has not yet been studied (to our knowledge), but they are likely to produce the acids that have been observed to increase in the present study from the “control” to the “H2O2+hν” samples. It can be noted that formic and
oxalic acids show among the largest increase, which is in good agreement with the fact that these compounds are end chain reaction products and are stable towards most of
10
reactants in the atmosphere, as it was shown by field observations (Yao et al., 2003; Legrand et al., 2005, 2007; Sorooshian et al., 2006b).
For pyruvic acid, DHMP and tetrol, a significant decrease of their concentrations is observed between the “control” sample and the “H2O2+hν” sample, and between the “control” samples and “dark H2O2” samples, thus showing that they were consumed 15
by oxidation by H2O2 and photooxidation. This observation is in agreement with the
studies by Guzm ´an et al. (2006), Carlton et al. (2006) and Altieri et al. (2006) who have shown that in the aqueous phase pyruvic acid is photosensitive and highly reactive towards OH radicals, leading to the formation of oxalic acid (among other products), which has been observed to increase from the “control” sample to the “H2O2+hν”
20
sample in the present study.
The concentrations of 1-HEHP show a particular behaviour: they increase signifi-cantly in the “dark H2O2” sample and “H2O2+hν” sample compared to “control” sam-ple, and they decrease significantly in “H2O2+hν” sample compared to “dark H2O2”
sample. This behaviour can be explained by aqueous phase formation of this
com-25
ACPD
11, 21489–21532, 2011Aqueous phase processing of secondary organic
aerosols
Y. Liu et al.
Title Page
Abstract Introduction
Conclusions References
Tables Figures
◭ ◮
◭ ◮
Back Close
Full Screen / Esc
Printer-friendly Version Interactive Discussion
Discussion
P
a
per
|
Dis
cussion
P
a
per
|
Discussion
P
a
per
|
Discussio
n
P
a
per
|
The concentrations of 3-methylfuran do not show any significant changes between “control” sample, “dark H2O2” sample and “H2O2+hν” sample. The reason for this behaviour may be that this compound was produced and consumed in the aqueous phase in roughly the same quantities.
Finally the concentrations of lactic acid and methylmaleic acid show a significant
5
change between “dark H2O2” sample and the two other samples, but we do not have
any explanation for this trend.
Overall, the effects of photooxidation were unexpectedly comparable to those of H2O2 (in the dark). This observation can be explained by (i) the amounts of H2O2
used (calculated using several hypotheses, see Sect. 2.4), and ii) the low intensity of
10
the xenon lamp within the photoreactor (which corresponded only to roughly 4 % of the sun light at noon in mid latitudes during the summer).
Among the compounds that are produced in the aqueous phase, DHMA and THMB correspond to the oxidized forms of DHMP and tetrol respectively, which are consumed in the aqueous phase. It is thus probable that the aqueous phase oxidation of DHMP
15
and tetrol by H2O2 and/or by OH radicals leads to DHMA and THMB respectively,
following the chemical mechanisms proposed in Fig. 6a and b.
3.5.2 In the mass range 150–300 Da
As shown in Fig. 5a, the formation of many new ions was detected in the mass range 150–300 Da, with the development of an oligomer system which was due to aqueous
20
phase processing (as described in Sect. 3.4). In this mass range, five ions were ana-lyzed by HPLC-MS and APCI-MS2. The HPLC-MS analysis showed that these five ions had different retention times (between 5.5 and 7 min for m/z=169−, 171−, 153+Da; 42 min form/z=183−Da, and 64 min for m/z=233−Da), thus attributing them to dif-ferent reaction products. These five compounds were characterized using APCI-MS2
25
ACPD
11, 21489–21532, 2011Aqueous phase processing of secondary organic
aerosols
Y. Liu et al.
Title Page
Abstract Introduction
Conclusions References
Tables Figures
◭ ◮
◭ ◮
Back Close
Full Screen / Esc
Printer-friendly Version Interactive Discussion
Discussion
P
a
per
|
Dis
cussion
P
a
per
|
Discussion
P
a
per
|
Discussio
n
P
a
per
|
ions 169−, 183− and 233− can be oxo-carboxylic acids, and the neutral losses of 18 and 44 indicate that ion 171−can be a hydroxy-carboxylic acid or a dicarboxylic acid.
Some of the potential precursors (glycolaldehyde, glyoxal, methylglyoxal) of the reac-tion products discussed in Sect. 3.5.1 have been shown to produce oligomers through aqueous phase photooxidation (Altieri et al., 2006, 2008; Carlton et al., 2006, 2007;
5
Perri et al., 2009; El Haddad et al., 2009; Tan et al., 2009, 2010; Zhang et al., 2010; Liu et al., 2011). Despite the very good agreement of the present study with previous work concerning the formation of small polyfunctional compounds through aqueous phase photooxidation of these potential precursors (Sect. 3.5.1), the oligomer forma-tion seems to behave very differently. Comparing the most intense peaks of the mass
10
spectra obtained in the present study (above 150 Da) with those described in the liter-ature, no concordance is achieved except for two ions:
– At 171 Da in the negative mode: the fragmentation spectrum obtained for this ion is very similar to the one obtained by El Haddad et al. (2009) (with the same instrument, operated under the same conditions) during the aqueous phase OH
15
oxidation of methacrolein, at 20 h of reaction (Fig. 7). However, methacrolein (one of the major gas-phase reaction products of isoprene) is highly volatile, and was not observed in the SOA by Healy et al. (2008). It is thus likely that ion 171− is a reaction product formed in the aqueous phase from the photooxidation of common non volatile products of methacrolein and isoprene.
20
– At 233 Da in the negative mode: this ion has been observed by Perri et al. (2009) and by Altieri et al. (2008), during the aqueous phase photooxidation of glyco-laldehyde and methylglyoxal, respectively. It was attributed to an oligomeric series consisting of the addition of oxalic acid to n molecules of methylglyoxal (withn=2 in the case of ionm/z=233−). However, the fragmentation of 233− in the present
25
ACPD
11, 21489–21532, 2011Aqueous phase processing of secondary organic
aerosols
Y. Liu et al.
Title Page
Abstract Introduction
Conclusions References
Tables Figures
◭ ◮
◭ ◮
Back Close
Full Screen / Esc
Printer-friendly Version Interactive Discussion
Discussion
P
a
per
|
Dis
cussion
P
a
per
|
Discussion
P
a
per
|
Discussio
n
P
a
per
|
These observations may indicate that the oligomerization process was very different in the present study compared to previous work. If we compare our results more glob-ally with the literature, we can say that we have observed the formation of oligomers between 150 and 300 Da, with a regular pattern of mass differences of 14, 16, 18 and 28 Da, whereas the previous studies have obtained oligomers up to 400, 500 and even
5
1200 Da, with highly regular patterns of mass differences of 12, 14, 16, 18 and 28 Da and also (depending on the precursor) 70 Da (methacrolein or methylvinylketone) and 72 Da (methylglyoxal). These large differences of mass spectral patterns can be ex-plained by the difference in the initial conditions. In the present work, we have investi-gated aqueous phase processing of a complex mixture containing a low initial
concen-10
tration of dissolved organic carbon (DOC) of 0.4 mg l−1(Sect. 3.1), whereas the previ-ous studies have investigated aqueprevi-ous phase photooxidation of a single oxygenated compound at elevated initial concentrations, ranging from 17 to 1800 mg l−1, thus 40 to 4000 times more concentrated than in our study. Very recently, it has been shown that oligomer formation depends highly on the initial concentration of the single compound
15
in the aqueous phase. During the photooxidation of glyoxal (Tan et al., 2009), methyg-lyoxal (Tan et al., 2010) or methylvinylketone (Liu et al., 2011), oligomers higher than 150 Da were observed for initial concentrations higher than 17, 72 and 140 mg l−1, re-spectively. Furthermore, in all these studies the oligomers were secondary products. It is thus likely that oligomerization processes occur between the initial precursor and its
20
first generation reaction products or their corresponding radicals (Guzm ´an et al., 2006; Altieri et al., 2006, 2008; El Haddad et al., 2009; Tan et al., 2009, 2010). These pro-cesses may explain why we obtained here different oligomers at much lower reactant concentrations (by a factor of 40 to 4000). Since our complex initial mixture is likely more representative to real atmospheric conditions, more research is needed in order
25
ACPD
11, 21489–21532, 2011Aqueous phase processing of secondary organic
aerosols
Y. Liu et al.
Title Page
Abstract Introduction
Conclusions References
Tables Figures
◭ ◮
◭ ◮
Back Close
Full Screen / Esc
Printer-friendly Version Interactive Discussion
Discussion
P
a
per
|
Dis
cussion
P
a
per
|
Discussion
P
a
per
|
Discussio
n
P
a
per
|
4 Conclusions
This paper reports experimental results on the aging of SOA by photooxidation in the aqueous phase. After sampling and water extraction of SOA formed in the smog cham-ber, the liquid phase concentration of organic matter was in the range of DOC concen-trations found in bulk precipitation and in cloud water. Comparing the nebulized SOA
5
before and after aqueous phase processing (by H2O2oxidation, and photooxidation) it was shown that the particles were significantly more hygroscopic after aqueous phase processing (observed with a H-TDMA). It was also shown that the particles contained more carboxylic functions (observed with an AMS), in agreement with previous recent studies of aqueous phase photochemical aging of SOA generated from dark ozonolysis
10
of d-limonene (Bateman et al., 2011), ofα-pinene (Lee et al., 2011), and also aque-ous phase photochemical aging of atmospheric aerosols and cloud water collected in a coniferous forest mountain site (Lee et al., 2011). It is thus strongly evidenced that aqueous phase reactivity induces a significant impact on SOA aging. Furthermore, it is likely that this impact is highly different depending on the precursor. For example,
15
the oligomeric compounds in the processed SOA was enriched when generated from isoprene photooxidation, was not impacted when generated fromα-pinene photooxi-dation, and was depleted when generated from d-limonene oznolysis (Bateman et al., 2011). In particular, for isoprene experiments, the processed SOA showed different oligomers starting from much lower aqueous phase DOC concentrations (by a factor
20
of 40 to 4000) compared to previous studies who explored the aqueous phase fate of individual precursors. Since our complex initial mixture is likely more representative to real atmospheric conditions, more research is needed in order to investigate in more detail the effects of the initial complex DOC composition and concentrations on the aqueous phase oligomerization processes, and their chemical mechanisms.
25
ACPD
11, 21489–21532, 2011Aqueous phase processing of secondary organic
aerosols
Y. Liu et al.
Title Page
Abstract Introduction
Conclusions References
Tables Figures
◭ ◮
◭ ◮
Back Close
Full Screen / Esc
Printer-friendly Version Interactive Discussion
Discussion
P
a
per
|
Dis
cussion
P
a
per
|
Discussion
P
a
per
|
Discussio
n
P
a
per
|
works that have explored the aqueous phase photooxidation of individual precursors. A chemical mechanism was proposed to explain the observation of aqueous phase consumption or formation of four of these compounds: aqueous phase oxidation of DHMP leading to DHMA; and aqueous phase oxidation of tetrol leading to THMB. The aqueous phase kinetic rate constant of tetrol towards OH radical is estimated to be
5
2.2×10⁹l mol−1s−1, (based on the SAR estimation method developed by Monod and Doussin, 2008). The corresponding aqueous phase lifetime is estimated to range from several minutes to several hours in the atmosphere. As tetrols are used as marker compounds of isoprene SOA (El Haddad et al., 2011), the degradation of tetrols by OH radicals in the aqueous phase might induce underestimations in the amount of biogenic
10
SOA in the atmosphere.
Overall, the effects of H2O2 oxidation (in the dark) were unexpectedly comparable
to those of photooxidation. This observation can be explained by the low intensity of the xenon lamp used in the photoreactor. The gas phase experiments were done under high NOxconditions in the smog chamber, thus no hydroperoxides were formed. 15
Because of the very low water solubility of NOx, their chemistry cannot take place in
the aqueous phase (Monod and Carlier, 1999). In this case, it facilitates the aqueous phase peroxidation of the soluble organic compounds, such as carbonyls that lead to the formation of peracids (Liu et al., 2009). Under natural conditions, H2O2 can
be formed through aqueous phase reactivity (M ¨oller, 2009, and references therein),
20
thus, the addition of H2O2(to form OH radicals by photolysis) was quite realistic in our
approach. Nevertheless, to simulate more realistic atmospheric conditions, this kind of approach should be complemented by real multiphase studies where gas and aqueous phase reactions occur simultaneously. However, in this case, it is difficult to analyse each phase separately, thus our approach is the only one that allows one to investigate
25
ACPD
11, 21489–21532, 2011Aqueous phase processing of secondary organic
aerosols
Y. Liu et al.
Title Page
Abstract Introduction
Conclusions References
Tables Figures
◭ ◮
◭ ◮
Back Close
Full Screen / Esc
Printer-friendly Version Interactive Discussion
Discussion
P
a
per
|
Dis
cussion
P
a
per
|
Discussion
P
a
per
|
Discussio
n
P
a
per
|
SOA formed from TMB. Still this example emphasizes that it is worthwhile to associate the two kinds of approaches complementarily.
Supplementary material related to this article is available online at: http://www.atmos-chem-phys-discuss.net/11/21489/2011/
acpd-11-21489-2011-supplement.pdf.
5
Acknowledgements. This study was funded by INTROP (ESF), EUROCHAMP, R ´eseau
ERICHE and the Provence-Alpes-C ˆote-d’Azur Region, INSU-LEFE-CHAT, the ANR-blanc (project CUMULUS), as well as the Swiss National Science Foundation. The authors thank Rafal Strekowski for his help for the instruments shipping from the University of Provence to the Paul Scherrer Institute.
10
References
Altieri, K. E., Carlton, A. G., Lim, H. J., Turpin, B. J., and Seitzinger, S. P.: Evidence for oligomer formation in clouds: reactions of isoprene oxidation products, Environ. Sci. Technol., 40, 4956–4960, 2006.
Altieri, K. E., Seitzinger, S. P., Carlton, A. G., Turpin, B. J., Klein, G. C., and Marshall, A. G.: 15
Oligomers formed through in-cloud methylglyoxal reactions: Chemical composition, proper-ties, and mechanisms investigated by ultra-high resolution FT-ICR mass spectrometry, At-mos. Environ., 42, 1476–1490, 2008.
Baltensperger, U., Kalberer, M., Dommen, J., Paulsen, D., Alfarra, M. R., Coe, H., Fisseha, R., Gascho, A., Gysel, M., Nyeki, S., Sax, M., Steinbacher, M., Pr ´ev ˆot, A. S. H., Sj ¨ogren, 20
S., Weingartner, E., and Zenobi, R.: Secondary organic aerosols from anthropogenic and biogenic precursors, Faraday Discuss., 130, 265–278, 2005.
Bateman, A. P., Nizkorodov, S. A., Laskinb, J., and Laskinc, A.: Photolytic processing of sec-ondary organic aerosols dissolved in cloud droplets, Phys. Chem. Chem. Phys., 13, 12199– 12212, 2011.
ACPD
11, 21489–21532, 2011Aqueous phase processing of secondary organic
aerosols
Y. Liu et al.
Title Page
Abstract Introduction
Conclusions References
Tables Figures
◭ ◮
◭ ◮
Back Close
Full Screen / Esc
Printer-friendly Version Interactive Discussion
Discussion
P
a
per
|
Dis
cussion
P
a
per
|
Discussion
P
a
per
|
Discussio
n
P
a
per
|
Camredon, M., Hamilton, J. F., Alam, M. S., Wyche, K. P., Carr, T., White, I. R., Monks, P. S., Rickard, A. R., and Bloss, W. J.: Distribution of gaseous and particulate organic composition during dark a-pinene ozonolysis, Atmos. Chem. Phys., 10, 2893–2917, doi:10.5194/acp-10-2893-2010, 2010.
Carlton, A. G., Turpin, B. J., Lim, H., Altieri, K. E., and Seitzinger, S.: Link between isoprene and 5
secondary organic aerosol (SOA): pyruvic acid oxidation yields low volatility organic acids in clouds, Geophys. Res. Lett., 33, L06822/1–L06822/4, doi:10.1029/2005GL025374, 2006. Carlton, A. G., Turpin, B. J., Altieri, K. E., Seitzinger, S., Reff, A., Lim, H. J., and Ervens, B.:
Atmospheric oxalic acid and SOA production from glyoxal: results of aqueous photooxidation experiments, Atmos. Environ., 41, 7588–7602, 2007.
10
Carlton, A. G., Wiedinmyer, C., and Kroll, J. H.: A review of Secondary Organic Aerosol (SOA) formation from isoprene, Atmos. Chem. Phys., 9, 4987–5005, doi:10.5194/acp-9-4987-2009, 2009.
Claeys, M., Graham, B., Vas, G., Wang, W., Vermeylen, R., Pashynska, V., Cafmeyer, J., Guyon, P., Andreae, M. O., Artaxo, P., and Maenhaut, W.: Formation of secondary organic 15
aerosols through photooxidation of isoprene, Science, 303, 1173–1176, 2004a.
Claeys, M., Wang, W., Ion, A. C., Kourtchev, I., Gelencser, A., and Maenhaut, W.: Formation of secondary organic aerosols from isoprene and its gas-phase oxidation products through reaction with hydrogen peroxide, Atmos. Environ., 38, 4093–4098, 2004b.
DeCarlo, P. F., Kimmel, J. R., Trimborn, A., and Northway, M. J.: Field-deployable, high-20
resolution, time-of-flight aerosol mass spectrometer, Anal. Chem., 78, 8281–8289, 2006. Dommen, J., Metzger, A., Duplissy, J., Kalberer, M., Alfarra, M. R., Gascho, A.,
Weingart-ner, E., Prevot, A. S. H., Verheggen, B., and Baltensperger, U.: Laboratory observation of oligomers in the aerosol from isoprene/NOx photooxidation, Geophys. Res. Lett., 33, L13805/1–L13805/5, 2006.
25
Dommen, J., Hellen, H., Saurer, M., J ¨aggi, M., Siegwolf, R., Metzger, A., Duplissy, J., Fierz, M., and Baltensperger, U.: Determination of the aerosol yield of isoprene in the presence of an organic seed with carbon isotope analysis, Environ. Sci. Technol., 43, 6697–6702, 2009. Edney, E. O., Kleindienst, T. E., Jaoui, M., Lewandowski, M., Offenberg, J. H., Wang, W., and
Claeys, M.: Formation of 2-methyl tetrols and 2-methylglyceric acid in secondary organic 30
aerosol from laboratory irradiated isoprene/NOx/SO2/air mixtures and their detection in am-bient PM2.5samples collected in the eastern United States, Atmos. Environ., 39, 5281–5289,