Category fluency test: effects of age,
gender and education on total scores,
clustering and switching in Brazilian
Portuguese-speaking subjects
Departamento de Neurologia, Hospital Santa Marcelina, São Paulo, SP, Brasil S.M.D. Brucki
and M.S.G. Rocha
Abstract
Verbal fluency tests are used as a measure of executive functions and language, and can also be used to evaluate semantic memory. We analyzed the influence of education, gender and age on scores in a verbal fluency test using the animal category, and on number of categories, clustering and switching. We examined 257 healthy par-ticipants (152 females and 105 males) with a mean age of 49.42 years (SD = 15.75) and having a mean educational level of 5.58 (SD = 4.25) years. We asked them to name as many animals as they could. Analysis of variance was performed to determine the effect of demographic variables. No significant effect of gender was observed for any of the measures. However, age seemed to influence the number of category changes, as expected for a sensitive frontal measure, after being controlled for the effect of education. Educational level had a statisti-cally significant effect on all measures, except for clustering. Subject performance (mean number of animals named) according to schooling was: illiterates, 12.1; 1 to 4 years, 12.3; 5 to 8 years, 14.0; 9 to 11 years, 16.7, and more than 11 years, 17.8. We observed a decrease in performance in these five educational groups over time (more items recalled during the first 15 s, followed by a progressive reduction until the fourth interval). We conclude that education had the greatest effect on the category fluency test in this Brazilian sample. Therefore, we must take care in evaluating performance in lower educational sub-jects.
Correspondence
S.M.D. Brucki
Rua Humberto Primo, 740/123 04018-032 São Paulo, SP Brasil
Fax: +55-11-5579-7104 E-mail: sbrucki@uol.com.br
Publication supported by FAPESP.
Received September 2, 2003 Accepted August 20, 2004
Key words
•Verbal fluency •Educational level •Neuropsychological tests •Category fluency
Introduction
Verbal fluency is a very useful test, which can be used to evaluate executive functions and language. The category test can be used to evaluate semantic memory. A number of ver-sions of the category test based on letter and semantic categories have been used. The most extensive experience has been obtained with
of Alzheimer’s disease, discriminating between early Alzheimer’s disease and normal controls (13-16).
The population of Brazil is aging and current low literacy and educational levels continue to be problems hampering the cor-rect evaluation of subjects with suspected cognitive impairment. However, normative data are needed for use in comparison with other studies, and descriptive analysis can help to understand cognitive processes in poorly educated individuals.
Many studies have revealed the influ-ence of education on total scores (17-23). In a previous survey of a Brazilian sample based on educational level, we determined cut-off scores of 9 for illiterates and subjects aged <8 years, and of 13 for persons with more than 8 years of schooling (24). A differenti-ated cut-off must be used for each country. A subsequent analysis of preliminary data showed that other qualitative measures in the word fluency test are also influenced by education (25). Nitrini et al. (26) found a cut-off of 13 named animals for subjects with 4 to 16 years of education in a Brazilian sample, but only elderly individuals were included.
Our main hypothesis was that education may have an important influence on the quan-titative and qualitative analysis of animal naming, which extends beyond the total scores observed in previous surveys. The specific goals are to investigate the effects of age (young to elder subjects), education and gender on animal naming, and to determine peculiarities in qualitative analysis specific for use in our environment.
Subjects and Methods
We examined 257 healthy subjects with no memory complaints and Mini-Mental State Examination (MMSE) scores above the cut-off levels for education (27). The population, recruited at Santa Marcelina Hospital, included spouses, relatives, and subjects either waiting for appointments or
from other clinics, along with hospital work-ers. We excluded subjects with motor limita-tions or uncorrected visual or hearing defi-cits that might influence their performance in tests, by means of both observation and a simple semi-structured questionnaire. The demographic characteristics of the sample used in the analysis are shown in Table 1. Distribution by gender was 152 females (59.14%) and 105 males. To assess the influ-ence of education on the scores, we divided subjects into five groups on the basis of education as follows: illiterate (N = 34, 13.2%); group 1: 1 to 4 years of schooling (N = 106, 41.2%); group 2: 5 to 8 years (N = 62, 24.1%); group 3: 9 to 11 years (N = 37, 14.4%), and group 4: subjects with more than 11 years of education (N = 18, 7.0%). To determine the influence of age we di-vided the sample into three groups: young (≤50 years, N = 135; 52.5%), adult (51 to 64 years, N = 68; 26.5%) and elderly subjects (≥65 years, N = 54; 21%). The groups did not differ in terms of age or education by gender, but educational level was different across age groups, with means of 6.5, 5.1, and 4.0 years of schooling, respectively, for young, adult and elderly individuals (F(2,254) = 7,786; P = 0.0005).
mem-bers of well-defined category (4 farm ani-mals, 1 wild animal, 3 insects, and 3 wild animals were considered to be three cat-egory changes); clustering was scored when subjects generated at least three consecutive animals of the same subcategory, with the possibility of repeating categories (3 farm animals, 3 wild animals, and 3 farm animals were considered to be three clusters). This classification was applied by the same ex-aminer (SMDB) to all data following collec-tion, and using the same procedure.
The animals named were analyzed to determine the role of education in the type of animals named, and to determine whether the prototype example would be the same across the educational groups.
Statistical analysis
Analysis of variance (ANOVA) was per-formed to ascertain whether age, gender and education had a significant main effect on total category fluency scores, intervals, clus-tering, and switching. Main univariate ef-fects and interaction terms were examined, with the adoption of a significant F at P < 0.05, and mean values were submitted to post hoc comparison by the Tukey test. Fried-man analysis of variance was performed to compare the number of animals produced per 15-s interval for each educational level. The comparison between male and female subjects in the verbal fluency measures was analyzed by the Student t-test.
Results
Scores for all subjects are shown in Table 1.
Effect of age
The total number of animals generated, the number of categories, and the clustering and switching of categories were analyzed by ANOVA, with post hoc comparisons of the means by the Tukey test, when required.
We observed no significant difference be-tween total 60-s scores or 15-s intervals. Qualitative analysis showed no difference in clustering, but there was a clear effect of age on number of categories (F(2,254) = 5.43; P = 0.0049) and switching (F(2,254)= 10.72; P = 0.00003). Post hoc comparisons showed that these differences occurred between young and elderly individuals in number of categories (P = 0.0195) and switching (P = 0.0010), and again between young and adult subjects in switching (P = 0.0237). When we introduced educational level as a covariable, the difference only persisted in switching (F(2,252) = 5.61; P = 0.0041). In post hoc comparison these results were attributable to the young group, with P = 0.0004 when comparing young and elderly groups and P = 0.0135 when comparing adult and young groups. There was no difference between adult and elderly individuals, i.e., subjects more than 50 years of age presented the same behavior in the test.
Effect of gender
There was no difference in age or educa-tion according to gender, nor for total scores, number of categories, clustering, or switch-ing. Male subjects mentioned slightly more items than females regarding total scores,
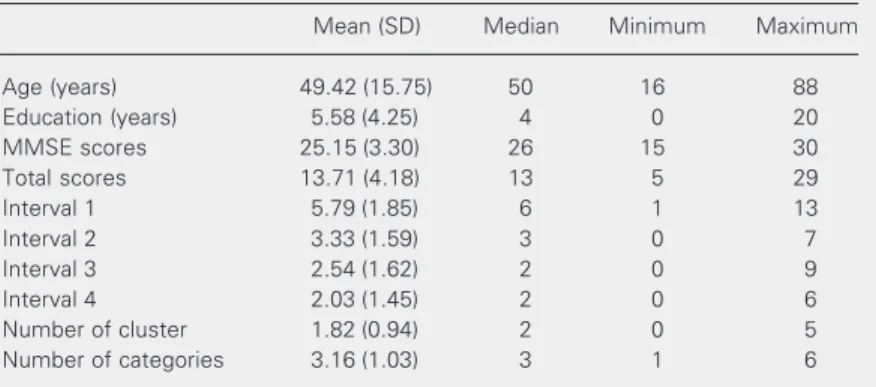
Table 1. Demographic characteristics of the 257 subjects of the study sample and verbal fluency test scores.
Mean (SD) Median Minimum Maximum
Age (years) 49.42 (15.75) 50 16 88 Education (years) 5.58 (4.25) 4 0 20 MMSE scores 25.15 (3.30) 26 15 30 Total scores 13.71 (4.18) 13 5 29
Interval 1 5.79 (1.85) 6 1 13
Interval 2 3.33 (1.59) 3 0 7
Interval 3 2.54 (1.62) 2 0 9
Interval 4 2.03 (1.45) 2 0 6
Number of cluster 1.82 (0.94) 2 0 5 Number of categories 3.16 (1.03) 3 1 6
intervals 2, 3, 4 and number of clusters. However, this difference was significant only for interval 2 (t = -2.398, P < 0.017). These results are presented in Table 2.
Effect of education
Educational level significantly affected the total number of animals generated in the fluency tasks, and in the various intervals, as well as number of clusters, changes between categories and number of categories. All measures exhibited significant differences.
This influence persisted after group divi-sion by educational level, except for cluster-ing. There were significant differences among the five educational level groups, whose val-ues are presented in Table 3. Post hoc
com-parison revealed significant differences be-tween illiterates and groups 3 and 4 (>8 years of schooling), with P value of 0.0003 and 0.00007, respectively. Similarly, there was a difference between groups 1 and 2 (1 to 8 years of education) and groups 3 and 4 (>8 years). No difference was observed be-tween groups 3 (9 to 11 years) and 4 (>11 years of education), or between illiterate subjects and group 1 (1 to 4 years) and group 2 (5 to 8 years). Similar results were encoun-tered in post hoc analysis of number of cat-egories, and switching between categories. A statistically significant difference in ver-bal fluency was observed between groups with less and more than 8 years of education.
Interval analysis
The number of animals mentioned dur-ing each 15-s interval decreased with time (Table 3). This effect occurred in all educa-tion groups. The scores differed significant-ly between intervals in individual educa-tional groups: χ2 = 54.290, P < 0.00001, for
illiterates; χ2 = 179.341, P < 0.00001, for
group 1; χ2 = 97.86, P < 0.00001, for group
2; χ2 = 58.178, P < 0.00001, for group 3; χ2
= 29.407, P < 0.00001, for group 4.
Prototype examples
The animals most frequently mentioned Table 2. Comparison between male and female subjects in the verbal fluency
meas-ures.
Females Males
Mean (SD) Median Mean (SD) Median
Verbal fluency (total) 13.5 (3.73) 13 14.0 (4.76) 14 Interval 1 5.87 (1.79) 6 5.69 (1.94) 6 Interval 2 3.14 (1.42) 3 3.62 (1.79)* 4 Interval 3 2.51 (1.51) 2 2.57 (1.76) 2 Interval 4 1.97 (1.34) 2 2.10 (1.60) 2 Cluster 1.81 (0.92) 2 1.84 (0.96) 2 Category 3.18 (0.98) 3 3.13 (1.11) 3 Switching 4.70 (2.42) 5 4.56 (2.69) 4
*P < 0.05 compared to females for interval 2 (Student t-test).
Table 3. Effect of education on the scores achieved in the verbal fluency measures.
Illiterates Group 1 (1-4 years Group 2 (5-8 years Group 3 (9-11 years Group 4 (more than F(4,249) P value of schooling) of schooling) of schooling) 11 years of schooling)
Total 12.1 (3.0) 12.3 (3.1) 14.0 (3.8) 16.7 (4.2) 17.8 (6.6) 15.98 <0.00001 Interval 1 5.4 (1.5) 5.3 (1.6) 6.0 (2.1) 6.8 (1.9) 6.5 (1.9) 6.46 0.00006 Interval 2 2.8 (1.4) 3.1 (1.4) 3.4 (1.6) 3.7 (1.8) 4.3 (2.1) 3.58 0.0074 Interval 3 2.3 (1.3) 2.2 (1.4) 2.4 (1.5) 3.5 (1.7) 3.8 (2.0) 8.30 <0.00001 Interval 4 1.7 (1.2) 1.7 (1.3) 2.1 (1.4) 2.6 (1.5) 3.1 (1.9) 6.33 0.00007 Number of clusters 1.7 (0.7) 1.7 (0.8) 1.8 (1.1) 1.8 (0.9) 2.2 (1.4) 1.13 0.3411 Number of categories 2.8 (0.8) 2.9 (0.9) 3.2 (0.8) 3.9 (1.1) 3.9 (1.2) 11.68 <0.00001 Number of switching 3.6 (2.1) 4.0 (2.3) 4.7 (2.2) 6.1 (2.2) 7.0 (3.4) 11.77 <0.00001
were: dog (33%), cat (15.2%) and horse (13.2%). However, the frequencies of ani-mals mentioned were different between edu-cational groups: for illiterates, horse (35.5%) and dog (32.2%); for group 1, dog (31.1%) and cat (14.1%); for group 2, dog (37.1%) and cat (21%); for group 3: dog (37.8%) and lion (13.5%); for group 4: dog (27.8%) and cat (22.2%). Therefore, illiterates did not mention the same prototypical animal as the other groups. However, the dog was the animal most often mentioned as the first specimen when data were analyzed accord-ing to age group and gender.
Discussion
In the present study, animal fluency was associated with education, but not with age and gender. Male subjects generated slightly more items than females in terms of total scores and intervals 2, 3, 4, and in terms of number of clusters, with significance only in generation between 15 and 30 s. Similar findings were reported by Kempler et al. (21), in whose study men performed better than women. However, other studies have presented better performance by women in verbal fluency (14,20,23,28). Nevertheless, we failed to find a gender effect, as did our previous survey (24). Other studies have not found a gender effect, especially when re-sults by gender were corrected for educa-tional level (29).
The present survey is the first publication of qualitative data obtained with Portuguese-speaking Brazilian subjects. Reis and Castro-Caldas (30) reported similar findings regard-ing educational level in a study on the perfor-mance of illiterate women from a seaside community in Portugal. In the study by Reis and Castro-Caldas, given the same cultural, social, and economic environments, women without education performed worse in both phonemic and category fluency, thus show-ing that the achievement of illiterates, even at the semantic level, is worse than that of
literate individuals, in agreement with the results of the present study, which included males in the analysis.
Clustering and switching had never been described before in Brazil, except in a pres-entation by Caramelli et al. (31), which re-ported similar results, with subjects with more than 8 years of education performing better than illiterates, producing more items and clusters. Also noteworthy is the fact that our literate subjects did not outperform illit-erates in clustering. We observed a global poverty of cluster production, with greater changing and numbers of categories among more educated people. We could not prove that these individuals generated more items in each subcategory until exhausting it be-fore changing to another. Our results cate that even though more educated indi-viduals retrieve words systematically by searching for subcategories, they do not pro-duce clusters.
Ratcliff et al. (19) observed a greater effect of education on initial sound fluency than on category fluency, although scores for animal and fruit fluency were also influ-enced by education. They emphasized the need for care when devising test batteries for use in different settings, and when interpret-ing results obtained from different subject groups.
edu-cated subjects showed a more limited pro-duction in all measures, except for cluster-ing, meaning that mental screening is poorer among individuals with less schooling. Kempler et al. (21) and Acevedo et al. (23) detected the influence of age and education in their studies.
Category fluency requires the systematic retrieval of hierarchically organized infor-mation from semantic memory, and content analysis of the verbal fluency performance of normal subjects has provided valuable insights into the structural organization of semantic categories. Apparently educational level facilitates this semantic access, seem-ingly enlarging the possibilities of repertoire of categories. This effect is more pronounced when comparing greatly differing educational levels, such as illiterates and subjects with lower educational levels, in contrast to those with more than 8 years of education, as demonstrated our results. Other studies have found similar performance, albeit in differ-ent languages: English, Spanish, Chinese, and Vietnamese (21,22,32). When perform-ing any category fluency task, it is essential to access semantic stores: activation of an initial, and highly prototypical specimen leads to automatic activation of closely related semantic neighbors. If automatic activation fails, subjects can also use more active search strategies (33). Analogous findings were pre-sented by other investigators related to inter-val production, with a decline over time. Maximal word retrieval occurred during the first 15 s for all subjects in both studies (34).
In a previous study, we observed the absence of a prototype specimen when analyzing subjects according to schooling and environ-ment (35). The study in question revealed that illiterates mentioned the horse (41%) as a prototype animal in an urban environment while non-illiterates more often mentioned the dog (38%). It is worth noting that illiter-ates and non-illiterilliter-ates in rural communities mentioned the jaguar (24.4%) and monkey (26%), respectively. The environment, be-sides education, appears to influence the animals named in that, as a rule, city samples mentioned a dog while rainforest communi-ties mentioned a jaguar. In the present study, dog was the prototype specimen, except among illiterates. Moreover, we subscribe to the view that higher education leads to the retrieval of more animal types, whereas in illiterates the distribution of animals was poor, with the dog being generated as the first specimen by 32.2% of subjects and the horse by 35.5 and 60% of subjects. We believe that education influences semantic access to information, and this hypothesis has been corroborated by these two studies (Ref. 35 and present study).
These findings are important to gain a better understanding of cognitive functions in lower performance as a result of insuffi-cient education in our population. More stud-ies are needed to compare different Portu-guese-speaking populations with respect to knowledge concerning patterns of semantic memory and executive functions in our envi-ronment.
References
1. Miller E (1984). Verbal fluency as a function of a measure of verbal intelligence and in relation to different types of cerebral pathology.
British Journal of Clinical Psychology, 8: 385-394.
2. Vilkki J & Holst P (1994). Speed and flexibility on word fluency tasks after focal brain lesions. Neuropsychologia, 32: 1257-1262. 3. Troyer AK, Moscovitch M, Winocur G, Alexander MP & Stuss D
(1998). Clustering and switching on verbal fluency: the effects of focal frontal- and temporal-lobe lesions. Neuropsychologia, 36: 499-504.
4. Gurd JM, Ward CD & Hodges J (1990). Parkinson’s disease and the frontal hypothesis: task alternation in verbal fluency. Advances in Neurology, 53: 321-325.
5. Chaikelson JS & Schwartzman AE (1983). Cognitive changes with aging in schizophrenia. Journal of Clinical Psychology, 39: 25-30. 6. Allen HA, Liddle PF & Frith CD (1993). Negative features, retrieval
processes and verbal fluency in schizophrenia. British Journal of Psychiatry, 163: 769-775.
of search and knowledge. Archives of Gerontology and Geriatrics, 4: 231-239.
8. Brown RG & Marsden CD (1988). Subcortical dementia: the neuro-psychological evidence. Neuroscience, 25: 363-387.
9. Morris JC, Heyman A, Mohs RC, Hughes JP, vanBelle G, Fillenbaum G, Mellits ED, Clark C & CERAD Investigators (1989). The consor-tium to establish a registry for Alzheimer’s disease (CERAD). Part I. Clinical and neuropsychological assessment of Alzheimer’s dis-ease. Neurology, 39: 1159-1165.
10. Welsh KA, Butters N, Hughes JP, Mohs RC & Heyman A (1992). Detection and staging of dementia in Alzheimer’s disease with use of the neuropsychological measures developed for the consortium to establish a registry for Alzheimer’s disease. Archives of Neurol-ogy, 49: 448-452.
11. Salmon DP, Jin H, Zhang M, Grant I & Yu E (1995). Neuropsycho-logical assessment of Chinese elderly in the Shanghai dementia survey. Clinical Neuropsychologist, 9: 159-168.
12. Solomon PR, Hirschoff A, Kelly B, Relin M, Brush M, DeVeaux RD & Pendlebury WW (1998). A seven minute neurocognitive screening battery highly sensitive to Alzheimer’s disease. Archives of Neurol-ogy, 55: 349-355.
13. Eslinger PJ, Damasio AR, Benton AL & Van Allen M (1985). Neuro-psychological detection of abnormal mental decline in older per-sons. Journal of the American Medical Association, 253: 670-674. 14. Monsch AU, Bondi MW, Butters N, Salmon D, Katzman R & Thal LJ
(1992). Comparisons of verbal fluency tasks in the detection of dementia of the Alzheimer type. Archives of Neurology, 49: 1253-1258.
15. Taussig IM, Henderson VW & Mack W (1992). Spanish translation and validation of a neuropsychological battery: performance of Span-ish- and EnglSpan-ish-speaking Alzheimer’s disease patients and normal comparison subjects. Clinical Gerontologist, 2: 95-107.
16. Brucki SMDB, Rocha MSG & Lima UWP (2002). Verbal fluency tests in early Alzheimer’s disease patients. Arquivos de Neuropsi-quiatria, 60 (Suppl 1): 427 (Abstract).
17. Rosselli M & Ardila A (1990). Neuropsychological assessment in illiterates. II. Language and praxis abilities. Brain Cognition, 12: 281-296.
18. Ganguli M, Ratcliff G & Huff FJ (1991). Effect of age, gender and education on cognitive test in a rural elderly community sample: norms from Monongahela independent elderly survey. Neuroepide-miology, 10: 42-52.
19. Ratcliff G, Ganguli M, Chandra V, Sharma S, Belle S, Seaberg E & Pandav R (1998). Effects of literacy and education on measures of word fluency. Brain and Language, 61: 115-122.
20. Carnero C, Lendínez A, Maestre J & Zunzunegui MV (1999). Seman-tic verbal fluency in neurological patients without dementia with a low educational level. Revista de Neurologia, 28: 858-862. 21. Kempler D, Teng EL, Dick M, Taussig M & Davis DS (1998). The
effects of age, education, and ethnicity on verbal fluency. Journal of
the International Neuropsychological Society, 4: 531-538. 22. Ostrosky-Solis F, Ardila A & Roselli M (1999). NEUROPSI: a brief
neuropsychological test battery in Spanish with norms by age and educational level. Journal of the International Neuropsychological Society, 5: 413-433.
23. Acevedo A, Loewenstein DA, Barker WW, Harwood DG, Luis C, Bravo M, Hurwitz DA, Aguero H, Greenfield L & Duara R (2000). Category fluency test: normative data for English- and Spanish-speaking elderly. Journal of the International Neuropsychological Society, 6: 760-769.
24. Brucki SMD, Malheiros SMF, Okamoto IH & Bertolucci PHF (1997). Dados normativos para o uso do teste de fluência verbal em nosso meio. Arquivos de Neuropsiquiatria, 55: 56-61.
25. Brucki SMD, Malheiros SMF, Okamoto IH & Bertolucci PHF (1998). Verbal fluency test performance and educational levels. Neurobiol-ogy of Aging, 19 (Suppl 4): S12 (Abstract).
26. Nitrini R, Lefévre BH, Mathias SC et al. (1994). Neuropsychological tests of simple application for diagnosing dementia. Arquivos de Neuropsiquiatria, 52: 457-465.
27. Bertolucci PHF, Brucki SMD, Campacci SR & Juliano I (1994). Mini-exame do estado mental em uma população geral: impacto da escolaridade. Arquivos de Neuropsiquiatria, 52: 1-7.
28. Crossley M, D’Arcy C & Rawson SB (1997). Letter and category fluency in community-dwelling Canadian seniors: a comparison of normal participants to those with dementia of the Alzheimer or vascular type. Journal of Clinical and Experimental Neuropsychol-ogy, 19: 52-62.
29. Chan AS & Poon MW (1999). Performance of 7- to 95-year-old individuals in a Chinese version of the category fluency test. Journal of the International Neuropsychological Society, 5: 525-533. 30. Reis A & Castro-Caldas A (1997). Illiteracy: a cause for biased
cognitive development. Journal of the International Neuropsycho-logical Society, 3: 444-450.
31. Caramelli P, Carthery MT, Porto CS, Charchat-Fichman H, Bahia VS & Nitrini R (2001). Qualitative analysis of verbal fluency in normal aging and Alzheimer’s disease: effects of educational background.
Arquivos de Neuropsiquiatria, 59 (Suppl 3): 18 (Abstract).
32. Bolla KI, Gray S, Resnick SM, Galante R & Kawas C (1998). Category and letter fluency in highly educated older adults. Clinical Neuropsy-chology, 12: 330-338.
33. Rosser A & Hodges JR (1994). Initial letter and semantic category fluency in Alzheimer’s disease, Huntington’s disease, and progres-sive supranuclear palsy. Journal of Neurology, Neurosurgery and Psychiatry, 57: 1389-1394.
34. Adams ML, Reich AR & Flowers CR (1989). Verbal fluency charac-teristics of normal and aphasic speakers. Journal of Speech and Hearing Research, 32: 871-879.