ABSTRACT: Water management impacts both methane (CH4) and nitrous oxide (N2O) emissions from rice paddy fields. Although controlled irrigation is one of the most important tools for re-ducing CH4 emission in rice production systems it can also increase N2O emissions and reduce crop yields. Over three years, CH4 and N2O emissions were measured in a rice field in Uruguay under two different irrigation management systems, using static closed chambers: conventional water management (continuous flooding after 30 days of emergence, CF30); and an alternative system (controlled deficit irrigation allowing for wetting and drying, AWDI). AWDI showed mean cumulative CH4 emission values of 98.4 kg CH4 ha
−1, 55 % lower compared to CF30, while no differences in nitrous oxide emissions were observed between treatments (p > 0.05). No yield differences between irrigation systems were observed in two of the rice seasons (p > 0.05) while AWDI promoted yield reduction in one of the seasons (p < 0.05). When rice yield and green-house gases (GHG) emissions were considered together, the AWDI irrigation system allowed for lower yield-scaled total global warming potential (GWP). Higher irrigation water productivity was achieved under AWDI in two of the three rice seasons. These findings suggest that AWDI could be an option for reducing GHG emissions and increasing irrigation water productivity. However, AWDI may compromise grain yield in certain years, reflecting the importance of the need for fine tuning of this irrigation strategy and an assessment of the overall tradeoff between relationships in order to promote its adoption by farmers.
Keywords: greenhouse gases, emissions, methane, nitrous oxide, mitigation
as much as possible is considered an acceptable practice aimed at minimizing GHG emissions and increasing wa-ter productivity. However, this wawa-ter management system can induce crop water stress that can negatively affect the final rice yield (Dunn and Gaydon, 2011).
A large proportion of the world’s rice is grown under continuous anaerobic conditions; thus, there is a lack of reports regarding the integrated effects of GHG emissions, water consumption and productivity on di-rect-seeded, delayed-flood rice production systems.
Based on this, the aim of this study was to com-pare the effect of conventional water management with continuous flooding after 30 days of emergence (CF30) with an alternative system of controlled deficit irriga-tion allowing for wetting and drying (AWDI) on GHG emissions, water productivity, and paddy rice yields in Uruguay.
Materials and Methods
Site description
A three-year experiment was conducted over the following consecutive rice (Oryza sativa) growing sea-sons: 2010-2011; 2011-2012; and 2012-2013, from Oc-tober to March, in fields cultivated with a cultivar of indica origin, named El Paso 144, in the department of Treinta y Tres in the southeast of Uruguay, (33º14' S, 54º23' W, 21 m.a.s.l.). The soil was a Typic Argiudoll loamey clay. The main properties of the soil for the three rice growing seasons are described in Table 1.
1University of the Republic/College of Chemistry and Science − Dept. of Biosciences, General Flores 2124 − Montevideo – Uruguay.
2National Agricultural Research Institute, R. 8 km 281, C.P. 33000 −Treinta y Tres – Uruguay.
3University of the Republic/College of Agriculture − Dept. of Plant Biology, Garzón 809, C.P. 12900 − Montevideo – Uruguay.
*Corresponding author <[email protected]>
Edited by: Axel Garcia y Garcia
Yield-scaled global warming potential of two irrigation management systems in a
Silvana Tarlera1*, María Cristina Capurro2, Pilar Irisarri3, Ana Fernández Scavino1, Guillermina Cantou2, Alvaro Roel2
Received February 06, 2015
Accepted June 05, 2015
highly productive rice system
Introduction
Methane (CH4)is the dominant greenhouse gas (GHG) produced in irrigated paddy rice fields, contribut-ing approximately 15-20 % to annual global CH4 emis-sions (Jacobson, 2005; Hadi et al., 2010). Flooded soils generate anaerobic conditions favoring the production of CH4 as an end product from organic matter degradation (Conrad, 2002). Water management is one of the most important tools for achieving high levels of production as well as a promising option for themitigation of CH4. Changes in water management such as intermittent irri-gation and mid-season drainage are effective options for the mitigation of CH4 in rice fields (Hadi et al., 2010; Itoh et al., 2011; Jain et al., 2013; Minamikawa and Sakai, 2006; Tyagi et al., 2010; Yagi et al., 1997). However, these practices of alternate anaerobic and aerobic cycling can stimulate the emission of another GHG, nitrous oxide (N2O), via denitrification and nitrification, respectively. Therefore, an optimum emission trade-off that minimiz-es emissions of both gasminimiz-es is highly dminimiz-esirable (Itoh et al., 2011; Zou et al., 2005). Furthermore, drainage systems are also important for conserving water and improving rice yields (Xu et al., 2007).
In Uruguay, rice yields are among the highest in the world, averaging 8000 kg ha−1. Any alternative water
44
Tarlera et al. Greenhouse gases emissions in rice
Crop (1-2 years of rice) - pasture (3-4 years) rota-tions have been the predominant cropping system in Uruguay since the 1960s. This rotational system main-tains or increases fertility and thus allows for up to 70 kg N ha−1 to be deployed which might, in turn, result
in lower N2O emissions (García-Préchac et al., 2004). In this study, rice was seeded at a density of 150 kg ha−1
after a three-year pasture.
Daily mean air temperature (measurements were taken at 9 a.m., 3 p.m. and 9 p.m.between 20 days be-fore and 20 days after 50 % flowering) was 23 °C over the three seasons studied. The mean air temperature and daily rainfall in the three seasons are shown in Figures 1A and 1B, respectively.
Experimental layout
A complete randomized block design was used with two irrigation treatments in triplicate for three con-secutive growing seasons. The two irrigation treatments were conventional water management (CF30) and an
al-ternative controlled irrigation system (AWDI). CF30 con-sisted of a continuous flooding treatment applied 30 days after plant emergence and a 10-cm water layer above the soil surface, maintained during the rest of the growing season until final drainage. This water management sys-tem is the one most frequently employed by Uruguayan rice producers. AWDI consisted of alternate wetting and drying irrigation where irrigation was given only at a certain number of days, after the soil had reached 50 % depletion of the water available in the root zone. This treatment also started at 30 days after plant emergence (DAE) and continued until the panicle initiation stage, around 70 DAE. At this stage, the plots were flooded with a 10-cm water layer similar to the CF30 system (Figure 2). Both treatments were direct-seeded and occasionally flushed during the first 30 days to prevent severe water stress depending on rainfall conditions. For both treat-ments, the irrigation end-point was set at 15 days after 50 % of flowering and plots were drained 15 days before harvesting. Each plot of 66 m2 had an independent
ir-rigation inlet where water inflow was measured using a water flow meter to record the amount of water used for irrigation.
Details of crop management activities are provid-ed in Table 2.
Gas sampling and flux measurement
CH4 and N2O emissions were monitored using the static closed chamber technique as described for rice by
Table 1 − Soil properties for the three rice growing seasons (October-March) in Treinta y Tres, Uruguay.
Season pH (H2O) Organic matter P Bray Available K
% µg g−1 meq 100 g−1
1 6.0 2 5.0 0.12
2 5.5 2 5.0 0.18
3 6.3 2 2.2 0.16
Butterbach-Bahl et al. (2015). The assembly consisted of permanently installed stainless steel bases, 40 cm in di-ameter and 20 cm in height that were left in the place inserted 10 cm into the soil and enclosing approximately 12-14 rice plants. At each sampling date, acrylic boxes of 60 cm in height were placed on the bases and a water-seal was established to provide air-tight conditions. The cham-ber was equipped with a battery-operated circulating fan which was turned on 5 min before measurements to en-sure complete gas mixing and a device to equilibrate pres-sure between the inside and the outside of the chamber. Gas samples from the chamber headspace were drawn using 25 mL plastic syringes at 0, 30 and 60 min for CH4 and at 0, 15 and 30 min for N2O, carefully flushing the syringe three times before two replicates were stored in evacuated 12-mL glass vials with screw caps and septum until analysis. Two chambers were installed in each plot. Chamber temperature, floodwater depths and headspace
heights were recorded and used to calculate gas flux rates from the soil surface to the chamber atmosphere assum-ing a linear increase in gas concentration over time. The frequency of flux measurements was generally every seven days which has been determined to be an accu-rate approach for estimating seasonal CH4 emissions from rice systems (Minamikawa et al., 2012). Gas flux mea-surements were taken between 10h00 and 11h30 a.m., as recommended by Minamikawa et al. (2012). The CH4 concentrations were analyzed on a GC-2014 gas chro-matograph (Shimadzu Scientific) with a Porapak Q col-umn equipped with an FID (flame ionization) detector. The N2O analysis was carried out on a gas chromatograph with an electronic capture detector (ECD), as described in Perdomo et al. (2009).
Overall gas emissions during the cropping season (from plant emergence to harvest) were calculated by integrating the fluxes over time. Seasonal CH4 and N2O
Figure 2 − Schematic of the rice crop cycle and irrigation treatments; CF30 = continuous flooding after 30 days of emergence; AWDI = controlled deficit irrigation allowing wetting and drying.
Table 2 − Seasonal sequence of rice crop management events during the three seasons in Treinta y Tres, Uruguay..
Crop management Season 1 Season 2 Season 3
DAE DAE DAE
Planting and fertilization (16 kg ha−1 N, 66 kg ha−1 P
2O5, 18 kg ha −1 K
2O) -33 -18 -15
Plant emergence 0
(10/11/2010)
0 (09/11/2001)
0 (03/11/2012)
Herbicide application -11 and 9 -10 and 13 9 and 26
Fertilization at tillering (60 kg urea ha−1)1 33 30 30
Fertilization at panicle initiation (50 kg urea ha−1) CF30: 54 CF: 58 CF:55
AWDI: 64 AWDI: 72 AWDI: 65
Flooding CF30: 33 CF30: 30 CF30: 30
AWDI: 64 AWDI: 72 AWDI: 65
46
Tarlera et al. Greenhouse gases emissions in rice
Mixed Model. Irrigation treatment by cropping season interaction was considered a fixed-effect, while blocks and cropping season were included as random effects. If a significant interaction per cropping season was pres-ent, an analysis by cropping season was conducted to detect differences between treatments. The level of sig-nificance was determined as p < 0.05.
Results and Discussion
Water use and water productivity
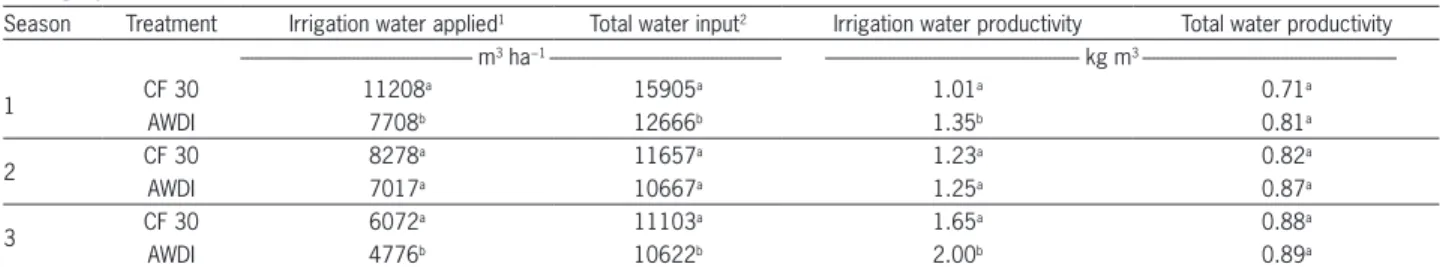
Table 3 shows variations in water consumption and water productivity. Significantly lower amounts of irrigation water were used in AWDI for seasons 1 and 3 (2010-2011 and 2012-2013). Season 3 required less amounts of irrigations during the period between plant-ing and final floodplant-ing due to regular rainfall. Season 1 was characterized by a shortage of rainy days during the above-mentioned period with the intermediate occur-rence of an event of heavy rainfall (above 60 mm), while the rainfall pattern in season 2 was of a more irregular nature, no rainfall after seeding followed by some days of rain.
Seasonal patterns of CH4 emissions
For all years and irrigation treatments, a similar seasonal CH4 emission pattern was observed (Figure 3A and 3B). CH4 emission increased gradually over time af-ter flooding and reached an expressive peak in the late reproductive stage of the crop (before and around flow-ering in CF30 and around and after flowflow-ering in AWDI) after which emissions gradually declined until field drainage or harvesting. An exception to this behavior was observed in the 2010-2011 season for CF30 where a significant drop in CH4 emission was recorded around 98 DAE. The highest CH4 emission rates for CF30 ranged from 3948 to 4766 g ha−1 d−1, significantly higher (p =
0.0016) than for AWDI, which ranged from 2105 to 3189 g ha−1 d−1 (Figure 3A and 3B). After the beginning of
the flooding, CH4 emissions achieved a peak between seven and nine weeks after flooding in CF30 and around six weeks after flooding in AWDI. Total CH4 emissions during the cropping period from CF30 were 208.2, 249.4 and 248.8 kg CH4 ha−1 and from AWDI were 93.3,
were estimated by adding all mass flux values for the ex-perimental period. The net gas mass flux between the two measurement dates was calculated taking the mean flux values of the two dates multiplied by the number of days between these dates (Bowden et al., 1990). Total Global Warming Potential (GWP) was calculated in terms of CO2 equivalents (CO2 eq) over a 100-year time horizon using a radiative forcing potential of 298 for N2O and 25 for CH4 (Solomon et al., 2007). Yield-scaled GWP refers to GWP divided by grain yield in order to determine an agricul-tural efficiency value (Groenigen et al., 2010).
Soil and plant measurements
Water applied in the rice field under AWDI was based on cumulative crop evapotranspiration (ETm). The Penman-Monteith equation (FAO 56PM – Allen et al., 1998) was used to estimate potential evapotranspira-tion (ETo). The ETm was calculated multiplying ETo by an initial corrected crop coefficient value for rice (Kc)of 0.8 and a medium value of 1.2. Irrigation water was ap-plied when cumulative ETm was equal to 50 % depletion of the available water in the root zone. Precipitation data was registered at a meteorological station located at the experimental field and the soil water content was mea-sured hourly every day in situ using a frequency domain reflectometry device (FDR), Decagon EC5, with 5-cm rod length, at a soil depth of 0-10. Irrigation water pro-ductivity and total water propro-ductivity were estimated by dividing the grain yield by irrigation water applied and by rainfall plus irrigation water applied, respectively.
Redox potential was measured weekly during 2012-13 season, using a Horiba D-52 manual platinum electrode which performs instantaneous value measure-ments. The measurements were taken between rows with a 10 cm depth and five replicates for each plot. Rice yields were assessed by crop-cut sampling in each plot using a 3 × 2 m sampling frame. Reported grain yield refers to the weight of rough rice adjusted to 14 % grain moisture content.
Statistical analysis
Differences for seasonal cumulative CH4 and N2O emissions, GWP, grain yield, and yield-scaled GWP were compared between irrigation treatments using a linear
Table 3 – Rice crop water consumption and productivity for the three seasons and for the two irrigation systems evaluated, in Treinta y Tres, Uruguay.
Season Treatment Irrigation water applied1 Total water input2 Irrigation water productivity Total water productivity --- m3 ha−1 --- --- kg m3
---1 CF 30 11208
a 15905a 1.01a 0.71a
AWDI 7708b 12666b 1.35b 0.81a
2 CF 30 8278
a 11657a 1.23a 0.82a
AWDI 7017a 10667a 1.25a 0.87a
3 CF 30 6072
a 11103a 1.65a 0.88a
AWDI 4776b 10622b 2.00b 0.89a
On the other hand, Eh values for AWDI gradually decreased to 100 mV until 46 DAE. This was followed by transient increases and decreases in the redox potential during intermittent drainage until the field was continu-ously flooded with standing water and Eh values turned negative (Figure 4). This soil Eh fluctuation between 10 and 70 DAE corresponds with the minimal CH4 flux de-tected in AWDI fields. This is expected because the soil Eh did not decline in this period to within an appropri-ate range favorable for the activity of methanogens. As a consequence, CH4 emission from AWDI was delayed com-pared to CF30. Soil water content variations reflected soil redox potential fluctuations (data not shown). As many previous studies have reported, the seasonal gradual CH4 emission pattern has been ascribed to the progressive development of anaerobic soil conditions during flood-ing, reaching a maximum around flowering due to the higher availability of substrates in the rice rhizosphere for methanogens responsible for CH4 production and fol-lowed by a decrease in CH4 efflux at the ripening stage of the crop due to reduced photosynthetic activity (Mi-tra et al., 2005; Pittelkow et al., 2013; Towprayoon et al., 2000; Wassmann et al., 2002). The absence of an emission peak early in the cultivation season in this study could be 106.3 and 95.7 kg CH4 ha−1 (Table 4). Significantly lower
fluxes were observed in season two and in season three for AWDI, accounting for a 57 and 62 % reduction, re-spectively (Table 4). Even considering only the period when both irrigation treatments were flooded (from pan-icle initiation to drainage), the fluxes were significantly higher for CF30. Our estimates are consistent over the three seasons and comparable to previously published rates from rice fields from temperate countries. Reports from continuously irrigated systems include the follow-ing values of kg CH4 ha−1: 634 (Hadi et al., 2010); 250
(Cicerone et al., 1992); 112-404 (Schütz et al., 1989); 200-500 (Gutierrez et al., 2013) from Japan, California, Italy and South Korea, respectively. Two continuously ir-rigated systems (direct-seeded, delayed flood) similar to ours have reported values of 270 kg CH4 ha−1 (Rogers et
al., 2012) and 340-423 kg CH4 ha−1 (Moterle et al., 2013)
from rice fields in Arkansas, USA, and southern Brazil, respectively.
Soil redox potential (Eh) was measured in the third year of the experiment. This parameter showed a differ-ent pattern under both water treatmdiffer-ents (Figure 4). In CF30, soil redox potential was above + 300 mV before flooding and then decreased sharply to a level of -100 mV within about 30 days after flooding (Figure 4).
Figure 3 − Evolution of CH4 fluxes in the three rice crop seasons for the two irrigation treatments; A) CF30 (continuous flooding after 30 days of emergence); B) AWDI (controlled deficit irrigation allowing wetting and drying); Points are average fluxes and error bars represent the standard error of six replicates; DAE = days after emergence; Dates of tillering (T), panicle initiation (PI), flowering (F), drainage (D) and harvesting (H) are indicated.
Table 4
−
Seasonal CH4 and N2O emissions and rice grain yield for two irrigation systems and three seasons, in Treinta y Tres, Uruguay.Season Treatment CH4
1 N
2O
2 Grain yield --- kg ha−1
---1 CF30 208.2
a 0.3 11171a
AWDI 93.3a 0.4 10170a
2 CF30 249.4
a 1.0 10387a
AWDI 106.3b 1.2 8700b
3 CF30 248.8
a 0.6 9803a
AWDI 95.7b 1.9 8992a
1As interaction between season and treatment was significant, the analysis was performed by season; Different letters indicate differences between treatments (p < 0.05); 2Seasonal N
2O emissions were not different (p > 0.05); CF30 = continuous flooding after 30 days of emergence; AWDI = controlled deficit irrigation allowing wetting and drying.
48
Tarlera et al. Greenhouse gases emissions in rice
due to either the lack of organic amendment which has been reported to enhance CH4 emission or to inadequate conditions for anaerobic methanogenesis during the 30-day delayed flooding due to posterior non-flooded fallow conditions (Itoh et al., 2011; Watanabe et al., 1999; Zhang et al., 2011). Alternate wet-dry conditions delayed the on-set of CH4 emission as compared to continuously flooded plots. This pattern of a retarded initiation of CH4 emis-sion has also been observed in mid-season and multiple drainage treatments (Itoh et al., 2011; Towprayoon et al., 2005; Tyagi et al., 2010). This decrease can be ascribed to temporary soil aeration generated due to partial drying of the soil that in turn suppresses methanogenic activity and may increase aerobic methanotrophic activity.
Seasonal patterns of N2O emissions
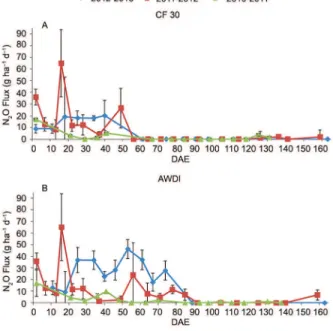
Figures 5A and 5B shows the pattern of N2O emis-sion for both irrigation treatments in the three crop sea-sons. There was no clear seasonal pattern of N2O emis-sion, either for the different seasons or treatments. Until 30 DAE when CF30 was flooded, the two irrigation treat-ments behaved similarly and one or two peaks of N2O fluxes were registered in all the seasons. These peaks of N2O fluxes prior to permanent flooding could not be cor-related with rain events but the highest flux peaked after flushing in season 2011-2012 (65 g N2O ha−1 d−1).
In AWDI, N2O fluxes were detected until 90 DAE while in CF30 only until 60 DAE. The dry-wet alterna-tion created a favorable environment for both nitrifi-cation and denitrifinitrifi-cation processes and probably en-hanced soil available C released from organic matter and consequently denitrification activity that is mainly heterotrophic (Zou et al., 2007). The period when N2O fluxes were registered was longer in AWDI while CH4, on the contrary, was emitted during a shorter lapse in AWDI than in CF30 (Figures 3 and 5).
Once soils are waterlogged and negative redox po-tential values are reached (Figure 4), thermodynamics determines the sequential reduction of inorganic elec-tron acceptors present such as nitrate, sulfate and iron (III) after which CH4 production is initiated (Conrad, 2002; Kögel-Knaber et al., 2010). Therefore, N2O emis-sions are not expected to occur under these anaerobic soil conditions that prevent nitrification and promote methanogenesis (Figures 3 and 5).
N2O seasonal emissions were not significantly dif-ferent under either treatment (Table 4). The sporadic behavior of N2O fluxes has been acknowledged previ-ously in different agricultural soils including rice sys-tems (Perdomo et al., 2009; Pittelkow et al., 2013; Zhao et al., 2011). Numerous factors are involved in control-ling N2O emissions from soils, which contribute to the huge spatiotemporal variation in emissions in field trials. As a consequence of the spatiotemporal variation, it has been reported that the power of statistical tests of such experiments is low (Bakken et al., 2012).
Soil moisture conditions and fertilizer manage-ment practices are the main factors that determine
N2O emissions from paddy soils (Guo and Zhou, 2007). However, in our experiment the peaks of N2O were not related to N-fertilizer application (Figure 5A and B). Al-though excess fertilizer N doses result in high emissions, N2O emissions correlate poorly with the N fertilizer ap-plied when they are within realistic ranges (Bakken et al., 2012). The demand-driven N supply minimizes the pool of excessive nitrogen in the soil and thus, reduces N2O emissions. At tillering the rice crop was actively growing and consequently the amount of soil mineral N left for losses was reduced. Total N-fertilizer recov-ery in rice plants was 40 % when the fertilizer was split versus a single dose application (20 %) in the same rice field of this experiment (Irisarri et al., 2007). An inverse relationship between N2O emission and N use efficien-cy had been clearly established previously (Dalal et al., 2003). The split fertilization used in this study, which is the recommended method of application for this crop in Uruguay, probably increased N use efficiency.
Global warming potential in relation to irrigation systems
When CH4 and N2O emissions are expressed as CO2 equivalents, AWDI lowered GWP to 54 % (Table 5). The major contributor to GWP in CF30 and AWDI was CH4 which represented above 96 % and between 95 and 81 % of total GWP across years, respectively (Table 5). This is in agreement with previous reports on paddy soils that have shown that N2O emissions contribute much less to GWP than CH4 (Itoh et al., 2011; Pittelkow et al., 2013). It has also been reported that simultane-ous minimization of both CH4 and N2O emissions cannot be maintained due to redox potential changes (Johnson-Beebout et al., 2009).
In addition to concern over CH4 emissions from rice fields, rice productivity needs also to be consid-ered. Uruguayan rice yields are among the highest in the world and any change in water management strat-egy must make sure that this highly productive system is not negatively affected. As shown in Table 3, despite the fact that only in season 2 was the AWDI rice yield significantly lower in comparison to CF30; yield levels of AWDI were always lower. Yield-scaled GWP (Table 5) showed a reduction close to 50 % for AWDI vs. CF30 thus indicating a potential treatment for rice GHG miti-gation.
Conclusions
The results of this study are among the first to report GWP and yield-scaled GWP for two irrigation treatments in a dry-seeded, highly productive rice sys-tem and underpin the importance of water-management strategies for the simultaneous achievement of high yields, efficient water use and contribution to global ag-ricultural GHG mitigation.
grain yield, mainly in dryer seasons. Therefore, further AWDI irrigation strategies with less restrictive thresh-olds, (e.g. start of irrigation before reaching 50 % deple-tion of available water) should be explored in order to avoid yield penalties. In addition, the overall tradeoffs between productivity, GWP emissions, and water use should be assessed in order to provide rice farmers with decision tools for the adoption of alternative irrigations systems.
Acknowledgements
S. Riccetto, I. Furtado, M. Oxley for soil and gas sampling. A. Martínez, F. Franco, S. Latorre and L. Pinelli for helping with chromatographic analy-ses. We also thank L. Gutierrez for statistical as-sistance.
References
Bakken, L.R.; Bergaust, L.; Liu, B.; Frostegård, Å. 2012. Regulation of denitrification at the cellular level: a clue to the understanding of N2O emissions from soils. Philosophical Transactions of the Royal Society B: Biological Sciences 367: 1226-1234.
Bowden, R.D.; Melillo, J.M.; Steudler, P.A.; Aber, J.D. 1990. Annual nitrous oxide fluxes from temperate forest soils in the northeastern United States. Journal of Geophysical Research 95: 13997-14005.
Butterbach-Bahl, K.; Sander, B.O.; Pelster, D.; Díaz-Penés, E. 2015. Quantifying greenhouse gas emissions from managed and natural soils. Available at: http://www.samples.ccafs.cgiar. org/soil-fluxes.html [Accessed Jun. 19, 2015]
Cicerone, R.J.; Delwiche, C.C.; Tyler, S.C.; Zimmerman, P.R. 1992. Methane emissions from California rice paddies with varied treatments. Global Biogeochemical Cycles 6: 233-248. Conrad, R. 2002. Control of microbial methane production in
wetland rice fields. Nutrient Cycling in Agroecosystems 64: 59-69.
Dalal, R.C.; Wang, W.; Robertson, G.P.; Parton, W. 2003. Nitrous oxide emission from Australian agricultural lands and mitigation options: a review. Australian Journal of Soil Research 41: 165-195.
Dunn, B.W.; Gaydon, D.S. 2011. Rice growth, yield and water productivity responses to irrigation scheduling prior to the delayed application of continuous flooding in South East Australia. Agricultural Water Management 98: 1799-1807. García-Préchac, F.; Ernst, O.; Siri-Prieto, G.; Terra, J.A. 2004.
Integrating no-till into crop-pasture rotations in Uruguay. Soil and Tillage Research 77: 1-13.
Groenigen, J.W. van; Velthof, G.L.; Oenema, O.; Groenigen, K.J. van; Kessel, C. van 2010. Towards an agronomic assessment of N2Oemissions: a case study for arable crops. European Journal of Soil Science 61: 909-913.
Guo, J.; Zhou, C. 2007. Greenhouse gas emissions and mitigation measures in Chinese agroecosystems. Agriculture and Forest Meteorology 142: 270-277.
Gutierrez, J.; Kim, S.Y.; Kim, P.J. 2013. Effect of rice cultivar on CH4 emissions and productivity in Korean paddy soil. Fields Crop Research 146: 16-24.
Hadi, A.; Inubishi, K.; Yagi, K. 2010. Effect of water management on greenhouse gas emissions and microbial properties of paddy soils in Japan and Indonesia. Paddy and Water Environment 8: 319-324.
Figure 5 − Evolution of N2O fluxes in the three rice seasons for the two irrigation systems; A) CF30 (continuous flooding after 30 days of emergence); B) AWDI (controlled deficit irrigation allowing wetting and drying); Points are average fluxes and error bars represent the standard error of six replicates. DAE= days after emergence.
Table 5 − Global Warming Potential (GWP) and Yield scaled GWP for the three rice seasons, in Treinta y Tres, Uruguay..
Season Treatment CH4 GWP N2O GWP GWP reduction Yield scaled GWP Yield scaled GWP reduction
--- kg CO2 eq ha
−1
---% kg CO2 eq kg grain yield
−1 %
1 CF 30 5205 81 0.47
AWDI 2333 110 54 0.24 49
2 CF 30 6234 288 0.63
AWDI 2658 347 54 0.35 45
3 CF 30 6219 193 0.65
AWDI 2392 578 54 0.33 49
50
Tarlera et al. Greenhouse gases emissions in rice
Irisarri, P.; Gonnet, S.; Deambrosi, E.; Monza, J. 2007. Cyanobacterial inoculation and nitrogen fertilization in rice. World Journal of Microbiology and Biotechnology 23: 237-242. Itoh, M.; Sudo, S.; Mori, S.; Saito, H.; Yoshida, T.; Shiratori, Y.;
Suga, S.; Yoshikawa, N.; Suzue, Y.; Mizukami, H.; Mochida, T.; Yagi, K. 2011. Mitigation of methane emissions from paddy fields by prolonging midseason drainage. Agricultural and Ecosystems Environment 141: 359-372.
Jacobson, M.Z. 2005. Atmospheric Pollution: History, Science and Regulation. Cambridge University Press, New York, NY, USA. Jain, N.; Dubey, R.; Dubey, D.S.; Singh, J.; Khanna, M.; Pathak,
H.; Bhatia, A. 2013. Mitigation of greenhouse gas emission with system of rice intensification in the Indo-Gangetic Plains. Paddy and Water Environment 12: 355-363.
Johnson-Beebout, S.E.; Angeles, O.R.; Alberto, M.C.R.; Buresh, R.J. 2009. Simultaneous minimization of nitrous oxide and methane emission from rice paddy soils is improbable due to redox potential changes with depth in a greenhouse experiment without plants. Geoderma 149: 45-53.
Kögel-Knaber, I.; Amelung, W.; Cao, Z.; Fiedler, S.; Frenzel, P.; Jahn, R.; Kalbitz, K.; Kölbl, A.; Schloter, M. 2010. Biogeochemistry of paddy soils. Geoderma 157: 1-14.
Minamikawa, K.; Sakai, N. 2006. The practical use of water management based on soil redox potential for decreasing methane emissions from a paddy field in Japan. Agricultural and Ecosystems Environment 116: 181-188.
Minamikawa, K.; Yagi, K.; Tokida, T.; Sander, B.O.; Wassmann, R. 2012. Appropriate frequency and time of day to measure methane emissions from an irrigated rice paddy in Japan using the manual closed chamber method. Greenhouse Gas Measurement and Management 2: 118-128.
Mitra, S.; Aulakh, M.S.; Wassmann, R.; Olk, D.C. 2005. Triggering of methane production in rice soils by root exudates: effects of soil properties and crop management. Soil Science Society of American Journal 69: 563-570.
Moterle, D.F.; Silva, L.S.; Moro, V.J.; Bayer, C.;Zschornack, T.; Avila, L.A.; Cas Bundt, A. 2013. Methane efflux in rice paddy field under different irrigation managements. Revista Brasileira de Ciencia do Solo 37: 431-437.
Perdomo, C.; Irisarri, P.; Ernst, O. 2009. Nitrous oxide emissions from an uruguayan argiudoll under different tillage and rotation treatments. Nutrient Cycling in Agroecosystems 84: 119-128. Pittelkow, C.M.; Adviento-Borbe, M.A.; Hill, J.E.; Six, J.; van
Kassel, C.; Linquist, B. 2013. Yield-scaled global warming potential of annual nitrous oxide and methane emissions from continuously flooded rice in response to nitrogen input. Agriculture Ecosystems and Environment 177: 10-20.
Rogers, C.W.; Brye, K.R.; Norman, R.J.; Gasnier, T.; Frizzell, D.; Branson, J. 2012. Methane emissions from a silt-loam soil under direct- seeded, delayed-flood rice management. p. 240-247. In: Norman, R.J.; Moldenhauer, K.A.K., eds. University of Arkansas, Fayetteville, AR, USA. (Agricultural Experiment Station Research Series, 600).
Schütz, H.; Holzapfel-Pschorn, A.; Conrad, R.; Rennenberg, H.; Seiler, W. 1989. A 3-year continuous record on the influence of daytime, season, and fertilizer treatment on methane emission rates from an Italian rice paddy. Journal of Geophysical Research94: 16405-16416.
Solomon, S.; Qin, D.; Manning, M.; Chen, Z.; Marquis, M.; Averyt, K.B.; Tignor, M.; Miller, H.L. 2007. Climate Change 2007: The Physical Science Basis. Cambridge University Press, New York, NY, USA.
Towprayoon, S.; Harvey, N.W.; Jittasatra, O.; Kerdchuchean, O. 2000. Influence of rice variety and soil type on production and emission of methane from rice fields. Asian Journal of Energy Environment 1: 251-262.
Towprayoon, S.; Smakgahn, K.; Poonkaew, S. 2005. Mitigation of methane and nitrous oxide emissions from drained irrigated rice fields. Chemosphere 59: 1547-1556.
Tyagi, L.; Kumari, B.; Singh, S.N. 2010. Water management: a tool for methane mitigation from irrigated paddy fields. Science of the Total Environment 408: 1085-1090.
Wassmann, R.; Aulakh, M.S.; Lantin, R.S.; Rennenberg, H.; Aduna, J.B. 2002. Methane emission patterns for rice fields planted to several cultivars for nine seasons. Nutrient Cycling Agroecosystems 64: 111-124.
Watanabe, A.; Takeda, T.; Kimura, M. 1999. Evaluation of origins of CH4 carbon emitted from rice paddies. Journal of Geophysical Research 104: 23623-23629.
Xu, S.R.; Jaffe, P.; Mauzerall, D.L. 2007. A process-based model for methane emission from flooded rice paddy systems. Ecological Modelling 205: 475-491.
Yagi, K.; Tsuruta, H.; Minami, K. 1997. Possible options for mitigating methane emission from rice cultivation. Nutrient Cycling in Agroecosystems 49: 213-220.
Zhang, G.; Zhang, X.; Ma, J.; Xu, H.; Cai, Z. 2011. Effect of drainage in the fallow season on reduction of CH4 production and emission from permanently flooded rice fields. Nutrient Cycling in Agroecosystems 89: 81-91.
Zhao, X.; Min, J.; Wang, S.; Shi, W.; Xing, G. 2011. Further understanding of nitrous oxide emission from paddy fields under rice/wheat rotation in south China. Journal of Geophysical Research 116: G02016.
Zou, J.; Huang, Y.; Jiang, J.; Zheng, X.; Sass, R.L. 2005. A 3 year field measurement of methane and nitrous oxide emissions from rice paddies in China: effects of water regime, crop residue, and fertilizer application. Global Biogeochemical Cycles 19: GB2021.