Seed quality and optimal spatial arrangement of fodder radish
Andréa dos Santos Oliveira
1, Maria Laene Moreira de Carvalho
2*, Marcela Carlota Nery
2, João
Almir Oliveira
2, Renato Mendes Guimarães
21
UFLA – Programa de Pós-Graduação em Agronomia/Fitotecnia. 2
UFLA – Depto. de Agricultura, Setor de Sementes, CP. 3037 – 37200-000 – Lavras, MG – Brasil. *Corresponding author <mlaenemc@dag.ufla.br>
Edited by: Edmilson José Ambrosano
ABSTRACT: Besides the use of fodder radish (Raphanus sativus var. oleiferus Metzg.) as green manure plant cover crops and animal feed, the seeds have high oil content and low viscosity, ideal characteristics for the production of biodiesel. Studies related to the technology of seed production for this species are insufficient to define the best spatial arrangement of plants in the field that provides higher yields associated with high-quality seeds. Thus, we investigated the space and density between plants that would be ideal for the production of high quality fodder radish seeds. We evaluated the agronomic characteristics and physical, physiological and seed health quality in recently harvested fodder radish in row spacings of 0.2, 0.4, 0.6, and 0.8 m and densities of 10, 30, 50 and 70 seeds m–2. The quality and productivity of the fodder radish’s seeds were affected by the spatial arrangement of plants in the field. Seeds harvested under the spacing of 0.2 m and density of 30 seeds m–2
had better performance and physical, physiological and health quality. Alternaria sp. incidence increased with greater spacing, while Fusarium sp. incidence decreased.
Key words: Raphanus sativus L. var. oleiferus Metzg, Brazil, production, sowing density
Introduction
Fodder radish (Raphanus sativus var. oleiferus Metzg.) has been used in the southern, southeastern and central west-ern regions of Brazil in winter green manure (Lima et al., 2007), crop rotation and animal feeding (Crusciol et al., 2005) and its roots have physical effects on the soil that allow bet-ter aeration, preparation and soil decompaction (Muzilli, 2002). In addition to these uses, it has advantages in biodiesel production because of the low viscosity oil con-tent of the grains, between 30% and 43% (Silva, 2006).
Technology and crop management for seed production differ in some aspects compared to grain and forage produc-tion (Moreira et al., 2004). For the fodder radish, green mat-ter production techniques are known but the information available on seed and grain production and quality is diver-gent so technology for these characteristics is needed. Between the row spacing and the distance between plants in the row are the two factors that define the plant population. The cor-rect choice of plant population is an extremely simple crop practice but has a great impact on yield (Severino et al., 2006), that is affected by the interaction between the plant, produc-tion environment and crop management. Among the man-agement practices, the use of appropriate densities and spac-ing (Martins et al., 1999) can interfere especially in the quality of the seeds produced, as observed by Tourino et al. (2002) in cowpea cropping.
In fodder radish seed, information on the spatial arrange-ment has been reported for green matter production (Ohlandz et al., 2005; Crusciol et al., 2005 and Pereira, 2006). There is little information about cropping for seed produc-tion in the literature for the central western, South and part of Southeast Brazil (Calegari et al., 1993). There are hardly any recommendations for the southern region of Minas Gerais, so techniques need to be developed to obtain
qual-ity seeds. Thus, the objective of the present study was to define the ideal spatial arrangement for fodder radish seed production in the winter in the southern region of Minas Gerais.
Materials and Methods
The field experiment was carried out from June to Oc-tober 2007 in an experimental field in Lavras, state of Minas Gerais, Brazil (21º14’ S; 45º00’ W, 919 m a.s.l.). The climate has a dry cold season from April to September and a warm and wet season from October to March, according to the Köppen classification. The soil is clayey Oxisol (Latossolo distrófico, fase cerrado, according to Brazilian classification).
Soil samples were collected from the experimental area and chemical analysis performed before sowing. Fertilization at sowing was carried out according to Ribeiro et al. (1999), using 300 kg ha–1 of the NPK 08-28-16 formula. Lime was not applied. The chemical attributes of the soil at 0-0.2 m were: pH in water: 5.5, organic matter: 21 g kg–1; available P: 18.4 mg L–1; available K: 75 mg L–1; available Ca: 25 mmol
c L–1; available Mg: 6 mmol
c L
–1; available Al: 2 mmol c L
–1: 45 mmolc L–1 potential acidity, 33 mmol
c L
–1 sum of bases, cat-ionic exchange capacity: 35 mmolc L–1 effective CTC,: 78 mmol
c L–1 CTC pH 7.0, base saturation: 42%; available phospho-rous resin: 19.9 mg L–1. After incorporating the fertilizer, the fodder radish CATI AL-1000 cultivar was sown by hand on June 12, 2007.
cen-tral rows were considered the useful area. Crop treatments were carried out, such as ant control, and the weeds were eliminated by hand hoeing.
The following data were recorded: final population, plant height, height of insertion of the first silique, number of siliques per plant, number of seeds per silique and yield. Scores for the lodging index followed a scale from 1 to 9 according to criteria established by Antunes and Silveira (1993) with score 1 for the erect plant and score 9 for all plants lodged.
The harvest was carried out by hand, the plants in the plot’s useful area were pulled up and the seeds were dried to 7% moisture, with a variation of ± 0.5%. The seeds were removed from the siliques by hand threshing, stamping and rubbing through sieves. Seeds were beneficiated in an air ma-chine and sieves with 1.8 mm x ¾ inch mesh. Assessments were then carried out from December 2007 to February 2008. The seeds from each subplot were classified by size in 2.00 mm, 2.36 mm, 2.80 mm and 3.35 mm mesh sieves and the fractions calculated of each sieve in percentage. From this assessment, the seeds classified in the 2.36 mm mesh were used to assess the seed quality. A randomized complete de-sign was used in the assessments carried out in the labora-tory in a 4 × 4 factorial design with four sowing densities and four between row spacings.
The weight of 1,000 seeds was determined following methodology reported by Brazil (1992), where eight replica-tions of 100 seeds were weighed on an analytical scale and the results expressed in grams. In the purity analysis, 30 g seeds were used from each plot, separated in pure seed frac-tions, other seeds and inert material according to Brasil (1992). The seed water content was determined by the oven method at 105 ± 2ºC, for 24 h (Brazil, 1992) using two 5 g seed rep-lications. The water content was expressed in percentage of the wet base.
For the germination test, the seeds were sown in gerbox, sand substrate, at 20ºC-30ºC alternating temperatures, with an 8-16 h light period in a BOD chamber, subdivided in four 50 seed replications per treatment and the results expressed in percentage of normal seedlings on the fourth day (first count) and tenth day and the percentage of normal plants was calculated (Brazil, 1992). The germination speed index was calculated by computing daily the number of normal plants and calculated by the formula proposed by Maguire (1962).
For the emergence test in trays, the seeds were sown in plastic boxes with earth substrate: sand at the ratio of 1:2 and field capacity for 60% at 25ºC in a plant growth cham-ber and 12 h light period. Four replications were used of 50 seeds per treatment and the results were expressed in per-centage, on the 4th day (initial stand) and 7th day. The emer-gence speed index was calculated daily by the formula pro-posed by Maguire (1962). The plant canopy dry matter was obtained after drying in a forced air circulation chamber at 60ºC for 24 h. The electric conductivity test was carried out with four replications of 25 seeds per treatment, previously
weighed and placed for imbibitions in beakers containing 75 mL de-ionized water at 25ºC for 6h. After this period, the reading was carried out and the value obtained was di-vided by the weight of the seeds(Vieira and Krzyzanowski, 1999).
The blotter test was carried out on the seeds by the fil-ter paper method or modified blotfil-ter test, with the use of 2.4-dichlorophenoxyacetic acid (2.4-D) and freezing, using 200 seeds, divided into four replications of 50 seeds placed in Petri dishes on three sheets of filter paper imbibed in dis-tilled water, 2.4-D and agar (ISTA, 2008). Seven days after sowing the presence of fungi on the seeds was assessed us-ing a stereoscopic microscope.
The analyses of variance for all the characteristics assessed were carried out using the SISVAR® statistical software. The data were submitted to analysis of variance and regression analysis and the means tested by the Scott Knott test at 5%.
Results and Discussion
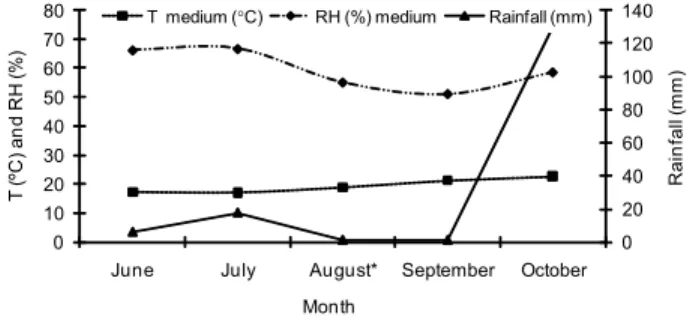
In the seed production period from June to October 2007, the mean temperature in the region ranged from 17.1ºC in July to 22.7ºC in October and the relative air hu-midity from 51.2% in September to 66.8% in July (Figure 1). These data do not differ from average temperature and relative humidity observed in the last ten years (Figure 2), except for rainfall which was supplemented by irrigation. These climatic conditions are favorable for fodder radish seed production, because it is a species recommended for winter cropping in the southern, southeastern and central western regions of Brazil (Calegari et al., 1993). Flowering started early, 60 days after sowing. Nery (2008)1 produced fodder radish seeds in the same planting location and observed flowering only at 90 days after sowing. This reduction in the period to the start of flowering may have occurred because of the sow-ing period, carried out 30 days before the present research. Calegari et al. (1993) observed flowering in the winter crop sown in the southern region of Brazil ranging from 90 to 120 days. Light period sensitive plants reduce the plant cycle when sown late and respond positively to flowering in short days (Amabile et al., 2000). This reduction may be favorable to seed production as long as there are no reductions in yield and quality.
Figure 1 – Data for mean temperature (T), relative air humidity (RH) and mean rainfall during the field experiment. *Flowering start.
0 20 40 60 80 100 120 140
0 10 20 30 40 50 60 70 80
June July August* September October
Ra
in
fa
ll (
m
m
)
T
(
ºC)
a
n
d
RH
(%
)
Month
T medium (°C) RH (%) medium Rainfall (mm)
The analysis of variance showed effect of the sowing den-sity × between row spacing interaction for plant height. The between row spacing affected the final plant population and yield. For the other characteristics analyzed, there was no sig-nificant effect of the spatial arrangement of the plants in the field.
The final plant population, assessed at 136 days after sowing, was influenced by the spacing. As the space between rows increased, the final plant population decreased linearly (Figure 3). However, although the sowing density ranged from 10 to 70 seeds m–2, the maximum population obtained was 42.5 plants m–2, and the minimum was 9.7 plants m–2, with a mean of 29 plants m–2.
The reduction in the final plant populations was accen-tuated in greater spacing, resulting in population close to the densities of 10 and 30 seeds m–2. In populations greater than 30 seeds m–2, reduction in the stand was observed of up to 81%. Reductions in the final population between 10 and 25% are considered normal in plant populations, resulting from the use of low-quality seeds, problems at sowing, such as sowing depths or bird attack, pests and diseases that reduce the stand or even competition for water, light and nutrients (Arnon, 1975). Under this condition, the reduction in the final plant populations was probably due to competition tween plants on the line and not because of the distance be-tween the lines.
Responses in plant height varied greatly as the spacing and sowing density increased. This fact can be explained by the alteration in the establishment of the number of plants per area. Generally, when the population density increases and between row spacing decreases, there is a tendency for plant height to increase in function of the search for light, causing etiolating. Calegari et al. (1993) reported that fodder radish plant height can range from 1.0 to 1.8 m, values ob-served in the present study (Figure 4).
Similarly to the plant hight, there was great variation in the height of insertion of the first silique (Table 1). Taller plants result in greater insertion heights of the first fruit, and this characteristic is also related to the population in-crease (Penariol et al., 2003). However, Argenta et al. (2001) reported that with the increase in plant density, there was a reduction in the plant height and fruit insertion height. There are alterations in the plant characteristics with the
re-y = -2775.86x + 312135.42; R² = 0.805
0 50 100 150 200 250 300
20 40 60 80
F
in
a
l popu
la
ti
on
(t
h
o
u
s
and
pl
an
ts
h
a
–1)
Spacing (cm)
Figure 3 – Final fodder radish plant population as a function of spacing.
Figure 2 – Data for mean temperature (T), relative air humidity (RH) and mean rainfall during last ten years at the experimental area.
Table 1 – Insertion height of the first silique in fodder radish plants produced under different spacing and population densities.
Spacing
Population densities
10 30 50 70
seeds m–2
m - cm ---0.2 101.7 aA 91.7 bA 113.3 Aa 88.3 bA 0.4 100.0 aA 125.0 aA 121.7 Aa 110.0 aA 0.6 103.0 aA 102.7 bA 91.3 Ba 117.7 aA 0.8 120.0 aA 77.7 bB 127.7 aA 88.3 bB
CV (%) 22
Means followed by the same uppercase letter on the line and lowercase letter in the column do not differ (Scott-Knott test,
p < 0.05).
duction in between row spacing, including stand height and lower height of insertion of the first fruit that increase com-petition among the plants in the same row for the reduced solar radiation in the crop canopy (Argenta et al., 2001). The maximum height of insertion of the siliqua is a desirable feature in the mechanical harvesting of seeds by allowing the highest setting of the harvester, but may increase the percentage of non-harvested pods.
0 20 40 60 80 100 120 140
0 10 20 30 40 50 60 70 80
June July August* September October
R
a
in
fa
ll (
m
m
)
T
(
ºC
)
and
R
H
(
%
)
Month
T medium (°C) RH (%) medium
Rainfall (mm)
130 140 150 160 170 180 190
10 30 50 70
He
ig
h
(
c
m)
Sowing density (seeds m–2)
20 (y = -0.023x + 168.935; R² = 0.958) 40 (NS)
60 (y = 0.000088x² - 0.145x + 194.435; R² = 0.999) 80 (y = 0.000038x² - 0.089x + 196.254; R² = 0.658)
Higher rates of plant lodging were observed in the higher sowing densities and smaller spacing (Table 2) with scores of 7, 5 and 3. These scores were 2 and 1 in lower population densities and greater between the row spacing, regardless of the sowing density used. The lower lodging rates observed in the larger spaces between rows and sowing densities may be related to the reduction in the final plant population of up to 81%, because of the reduction in competition among plants and etiolating. Calegari et al. (1993) recommended 0.4 m between the row spacing for seed production, because between a row spacing less than this and a high population density can cause lodging problems. At greater densities the plants tend to lodge more (Tourino et al., 2002; Moreira et al., 2004) that can be a negative effect when using mecha-nized harvesting, reducing its efficiency, yield and even the seed quality.
The number of siliques per plant ranged from 90 to 223, and no increase was observed in the number of siliq-ues per plant related to the increase in density or spacing. Variations were not observed in the number of seeds per silique with the increase in spacing or density (5 and 8 seeds per silique). The absence of variation in the number of seeds per silique in function of spacing or sowing density was also observed by Santos et al. (2002) for the same spe-cies when cropped under no till, with 25 cm between row spacing.
Spacing affected fodder radish seed yield, that tended to decrease as the between row spacing increased (Figure 5). The highest yields were obtained in the smallest be-tween row spacing, with 1,327 and 662.67 kg ha–1, values higher than the mean obtained in studies on fodder rad-ish, in which mean yields were observed of 428 kg ha–1 (Silva et al., 2006) and 123.7 kg ha–1 (Sá, 2005). Hernani et al. (1995) stated that mean grain yields can be obtained of 1,200 kg ha–1 in between row spacing of up to 0.40 m. Calegari et al. (1993) reported fodder radish yield of around 300 to 450 kg ha–1.
In the seed quality assessment, sowing density only affected the emergence speed index, initial stand, electric conductivity and health. Significant effects were not ob-served in the weight of 1,000 seeds, first count, germina-tion, emergence and plant dry matter. The seed water con-tent obtained was 7%, and this was the typical hygroscopic balance for oil seed species (Burrell et al., 1980). The mean
purity percentage ranged from 89.3% to 97.9%. The varia-tion in the weight of 1000 seeds was from 9.57 g to 10.54 g.
The fodder radish seed germination was above 84% which was higher than the standard established for com-mercialization of the seeds of this species, whose mini-mum value is 60%. Emergence was 79%. The results did not vary among the treatments for the first count, germi-nation speed index and plant dry matter (Table 3). For the emergence speed index, initial stand and electrical conduc-tivity, the effect of sowing density was observed on the seed quality. A tendency was observed (Figures 6 and 7) to a greater emergence speed and initial stand in the seeds pro-duced under sowing densities of 30 and 50 seeds m–2. Den-sities greater than 50 seeds m–2 or less than 30 seeds m–2 did not reduce the seed vigor.
Figure 5 – Fodder radish seed yield as a function of row spacing.
Table 2 – Scores for the lodging index in function of different spacing and population densities.
Spacing
Population densities
10 30 50 70
seeds m–2 m
0.2 1 3 5 7
0.4 1 2 3 7
0.6 1 2 2 2
0.8 1 1 2 2
Figure 6 – Emergence speed index of fodder radish seedlings as a function of sowing densities.
y = -0.000021x² + 0.018x + 15.98; R² = 0.833
16 17 18 19 20 21
10 30 50 70
ESI
Sowing density (seeds m–2)
Figure 7 – Initial stand of fodder radish seedlings as a function of sowing densities.
y = -0.000068x² + 0.058x + 3.960; R² = 0.535
7 9 11 13 15 17 19
10 30 50 70
In
it
ia
l s
ta
n
d
(
%
)
Sowing density (seeds m–2)
y = 0.3368x2- 49.253x + 2149.146 R² = 0.988
0 200 400 600 800 1000 1200 1400
20 40 60 80
Y
iel
d (
k
g
ha
–1
)
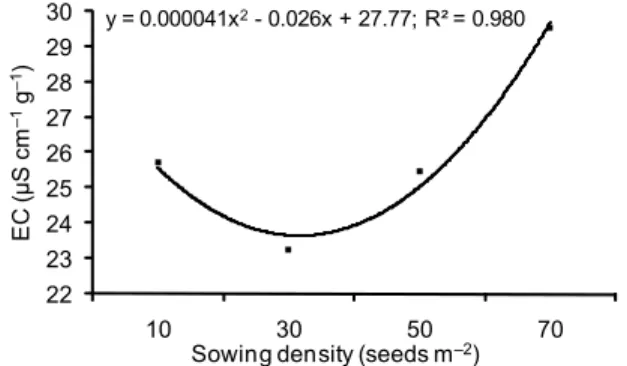
In the electrical conductivity test, there was a tendency to a reduction at the 30 seeds m–2 density and to increase at den-sities of 50 and 70 seeds m–2 (Figure 8). These tests showed differences in seed quality when submitted to different sow-ing densities, indicatsow-ing that better quality fodder radish seeds can be produced at sowing densities close to 30 seeds m–2.
The association of the Alternaria sp.,Cladosporium sp.,
Aspergillus sp., Penicillium sp., Fusarium sp. and Phoma
sp. was observed in the seeds and the fungi and the greatest incidence here reported were for the Alternaria sp., Fusarium
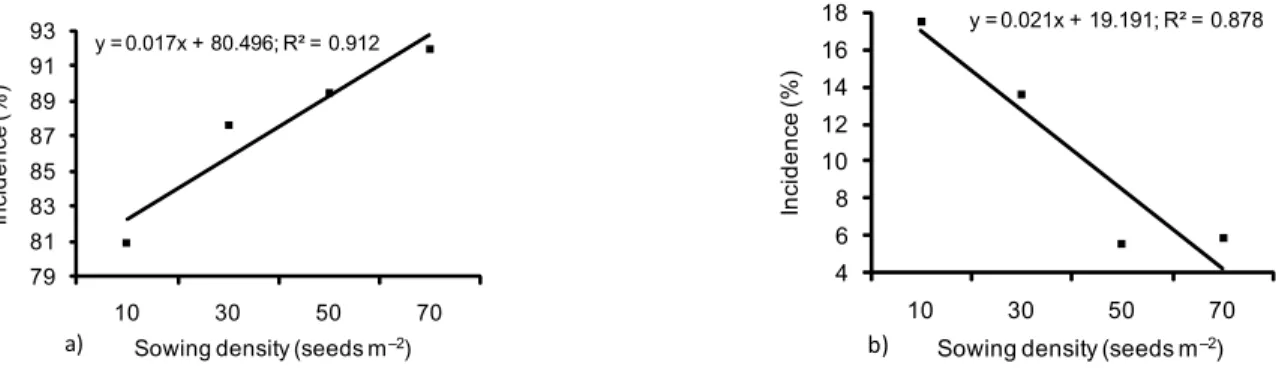
sp. and Cladosporium sp. (Figure 9A and B). There was an effect of sowing density on the incidence of the Alternaria
sp. and Fusarium sp. fungi. A linear tendency to increase for
Alternaria sp. was observed. As the density increased
(Fig-ure 9A) there was a linear tendency to decrease in the
Fusarium sp. incidence when the sowing density was
in-creased (Figure 9B).
The Alternaria sp. incidence tended to increase linearly
with increasing sowing density. This microorganism is asso-ciated with fodder radish seeds and takes effect in damping-off. Crochemore and Piza (1994) worked with fodder radish seeds and observed the incidence of fungi of the Alterna-ria sp. genus such as Alternaria raphani, Alternaria tenuis
and Alternaria brassicae associated to the fodder radish
seeds. Cladosporium sp. incidence in the fodder radish seeds varied in the different population arrangements, as shown in Table 4. The highest incidence was observed in the 10 seeds m–2 sowing density and 20 cm between row spacing (40%).
y = 0.000041x2- 0.026x + 27.77; R² = 0.980
22 23 24 25 26 27 28 29 30
10 30 50 70
EC
(
µ
S
c
m
–1
g
–1)
Sowing density (seeds m–2)
Figure 8 – Electrical conductivity (EC) of fodder radish seeds as a function of sowing densities.
Means followed by the same uppercase letter on the line and lowercase letter in the column do not differ (Scott-Knott and F tests, p > 0.05).
Table 4 – Cladosporium sp. incidence in fodder radish seeds produced under different spacing and population densities.
Spacing
Sowing densities
10 30 50 70
seeds m–2
Cladosporium sp.
m %
---0.2 40 aA 7 aA 12 aA 19 aA
0.4 9 bA 1 aA 5 aA 12 aA
0.6 11 bA 3 aA 16 aA 23 aA
0.8 10 bA 14 aA 4 aA 12 Aa
CV (%) 58
Table 3 – First count, germination, germination speed index, emergence and plant dry matter in fodder radish seeds produced under different spacing and sowing densities.
Spacing
Population densities
10 30 50 70
seeds m–2 First count
m %
---0.2 14 10 13 11
0.4 23 18 14 7
0.6 11 18 12 14
0.8 11 16 9 12
CV(%) 31
Germination
m %
---0.2 89 89 84 91
0.4 93 86 91 88
0.6 87 91 90 91
0.8 91 89 88 91
CV(%) 9
Germination speed index m
0.2 11.0 10.7 9.7 10.3
0.4 11.7 10.0 10.7 10.3
0.6 10.3 11.0 10.3 10.0
0.8 10.3 10.7 10.7 10.7
CV(%) 9
Emergence
m %
---0.2 79 88 80 86
0.4 85 89 85 86
0.6 82 86 87 83
0.8 81 86 85 84
CV(%) 10
Seedling dry matter
m --- mg per seedling
---0.2 8.22 7.46 7.82 7.73
0.4 7.03 8.15 8.98 8.46
0.6 7.98 7.32 9.67 8.25
0.8 6.94 8.56 10.15 8.22
Conclusions
Fodder radish seed quality and yield were affected by the spatial arrangement of the plants in the field. Row spac-ing or densities, respectively, greater than 0.20 m or than 30 seeds m–2, negatively affected all the following character-istics: final plant stand, yield as well as seed physiological and health quality. Alternaria sp. incidence was increased with high spacing, while the incidence of Fusarium sp. was reduced.
Acknowledgements
To CAPES, CNPq and FAPEMIG for financial support, and grants for master research.
References
Amabile, R.F.; Fancelli, A.L.; Carvalho, A.M. 2000. Evaluation of green manures in different sowing dates and row-spacings in the cerrados region. Pesquisa Agropecuária Brasileira 35: 47-54. (in Portuguese, with abstract in English).
Antunes, I.F.; Silveira, E.P. 1993. Bean: Field Manual. Embrapa-CPACT, Pelotas, RS, Brasil. (in Portuguese).
Argenta, G.S.; Silva, P.R. F.; Bortolini, C.G.; Forsthofer, E.L.; Manjabosco, E.A.; Neto, V.B. 2001. Response of maize single-cross hybrids to reduced row spacing. Pesquisa Agropecuária Brasileira36: 71-78. (in Portuguese, with abstract in English).
Arnon, I. 1975. Plant population density. p. 76-78. In: Arnon, I., ed. Mineral nutrition of maize. International Potash Institute, Bern, Switzerland.
Brazil. Ministry of Agriculture and Agrarian Reform. 1992b. Rules for Seed Testing. SNDA/DNDV/CLAV, Brasília, DF, Brazil. 365 p. (in Portuguese).
Burrell, N.J.; Knight, G.P.; Armitage, D.M.; Hill, S.T. 1980. Determination of the time available for drying rapeseed before the appearance of surface moulds. Journal of Stored Products Research. Oxford, 16: 115-118.
Calegari, A.; Alcântara, P.B.; Miyasaka, S.; Amado, T. J. C. 1993. Characterization of the main species of green manure: fodder radish. part III. p. 302-304. In.: Calegari, A.; Mondardo, A.; Bulisani, E.A.; Wildner, L.P.; Costa, M.B.B.; Alcântara, P.B.; Miyasaka, S.; Amado, T.J.C. Green manure in southern Brazil. AS-PTA, Rio de Janeiro, RJ, Brazil. (in Portuguese).
Crochemore, M.L.; Piza, S.M.T. 1994. Germination and sanity of turnip seeds stored in different types of package. Pesquisa Agropecuária Brasileira 29: 677-680. (in Portuguese, with abstract in English).
Crusciol, C.A.C.; Cottica, R.L.; Lima, E.V.; Andreotti, M.; Moro, E.; Marconi, E. 2005. Persistence and nutrients release of forage turnip straw utilized as mulching in no-tillage crop system. Pesquisa Agropecuária Brasileira 40: 161-168. (in Portuguese, with abstract in English).
Hernani, L.C.; Endres, V.C.; Pitol, C.; Salton, J.C. 1995. Green Manures Fall/Winter in Mato Grosso do Sul. Embrapa-CPAO, Dourados, MS, Brazil. 93 p. (in Portuguese).
International Seed Testing Association [ISTA]. 2008. Seed health testing. In: International rules for seed testing. Bassersdorf, Switzerland.
Lima, J.D.; Aldrighi, M.; Sakai, R.K.; Soliman, E.P.; Moraes, W.S. 2007. Performance of turnip (Raphanus sativus L.) and wild radish (R aphanus raphanistrum L. ) as green manure. Pesquis a Agropecuaria Tropical 37: 60-63. (in Portuguese, with abstract in English).
Maguire, J.D. 1962. Speed of germination: aid in selection and evaluation for seedling emergence and vigor. Crop Science 2: 176-177.
Martins, M.C.; Câmara, G.M.S.; Peixoto, C.P.; Marchiori, L.F.S.; Leonardo, V.; Mattiazzi, P. 1999. Sowing date, planting density and vegetative performance of soybean cultivars. Scientia Agricola 56: 851-858. (in Portuguese, with abstract in English).
Moreira, L.B.; Lopes, H.M.; Nascimento, S.G.M. 2004. Effects of plant population on agronomic characteristics, yield and quality seeds of pearl millet (Pennisetum glaucum (L.) R. Brown), cv. ENA 1. Agronomia 38: 78-82. (in Portuguese, with abstract in English).
Muzilli, O. 2002. Management of organic matter in no-tillage system: the experience in the State of Parana. Informações Agronômicas 100: 6-10. (in Portuguese).
Ohlandz, R.A.A.; Sousa, L.C.F.; Hernani, L.C.; Marchettis, M.E.; Gonçalves, M.C. 2005. Soil cover crops and nitrogen fertilizing in corn in no tillage planting.Ciência e Agrotecnologia 29: 538-544 (in Portuguese, with abstract in English).
Penariol, F.G.; Fornasieri Filho, D.; Coicev, L.; Bordin, L.; Farinelli, R.; 2003. Performance of maize cultivars sown in different row widths and population densities in off-season cultivation. Revista Brasileira de Milho e Sorgo 2: 52-60. (in Portuguese, with abstract in English).
Pereira, A.R. 2006. How to Select Plants For Degraded Areas And Erosion Control. FAPI, Belo Horizonte, MG, Brazil. (in Portuguese).
Ribeiro, A.C.; Guimarães, P.T.G.; Vicente, V.H.A. 1999. Lime and Fertilizer Use Recommendations in the Minas Gerais: 5ª Approximatio n. CFSEMG, Lavras , MG, Brazil. (in Portuguese).
Sá, R.O. Genetic Variability Among Fodder Radish Half-Sib Progenies, CATI AL 1000 Cultivar. 2005. Faculty of Agricultural Sciences, State-University of São Paulo, SP, Brazil. 49 p. (in Portuguese).
y = 0.021x + 19.191; R² = 0.878
4 6 8 10 12 14 16 18
10 30 50 70
Inc
idenc
e (
%
)
Sowing density (seeds m–2)
b)
Figure 9 – Incidence of Alternaria sp. (A) and Fusarium sp. (B) fungi in fodder radish seeds as a function of sowing density.
y = 0.017x + 80.496; R² = 0.912
79 81 83 85 87 89 91 93
10 30 50 70
In
c
idenc
e (
%
)
Sowing density (seeds m–2)
Santos, H.P., Fontaneli, R.S., Baier, A.C., Tomm, G.O. 2002. Main forage on no tillage Crop-Pasture Rotation in Plateau and Missions Regions in the Rio Grande do Sul. Embrapa Trigo, Passo Fundo, RS, Brazil. (in Portuguese).
Severino, L.S.; Moraes, C.R.A.; Gondim, T.M.S.; Cardoso, G.D.; Beltrão, N.E.M. 2006. Yield of castor planted at different row space. Revista Ciência Agronômica 37: 50-54 (in Portuguese, with abstract in English).
Silva, A.R.B.; Silva, T.R.B.; Silva, M.L.L.; Vianna, J.F.; Martinez, M.M.; Vianas, L.H.; Silva, R.F. 2006. Behavior of fodder radish (Raphanus sativus L.) cultivars depending on the variations of row spacing. Available in: http://www.biodiesel.gov.br/docs/congressso2006/ agricultura/ComportamentoCultivaresNabo.pdf. [Accessed Jan. 15, 2007].
Tourino, M.C.C.; Rezende, P.M.; Salvador, N. 2002. Row spacing, plant density and intrarow plant spacing uniformity effect on soybean yield and agronomic characteristics. Pesquisa Agropecuária Brasileira 37: 1071-1077. (in Portuguese, with abstract in English). Vieira, R.D.; Krzyzanowski, F. 1999. Electrical condutivity test. chap. 4, p. 1-26. In: Krzyzanowski, F.; Vieira, R.D.; Franca Neto, J.B., eds. Seed vigor:concepts and tests. ABRATES, Londrina, PR, Brazil. (in Portuguese).