Five decades of black
common bean genetic breeding in Brazil
1Leiri Daiane Barili2, Naine Martins do Vale2,
José Eustáquio de Souza Carneiro2, Fabyano Fonseca e Silva2, Felipe Lopes da Silva2
INTRODUCTION
Common bean is a cash crop of great socio-economic importance to Brazil. In fact, Brazil is one of its main producers and consumers worldwide (FAO 2011). The crop is cultivated throughout the country, in all seasons, by small, medium and big producers (Barili et al. 2011). The 2013/2014 crop reached a production of 3.45 million tons, with yield
of 1,026 kg ha-1 (Conab 2015).
Among the common bean types consumed and cultivated in Brazil, the black common bean ranks second, with 17 % of the bean-cultivated area,
ABSTRACT
RESUMO
producing 490,000 tons per year (Faria et al. 2014). Its consumption is predominant in the southern States, and in Rio de Janeiro, southeastern Minas Gerais and southern Espírito Santo (Del Peloso & Melo 2005).
The genetic breeding of black common bean started in the 1930s, in Brazil, although success occurred only in the 1970s (Voysest 2000). The main black common bean breeding programs are currently developed by Embrapa Arroz e Feijão and Embrapa Clima Temperado, Empresa de Pesquisa Agropecuária de Santa Catarina (Epagri), Instituto Agronômico de Campinas (IAC), Instituto
1. Manuscript received in May/2016 and accepted for publication in Aug./2016 (http://dx.doi.org/10.1590/1983-40632016v4641371). 2. Universidade Federal de Viçosa, Viçosa, MG, Brazil.E-mails: [email protected], [email protected],
The increase in grain yield and other agronomic traits, in common bean cultivars, is due, in large part, to its genetic breeding. This study aimed at estimating the genetic progress for grain yield and other important agronomic traits in black common bean cultivars recommended by Brazilian breeding programs between 1960 and 2013. A randomized blocks design was used, with three replications and 40 black common bean cultivars. The following traits were evaluated: grain yield and appearance, plant architecture, number of pods per plant and seeds per pod and 1,000-seed weight. The genetic progress was estimated from the trait averages over the years, using bissegmented linear regression models that allowed the inference of the exact year in which the black common bean breeding began to present significant genetic progress. For grain yield, the genetic progress was observed from 1988, with an annual gain of 2.42 %. Improvements also occurred to grain appearance (1.85 %), plant architecture (1.35 %), number of pods per plant (2.36 %) and seeds per pod (2.24 %) and 1,000-seed weight (1.42 %), mainly after 1989.
KEY-WORDS: Phaseolus vulgaris L.; genetic gain; bissegmented regression.
Cinco décadas de melhoramento genético do feijão preto no Brasil
O aumento na produtividade de grãos e em outras características agronômicas, em cultivares de feijão, se deve, em grande parte, ao seu melhoramento genético. Objetivou-se estimar o progresso genético para produtividade de grãos e outras características de importância agronômica de cultivares de feijão preto recomendadas por programas de melhoramento, no Brasil, de 1960 a 2013. O delineamento utilizado foi o de blocos ao acaso, com três repetições e 40 cultivares de feijão preto. As características avaliadas foram: produtividade e aparência de grãos, arquitetura de planta, número de vagens por planta e de grãos por vagem e massa de mil grãos. O progresso genético foi estimado com base nas médias das características ao longo dos anos, utilizando-se modelos lineares de regressão bissegmentada, os quais permitiram inferir sobre o ano exato em que o melhoramento do feijão
preto começou a apresentar progresso genético significativo. Para
produtividade de grãos, o progresso genético foi observado a partir de 1988, com ganho anual de 2,42 %. Melhorias também ocorreram para aparência de grãos (1,85 %), arquitetura de planta (1,35 %), número de vagens por planta (2,36 %) e de grãos por vagem (2,24 %) e massa de mil grãos (1,42 %), principalmente após 1989.
Agronômico do Paraná (Iapar), Universidade Federal de Lavras (UFLa), Universidade Federal de Viçosa (UFV) (Paula Júnior & Wendland 2012) and Fundação Estadual de Pesquisa Agropecuária (Fepagro).
The development of improved cultivars has significantly contributed toward an increase in the
mean national yield from 500 kg ha-1 (in the 1970s)
to over 2,000 kg ha-1, with current cultivars (Bertoldo
et al. 2015). In some Brazilian States, yield exceeds
2,500 kg ha-1 (Conab 2015). According to Ramalho
et al. (2012) and Carbonell et al. (2012), progress in grain yield, as well as in technological and nutritional quality, is greatly attributed to genetic breeding.
Common bean genetic progress has been registered by several breeding programs (Abreu et al. 1994, Fonseca Júnior 1997, Elias et al. 1999, Ribeiro et al. 2003, Matos et al. 2007, Chiorato et al. 2010, Faria et al. 2013 and 2014). Their estimates show successful breeding progress. However, their results are derived from lines/cultivars recommended only by a specific improvement program, not estimating the progress in Brazil as a whole. Consequently, the deployment of experiments that evaluate the genetic progress of beans as a whole and the comparison of cultivars from different institutions through a long improvement period is desired. Ribeiro et al. (2003) and Faria et al. (2014) point out that the assessment of common bean genetic progress has been restricted to grain yield, being necessary to estimate other traits, such as plant architecture and grain yield components.
This study aimed at evaluating the genetic progress for grain yield and other agronomic traits of black common bean cultivars recommended by different breeding programs, in Brazil, from 1960 to 2013.
MATERIAL AND METHODS
E x p e r i m e n t s w e r e c o n d u c t e d a t t h e Universidade Federal de Viçosa (UFV), in Viçosa (20º45’14’’S, 42º52’55’’W and altitude of 648 m) and Coimbra (20º51’24’’S, 42º48’10’’W and altitude of 720 m), both in the Minas Gerais State, Brazil, during the 2013 dry and winter seasons.
A total of 40 black common bean genotypes, 38 cultivars recommended by different research institutions in Brazil and 2 lines in pre-release stage by the common bean breeding program at UFV were
evaluated. The decision on the cultivars was based on scientific articles published in indexed journals and professional reports from different common bean breeding programs.
Initially, a cultivar seed sample was obtained from institutions and then multiplied to standardize germination, in order to carry out the experiment. The experiments were performed in a randomized complete blocks design, with three replicates. The plots consisted of four 3 m lines, spaced 0.50 m apart, with 15 seeds per meter.
The traits evaluated were: grain yield (Yield), obtained by weighing the two central rows of the plot, adjusted to 13 % moisture and calculated as
kg ha-1; grain appearance (GA), evaluated using the
grading scale 1 to 5, considering grain size, form and brightness (Ramalho et al. 1998), where 1 refers to cream-colored grains, with light brown streaks, light background, without hilum, not flattened and with mean 100-grain weight of 25-27 g, and 5 refers to cream to brown grains, with dark brown streaks, dark seed coat, with halo, flattened and with mean 100-grain weight of less than 22 g (Ramalho et al. 1998); plant architecture (Arch), evaluated by using a rating scale from 1 to 5 (Ramalho et al. 1998), which considers the insertion height of the first pod and number and angle of lateral branches, where 1 refers to erect plants with high insertion of the first pod, and with branches angle less than 45 degrees, and 5 to very prostrate plants; number of pods per plant (NPP), obtained by counting individual pods per plant; number of seeds per pod (NSP), obtained by the total number of seeds divided by the total number of pods; and 1,000-seed weight (W1000) (g), obtained by 1,000 seeds randomly taken from the plot and weighed. The yield components (Yield, GA, Arch, NPP, NSP and W1000) were evaluated based on six plants sampled at random in the plot. The plant architecture was evaluated considering the whole plot.
The data were submitted to joint analysis of variance, which was performed assuming random effects for blocks, genotypes, environment and genotype x environment interaction. The model was
as it follows: Yijk = m + Gi + B/Ajk + Ak + GAik + Eijk,
where Yijk is the observed value of the ith genotype in
the kth block and jth environment; m the general mean;
Gi the random effect of the ith genotype (i = 1, 2, 3, ...,
40); Aj the random effect of the jth environment (j =
1, 2, 3, 4); GA(ij) the random effect of the interaction
between the ith and jth environments; B
effect of the kth block (k = 1, 2, 3); and E ijk the
experimental error. It was assumed that G ~ N(0, σG
2);
Aj ~ N(0, σA2); GA
ij ~ N(0, σGA 2 ); B
k ~ N(0, σK
2); and
Eijk ~N(0, σE2 ).
The analysis of variance was performed using
the MIXED procedure of the SAS® software, version
9.4. The traits grain appearance and plant architecture failed the normality requirement by Anova, and the Box-Cox transformation was undertaken by the PROC TRANSREG of SAS. The grouping of means was performed according to the Scott-Knott test, using the Genes software, where the variance components estimated by SAS were used as input. The homogeneity of variances was estimated via the ratio between the highest and lowest mean square
(Fmax). They were considered homogeneous when
the ratio was less than 7.0 (Pimentel-Gomes 1990).
Aiming to estimate the year (x0) in which
the common bean improvement started to have significant gains, bissegmented linear regression models were used to evaluate the trajectory of traits, using the estimated average for each genotype over the year in which the cultivars were recommended. These models were used as they assume a constant
plateau until a given year (breakpoint: x0), when
the actual genetic progress starts and a regression equation from this year can be fit. Given the behavior of these trajectories, the following linear-plateau (LP) model was adopted:
yi = p + ei, if xi < x0 b0 + b1xi + ei, if xi ≥ x0
where yi is the mean trait observed in each year
(xi = 1, 2,…,43); b0 the intercept; b1 the slope; p the
plateau before the effective genetic progress; x0 the
parameters to be estimated; and ei the residual term,
assumed as ei~N(0, σE2). The LP model is linear when
x0 is treated as unknown, and thus the PROC NLIN
tool of the SAS software was used to fit this model, using an iterative least squares procedure based on the Gauss-Newton algorithm.
The estimated point (x0) corresponds to the
year when the actual genetic progress starts. In the segmented LP model, the linear regression coefficient
(b1) provides the estimate of the genetic progress per
year from the breakpoint.
The average annual genetic progress (GPa), in percentage, was calculated for each trait by dividing
the regression slope (b1) by the estimated plateau (p)
(GPa= b1/p). It is a generalization of the traditional
GPa estimation (Matos et al. 2007) calculated from linear regression, for segmented regression. The cultivars release years were coded in ascending order from 1960 (representing year 1) to 2013. Therefore, 53 years of black common bean breeding in Brazil were evaluated.
RESULTS AND DISCUSSION
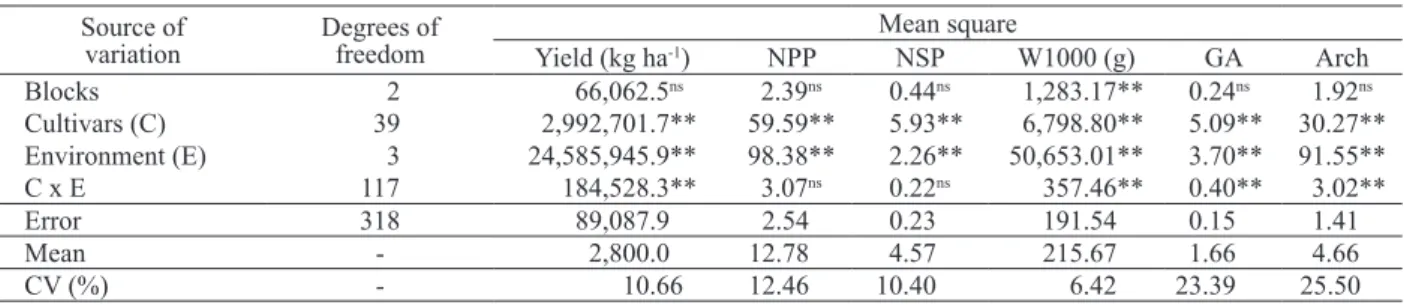
Analysis of variance demonstrated the significant effect of all factors tested for all traits, except for the cultivar x environment (G x E) interaction for number of pods per plant and seeds per pod (Table 1). The G x E interaction is normal in similar assays, since genotypes have distinct genetic features, with different behavior, according to environmental alternation.
Moura et al. (2013) did not report significant effect in the G x E interaction for number of seeds per pod, and pointed out that the trait is scarcely affected by the environment. Different responses for the G x E interaction in common bean for 1,000-seed weight, grain yield, plant architecture and grain appearance were also reported in other assays on beans (Melo et
ns, ** and *:non-significant and significant at 1 % and 5 %, respectively, by the F-test.
Table 1. Summary of combined analysis of variance for grain yield (Yield), number of pods per plant (NPP) and seeds per pod (NSP), 1,000-seed weight (W1000), grain appearance (GA) and plant architecture (Arch) of black common bean cultivars.
Source of variation
Degrees of freedom
Mean square
Yield (kg ha-1) NPP NSP W1000 (g) GA Arch
Blocks 2 66,062.5ns 2.39ns 0.44ns 1,283.17** 0.24ns 1.92ns
Cultivars (C) 39 2,992,701.7** 59.59** 5.93** 6,798.80** 5.09** 30.27** Environment (E) 3 24,585,945.9** 98.38** 2.26** 50,653.01** 3.70** 91.55** C x E 117 184,528.3** 3.07ns 0.22ns 357.46** 0.40** 3.02**
Error 318 89,087.9 2.54 0.23 191.54 0.15 1.41
Mean - 2,800.0 12.78 4.57 215.67 1.66 4.66
CV (%) - 10.66 12.46 10.40 6.42 23.39 25.50
p + y
b
<
= ≥
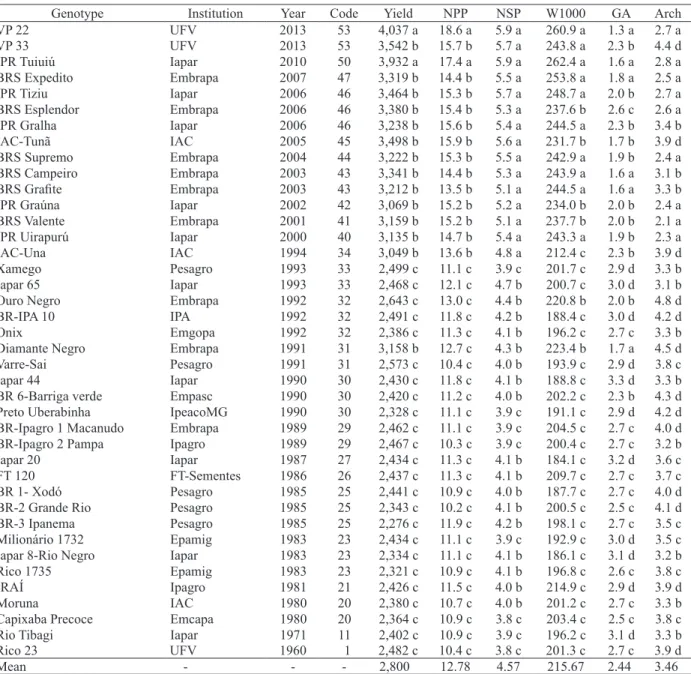
Means followed by the same letter, in the column, belong to the same group, according to the Scott-Knott test, at 5 %.
Genotype Institution Year Code Yield NPP NSP W1000 GA Arch
VP 22 UFV 2013 53 4,037 a 18.6 a 5.9 a 260.9 a 1.3 a 2.7 a
VP 33 UFV 2013 53 3,542 b 15.7 b 5.7 a 243.8 a 2.3 b 4.4 d
IPR Tuiuiú Iapar 2010 50 3,932 a 17.4 a 5.9 a 262.4 a 1.6 a 2.8 a
BRS Expedito Embrapa 2007 47 3,319 b 14.4 b 5.5 a 253.8 a 1.8 a 2.5 a
IPR Tiziu Iapar 2006 46 3,464 b 15.3 b 5.7 a 248.7 a 2.0 b 2.7 a
BRS Esplendor Embrapa 2006 46 3,380 b 15.4 b 5.3 a 237.6 b 2.6 c 2.6 a
IPR Gralha Iapar 2006 46 3,238 b 15.6 b 5.4 a 244.5 a 2.3 b 3.4 b
IAC-Tunã IAC 2005 45 3,498 b 15.9 b 5.6 a 231.7 b 1.7 b 3.9 d
BRS Supremo Embrapa 2004 44 3,222 b 15.3 b 5.5 a 242.9 a 1.9 b 2.4 a
BRS Campeiro Embrapa 2003 43 3,341 b 14.4 b 5.3 a 243.9 a 1.6 a 3.1 b
BRS Grafite Embrapa 2003 43 3,212 b 13.5 b 5.1 a 244.5 a 1.6 a 3.3 b
IPR Graúna Iapar 2002 42 3,069 b 15.2 b 5.2 a 234.0 b 2.0 b 2.4 a
BRS Valente Embrapa 2001 41 3,159 b 15.2 b 5.1 a 237.7 b 2.0 b 2.1 a
IPR Uirapurú Iapar 2000 40 3,135 b 14.7 b 5.4 a 243.3 a 1.9 b 2.3 a
IAC-Una IAC 1994 34 3,049 b 13.6 b 4.8 a 212.4 c 2.3 b 3.9 d
Xamego Pesagro 1993 33 2,499 c 11.1 c 3.9 c 201.7 c 2.9 d 3.3 b
Iapar 65 Iapar 1993 33 2,468 c 12.1 c 4.7 b 200.7 c 3.0 d 3.1 b
Ouro Negro Embrapa 1992 32 2,643 c 13.0 c 4.4 b 220.8 b 2.0 b 4.8 d
BR-IPA 10 IPA 1992 32 2,491 c 11.8 c 4.2 b 188.4 c 3.0 d 4.2 d
Onix Emgopa 1992 32 2,386 c 11.3 c 4.1 b 196.2 c 2.7 c 3.3 b
Diamante Negro Embrapa 1991 31 3,158 b 12.7 c 4.3 b 223.4 b 1.7 a 4.5 d
Varre-Sai Pesagro 1991 31 2,573 c 10.4 c 4.0 b 193.9 c 2.9 d 3.8 c
Iapar 44 Iapar 1990 30 2,430 c 11.8 c 4.1 b 188.8 c 3.3 d 3.3 b
BR 6-Barriga verde Empasc 1990 30 2,420 c 11.2 c 4.0 b 202.2 c 2.3 b 4.3 d
Preto Uberabinha IpeacoMG 1990 30 2,328 c 11.1 c 3.9 c 191.1 c 2.9 d 4.2 d
BR-Ipagro 1 Macanudo Embrapa 1989 29 2,462 c 11.1 c 3.9 c 204.5 c 2.7 c 4.0 d
BR-Ipagro 2 Pampa Ipagro 1989 29 2,467 c 10.3 c 3.9 c 200.4 c 2.7 c 3.2 b
Iapar 20 Iapar 1987 27 2,434 c 11.3 c 4.1 b 184.1 c 3.2 d 3.6 c
FT 120 FT-Sementes 1986 26 2,437 c 11.3 c 4.1 b 209.7 c 2.7 c 3.7 c
BR 1- Xodó Pesagro 1985 25 2,441 c 10.9 c 4.0 b 187.7 c 2.7 c 4.0 d
BR-2 Grande Rio Pesagro 1985 25 2,343 c 10.2 c 4.1 b 200.5 c 2.5 c 4.1 d
BR-3 Ipanema Pesagro 1985 25 2,276 c 11.9 c 4.2 b 198.1 c 2.7 c 3.5 c
Milionário 1732 Epamig 1983 23 2,434 c 11.1 c 3.9 c 192.9 c 3.0 d 3.5 c
Iapar 8-Rio Negro Iapar 1983 23 2,334 c 11.1 c 4.1 b 186.1 c 3.1 d 3.2 b
Rico 1735 Epamig 1983 23 2,321 c 10.9 c 4.1 b 196.8 c 2.6 c 3.8 c
IRAÍ Ipagro 1981 21 2,426 c 11.5 c 4.0 b 214.9 c 2.9 d 3.9 d
Moruna IAC 1980 20 2,380 c 10.7 c 4.0 b 201.2 c 2.7 c 3.3 b
Capixaba Precoce Emcapa 1980 20 2,364 c 10.9 c 3.8 c 203.4 c 2.5 c 3.8 c
Rio Tibagi Iapar 1971 11 2,402 c 10.9 c 3.9 c 196.2 c 3.1 d 3.3 b
Rico 23 UFV 1960 1 2,482 c 10.4 c 3.8 c 201.3 c 2.7 c 3.9 d
Mean - - - 2,800 12.78 4.57 215.67 2.44 3.46
Table 2. Means for grain yield (Yield), number of pods per plant (NPP) and seeds per pod (NSP), 1,000-seed weight (W1000), grain appearance (GA) and plant architecture (Arch) of black common bean cultivars and their years of recommendation (Year). al. 2007, Pereira et al. 2009, Moura et al. 2013). The
coefficients of variation ranged between 6.42 % and 25.50 %, indicating a good experimental precision.
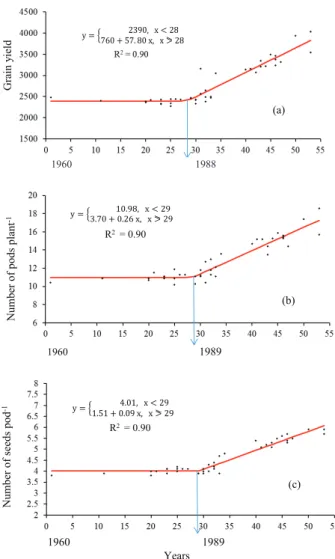
The genetic progress for grain yield in black common bean cultivars only became significant after 1988, as shown by the results of the bissegmented regression analysis (Figure 1a). Until that time, the recommended cultivars in Brazil showed small differences in grain yield, not differing significantly from each other, as noted in the group test (Table 2). Henceforth (1988),
cultivars revealed gradual increases in grain yield,
with a genetic progress of 2.42 % or 57.8 kg ha-1,
per year (Table 3).
Although the black commom bean breeding lags behind the Carioca-type beans (Melo et al. 2012), it is possible to observe a high grain yield under recommended cultivars, in recent years, with yield
above 3,000 kg ha-1 (Table 2). This fact demonstrates
yield, is formed by the genotypes in pre-launch VP 22 (2013) and IPR Tuiuiú (2010), respectively with
yields of 4,037 kg ha-1 and 3,932 kg ha-1.
Genetic gain estimates for grain yield in Brazil are often presented in the literature (Abreu et al. 1994, Elias et al. 1999, Matos et al. 2007, Chiorato et al. 2010, Faria et al. 2013 and 2014). The annual genetic progress obtained in these studies has ranged from 0.72 % (Faria et al. 2013) to 4.36 % per year (Matos et al. 2007), in alignment with the 2.42 % progress estimate reported in the present study.
The estimation of genetic progress using bissegmented regression favors more accurate estimates, as it allows to infer the exact year in which the breeding began to show significant gains, providing the calculations from that point, and not from the years in which progress was not effective, as in the years before 1988, for grain yield.
Up to 1989, the number of pods per plant (approximately 10.98), a primary component for grain yield, remained constant (Figure 1b). Henceforth, a significant yearly increase occurred, with a genetic progress of 2.36 % per year, or
0.26 pods per plant year-1, between 1989 and 2013
(Table 3). Cultivars recommended between 2000 and 2010 and between 2010 and 2013 averaged three and six more pods per plant, respectively, when compared with recommended cultivars, prior to 1989. In the 24 years successful breeding (1989-2013), a total
average increase of six pods plant-1 was obtained.
This is evidenced for the VP 22 line (18.6) and IPR Tuiuiú cultivar (17.4) isolated in the Scott-Knott group ‘a’ (Table 2). The number of pods per plant is a highly important trait used in selection, when increase in grain yield is targeted (Barili et al. 2011).
The increase in the number of seeds per pod became significant after 1989 (Figure 1c). The annual genetic progress for the aforementioned traits, between 1989 and 2013, reached 2.24 % per year
or 0.09 grains pod-1 year-1. This can be attributed
Estimate Trait
Yield NPP NSP W1000 GA Arch
Intercept (b0) 760 3.70 1.51 114.29 4.02 5.10
Inclination (b1) 57.8 0.26 0.09 2.83 -0.05 -0.05
P-value(Ho: b1 = 0) 0.001 0.001 0.001 0.001 0.001 0.001
Plateau (breakpoint) 2,390 10.98 4.01 198.52 2.70 3.70
Initial year of genetic progress 1988 1989 1989 1990 1987 1991
Determination coefficient (%) 90 90 93 84 55 25
Annual genetic progress (%) 2.42 2.36 2.24 1.42 1.85 1.35
Table 3. Estimates of the regression coefficients and genetic progress (%) for traits, grain yield (Yield), number of pods per plant
(NPP) and seeds per pod (NSP), 1,000-seed weight (W1000), grain appearance (GA) and plant architecture (Arch) of black common bean cultivars recommended in Brazil between 1960 and 2013.
1960 1988
1960 1989 R2 = 0.90
Years
1960 1989 R2 = 0.90
(a)
(b)
(c)
y =�760 + 57. 80 x, x 2390, x < 28⪖28
y =�3.70 + 0.26 x, x 10.98, x < 29⪖29
y =�1.51 + 0.09 x, x 4.01, x < 29⪖29
Figure 1. Annual genetic progress for grain yield and number of pods per plant and seeds per pod of black common bean cultivars recommended in Brazil between 1960 and 2013.
Years
1960 1989
� ⪖
� ⪖
� ⪖
G
ra
in
y
ie
ld
N
um
be
r
of
pods
pl
ant
-1
� ⪖
� ⪖
� ⪖
N
um
be
r of
s
ee
ds
pod
-1
to the fact that cultivars recommended between 2000 and 2013 provided one more grain per pod, when compared to those recommended in previous decades. They were grouped separately in group ‘a’ (Table 2). Since the number of seeds per pod is also one of the main components for grain yield (Barili et al. 2011), its increase contributed directly to the increase in yield. To the best of our knowledge, this is the first estimate of genetic progress for the number of pods per plant and grains per pod.
The 1,000-seed weight remained constant up to 1990 (Figure 2a). Henceforth, genetic progress became evident and significant, reaching 1.42 %
per year, or a yearly increase of 2.83 g 1,000 seeds-1.
Similarly to the number of seeds per pod, a gradual increase in the 1,000-seed weight started from 1990, with cultivars recommended after 2000 featuring higher averages and fitting within the Scott-Knott groups ‘a’ and ‘b’ (Table 2).
Ribeiro et al. (2003) and Faria et al. (2014) registered, respectively, 0.58 % and 0.65 % of genetic progress per year, for 1,000-seed weight. Genetic progress in these studies was estimated by the direct method, using simple linear regression equations. Consequently, results with bissegmented regression used in the current study were of a greater magnitude. The estimation by bissegmented regression allowed estimating the annual genetic progress from the moment it became evident (after the breakpoint), not dissipating the genetic progress in periods in which the breeding was not successful, as in the years 1960-1990 (Figure 2c).
According to Faria et al. 2013, the Brazilian consumer prefers bigger grains. Therefore, cultivars with agronomic traits showing enhanced grain yield and its main components, plant architecture, grain appearance and bigger grains are preferred both by consumers and producers. Consequently, the VP 22 genotype and the cultivars BRS Expedito, IPR Tiziu, BRS Esplendor, BRS Supremo, IPR Graúna, BRS Valente, IPR Uirapurú and IAC-Tunã have the aforementioned traits and are potential genetic materials (Table 2).
Grain appearance is a trait of great relevance in bean breeding, due to consumers demands. The genetic progress for grain appearance became significant after 1987 (Figure 2b). Up to that year, the grain appearance of cultivars had an average of 2.79. Subsequently, scores decreased gradually, with improvements in grain quality. Genetic progress
for grain appearance, between 1987 and 2013, was 1.85 % per year or a 0.5 point decrease per year. Faria et al. (2014) obtained a 2.4 % gain per year for grain appearance, during 22 years of common bean genetic breeding by the Empresa Brasileira de Pesquisa Agropecuária (Embrapa).
In the history of black bean in Brazil, some cultivars, such as Diamante Negro (1991), Ouro Negro (1992), IPR Uirapuru (2000) and BRS Valente (2001), won the preference of producers and consumers, due to their agronomic qualities. In fact, breeders included them as parents in crossings due to their favorable genes, such as the traits related to grain appearance (Table 2). Their inclusion as parents resulted in a better appearance of more recent genotypes, such as VP 22 (2013), IPR Tuiuiú
Figure 2. Annual genetic progress for 1,000-seed weight (g) (a), grain appearance (b) and plant architecture (c) of black common bean cultivars recommended in Brazil between 1960 and 2013.
1960 1990 2013 R2= 0.84
1960 1987 R2= 0.55
Years
1960 1991 R2= 0.25
(a)
(b)
(c) y =� 198.52, x < 30
114.29 + 2.83 x, x⪖30
y =�5.10 3.70, x < 31−0,05 x, x⪖31 y =�4.02 2.79, x < 27−0,05 x, x⪖27
Years
1960 1989
� ⪖
� ⪖
� ⪖
P
lan
t ar
ch
it
ect
u
re
1,000-seed
w
ei
g
h
t
G
rai
n
ap
p
ear
an
ce
� ⪖
� − ⪖
(2010), BRS Expedito (2007), IPR Tiziu (2006) and IAC-Tunã (2005).
Bean plants with better architecture provide ease of cultivation, reduce the incidence of diseases, improve the canopy aeration and grain quality, and allow a mechanical harvest with fewer losses (Souza
et al. 2013, Ramalho & Abreu 2015). The trait is
highly relevant and greatly focused by breeders. From 1960 to 1991, improvements did not occur in plant architecture, in recommended black bean cultivars (Figure 2c). However, after 1991, there was a significant 1.35 % genetic progress per year, or a reduction of 0.05 point in the score per year (Table 3). The genetic progress for plant architecture provided a better structure for modern cultivars, except for the VP 33 line, with a higher average (4.4), if compared to the other genotypes recently released. Studies by Faria et al. (2014) revealed that the cultivars BRS Valente (2001), BRS Supremo (2004) and BRS Esplendor (2006) had the lowest architecture score. This is relevant, as these cultivars have been recommended for several regions in Brazil. Their results are similar to those observed in the current study, in which these cultivars also had the best scores for plant architecture (2.1, 2.4 and 2.6, respectively).
The present research showed high gains in grain yield, commercial grain quality, plant architecture and productivity of main components since the early 1990s. The genetic progress observed results from the efforts of the Brazilian research institutes involved in the breeding of this important crop.
CONCLUSIONS
1. Regardless of the cultivar and institution which recommended it, the breeding research of black bean in Brazil has effectively provided significant genetic progress and the simultaneous recommendation of productive cultivars;
2. Effective genetic progress of black bean breeding for grain yield in Brazil started in 1988, with a gain of 2.42 % per year;
3. Significant increase for grain appearance, plant architecture, number of pods per plant and seeds per pod, and 1,000-seed weight occurred by the end of the 1980s and beginning of the 1990s, with a respective genetic progress of 2.36 %, 2.24 %, 1.42 %, 1.85 % and 1.35 % per year.
REFERENCES
ABREU, A. F. B. et al. Progresso do melhoramento genético do feijoeiro nas décadas de setenta e oitenta nas regiões Sul e Alto Paranaíba em Minas Gerais. Pesquisa Agropecuária Brasileira, v. 29, n. 1, p. 105-112, 1994.
BARILI, L. D. et al. Correlação fenotípica entre componentes do rendimento de grãos de feijão comum (Phaseolus vulgaris L.). Semina: Ciências Agrárias, v. 32, n. 3, p. 1263-1274, 2011.
BERTOLDO, J. G. et al. Alternativas na fertilização de feijão visando a reduzir a aplicação de N-ureia. Pesquisa Agropecuária Tropical, v. 45, n. 3, p. 348-355, 2015.
CARBONELL, S. A. M. et al. Contributions of the Instituto Agronômico (IAC) for plant breeding. Crop Breeding and Applied Biotechnology, v. 12, special n., p. 15-24, 2012.
CHIORATO, A. F. et al. Genetic gain in the breeding program of common beans at IAC from 1989 to 2007. Crop Breeding Applied Biotechnology, v. 10, n. 4, p. 329-336, 2010.
COMPANHIA NACIONAL DE ABASTECIMENTO (Conab). Acompanhamento da safra brasileira de grãos, safra 2014/15, 7º levantamento. 2015. Available at: < http://www.conab.gov.br/OlalaCMS/uploads/ a r q u i v o s / 1 5 _ 0 4 _ 1 0 _ 0 9 _ 2 2 _ 0 5 _ b o l e t i m _ g r a o s _ abril_2015.pdf>. Access on: 20 Jul. 2015.
DEL PELOSO, M. J.; MELO, L. C. Potencial de rendimento da cultura do feijoeiro comum. Santo Antônio de Goiás: Embrapa Arroz e Feijão, 2005.
ELIAS, H. T.; HEMP, S.; FLESCH, R. D. Ganho genético na produtividade das cultivares de feijão recomendadas para Santa Catarina 1979/1999. In: REUNIÃO NACIONAL DE PESQUISA DE FEIJÃO, 6., 1999, Goiânia. Anais... Goiânia: Embrapa, 1999. p. 373-375.
FOOD AND AGRICULTURE ORGANIZATION (FAO). FAOSTAT statistical database. 2011. Available at: <http:// faostat.fao.org/>. Access on: Aug. 2015.
FARIA, L. C. et al. Genetic progress during 22 years of black bean improvement. Euphytica, v. 199, n. 3, p. 261-272, 2014.
FARIA, L. C. et al. Genetic progress during 22 years of improvement of Carioca-type common bean in Brazil. Field Crops Research, v. 142, n. 3, p. 68-74, 2013.
MATOS, J. W.; RAMALHO, M. A. P.; ABREU, A. F. B. Trinta e dois anos do programa de melhoramento do feijoeiro comum em Minas Gerais. Ciência e Agrotecnologia, v. 31, n. 6, p. 1749-1754, 2007.
MELO, L. C. et al. Common bean cultivar BRS Ametista with large Carioca grains and disease resistance. Crop Breeding and Applied Biotechnology, v. 12, n. 4, p. 293-296, 2012.
MELO, L. C. et al. Interação com ambientes e estabilidade de genótipos de feijoeiro comum na região Centro-Sul do Brasil. Pesquisa Agropecuária Brasileira, v. 42, n. 5, p. 715-723, 2007.
MOURA, M. M. et al. Potencial de caracteres na avaliação da arquitetura de plantas de feijão. Pesquisa Agropecuária Brasileira, v. 48, n. 4, p. 417-425, 2013.
PAULA JÚNIOR, T. J.; WENDLAND, A. Melhoramento genético do feijoeiro-comum e prevenção de doenças. Viçosa: Epamig, 2012.
PEREIRA, H. S. et al. Comparação de métodos de análise de adaptabilidade e estabilidade fenotípica em feijoeiro comum. Pesquisa Agropecuária Brasileira, v. 44, n. 4, p. 374-383, 2009.
PIMENTEL-GOMES, F. Curso de estatística experimental. 13. ed. Piracicaba: Nobel, 1990.
RAMALHO, M. A. P.; ABREU, A. F. B. Obtenção de cultivares. In: CARNEIRO, J. E. S.; PAULA JÚNIOR, T. J.; BORÉM, A. (Eds.). Feijão: do plantio à colheita. Viçosa: UFV, 2015. p. 96-114.
RAMALHO, M. A. P.; PIROLA, L. H.; ABREU, A. F. B. Alternatives for selection of common bean with uprigi-it plant type and carioca grain type. Pesquisa Agropecuária Brasileira, v. 33, n. 12, p. 1989-1994, 1998.
RAMALHO, M. A. P.; DIAS, L. A. S.; CARVALHO, B. L. Contributions of plant breeding in Brazil: progress and perspectives. Crop Breeding Applied Biotechnology, v. 12, special n., p. 111-120, 2012.
RIBEIRO, N. D.; POSSEBON, S. B.; STORCK, L. Progresso genético em caracteres agronômicos no melhoramento do feijoeiro. Ciência Rural, v. 33, n. 4, p. 629-633, 2003.
SOUZA, T. L. P. O.; PEREIRA, H. S. P.; FARIA, L. C. Cultivares de feijão comum da Embrapa e parceiros disponíveis para 2013. Santo Antônio de Goiás: Embrapa Arroz e Feijão, 2013.