Original paper
Treatment planning systems dosimetry auditing project in Portugal
M.C. Lopes
a,*, A. Cavaco
b, K. Jacob
c, L. Madureira
d, S. Germano
e, S. Faustino
f, J. Lencart
g,
M. Trindade
h, J. Vale
i, V. Batel
j, M. Sousa
k, A. Bernardo
l, S. Brás
m, S. Macedo
n,
D. Pimparel
o, F. Ponte
p, E. Diaz
q, A. Martins
r, A. Pinheiro
s, F. Marques
t, C. Batista
u,
L. Silva
v, M. Rodrigues
w, L. Carita
x, E. Gershkevitsh
y, J. Izewska
zaServiço de Física Médica, IPOCFG, E.P.E., Av. Bissaya Barreto, 3000-075 Coimbra, Portugal bCHUC, Coimbra, Portugal
cHospital CUF Descobertas, Lisboa, Portugal
dHospital de Santa Maria, CHLN, E.P.E., Lisboa, Portugal eIRIO, Lisboa, Portugal
fHospital da Luz, Lisboa, Portugal gIPOPFG, E.P.E., Porto, Portugal hCHTMAD, E.P.E., Vila Real, Portugal iCRP, Porto, Portugal
jCentro Hospitalar S. Joao, E.P.E., Porto, Portugal kClinica Quadrantes, Porto, Portugal
lCentro Oncologico Dra. Natalia Chaves, Carnaxide, Portugal mUnidade Radioterapia do Algarve (Quadrantes_Faro), Faro, Portugal nCLISA, Amadora, Portugal
oHospital de Braga, Braga, Portugal
pDep. de Radioterapia e Oncologia Clinica, Porto, Portugal
qClinica Quadrantes, Unidade Radioterapia do Funchal, Funchal, Portugal rLenicare/Hospital do Espírito Santo, Évora, Portugal
sCHBM, E.P.E., Barreiro, Portugal tHospital de Santiago, Setúbal, Portugal
uQuadrantes Santarém, Hospital de Santarém, Santarém, Portugal vCentro Clinico do SAMS, Lisboa, Portugal
wFundação Champalimaud, Lisboa, Portugal xIPOLFG, E.P.E., Lisboa, Portugal
yNorth Estonia Regional Hospital, Tallinn, Estonia zInternational Atomic Energy Agency, Vienna, Austria
a r t i c l e
i n f o
Article history:
Received 7 February 2013 Received in revised form 22 March 2013 Accepted 27 March 2013 Available online 23 April 2013
Keywords:
Treatment planning systems Dosimetry audit
Dose calculation algorithms
a b s t r a c t
Background and purpose:The Medical Physics Division of the Portuguese Physics Society (DFM_SPF) in collaboration with the IAEA, carried out a national auditing project in radiotherapy, between September 2011 and April 2012. The objective of this audit was to ensure the optimal usage of treatment planning systems. The national results are presented in this paper.
Material and methods:The audit methodology simulated all steps of external beam radiotherapy
work-flow, from image acquisition to treatment planning and dose delivery. A thorax CIRS phantom lend by IAEA was used in 8 planning test-cases for photon beams corresponding to 15 measuring points (33 point dose results, including individualfields in multi-field test cases and 5 sum results) in different phantom materials covering a set of typical clinical delivery techniques in 3D Conformal Radiotherapy.
Results:All 24 radiotherapy centers in Portugal have participated. 50 photon beams with energies 4
e18 MV have been audited using 25 linear accelerators and 32 calculation algorithms.
In general a very good consistency was observed for the same type of algorithm in all centres and for each beam quality.
*Corresponding author. Tel.:þ351 239 400346; fax:þ351 239 484317. E-mail addresses: mclopes@ipocoimbra.min-saude.pt, mdcarmolopes@ gmail.com(M.C. Lopes).
Contents lists available atSciVerse ScienceDirect
Physica Medica
j o u r n a l h o m e p a g e : h t t p : / / w w w . p h y s i c a m e d i c a . c o m
Conclusions:The overall results confirmed that the national status of TPS calculations and dose delivery for 3D conformal radiotherapy is generally acceptable with no major causes for concern. This project contributed to the strengthening of the cooperation between the centres and professionals, paving the way to further national collaborations.
Ó2013 Associazione Italiana di Fisica Medica. Published by Elsevier Ltd. All rights reserved.
Introduction
According to accident and incident international reporting da-tabases in radiotherapy, treatment planning system (TPS) related occurrences are among the main sources of errors[1].
In line with its long history in dosimetry auditing, the Interna-tional Atomic Energy Agency (IAEA) promoted the present project on TPS audit with the purpose of ensuring improved and safer practices in radiotherapy.
The details of the project design were published by the IAEA. The comprehensive IAEA document on acceptance testing, commissioning and QA of TPSs, published as Technical Reports Series No. 430[2], was further focused on dose computation veri-fication tests to meet the practical needs of common users namely in small hospitals with reduced staff[3].
In the present version the test-cases cover a range of typical delivery techniques in three-dimensional conformal radiotherapy (3D-CRT) with photon beams that have been chosen for TPS commissioning according to the recommendations of IAEA.
After a pilot study to test the audit design[4], the Baltic States, Hungary, Serbia[5], Slovakia and Poland have conducted national TPS audits with the IAEA assistance, before Portugal has done it[6]. The adopted methodology uses an anthropomorphic phantom eCIRS thorax 002 LFC (CIRS Inc., Norfolk, Virginia)eand follows the radiation treatment sequential steps from image acquisition to treatment delivery, including image transfer and planning process, in an end-to-end approach.
According to the proposed methodology the DFM_SPF was recognized as the national auditing organization in Portugal. The na-tional coordinator traveled through all 24 RT centres with the phan-tom to carry out the audit between November 2011 and April 2012.
The project implementation phases included: i) Individual centres application in a volunteer basiseSeptember and October 2011; ii) First round of the audit through the 24 participating centres: performance of two phantom scans (thefirst one for CT to RED (relative electron density) conversion purposes and the second one for planning the test cases)eNovember and December 2011; iii) Second round of the audit: performance of the audit measure-ments in each centre after that centre had calculated the test cases plans for the different energies and algorithms used in its clinical practiceeJanuaryeMarch 2012. The irradiation of the test cases started with a dose intercomparison between the dosimetric reference system of the pilot centre and the local one; iv) Finally the evaluation workshop took place in June for the presentation of the national results and global discussion.
Materials and methods
National characterization
Portugal is the westernmost country in Europe and includes also as national territory the Atlantic archipelagos of the Azores and Madeira. The present population is around 10.5 million, oddly distributed among the 18 administrative districts[7]. In fact, if we add to the two more important metropolitan areas of Lisbon and Porto four other western coast districts we will sum up almost 70% of the population. In both insular territories there are less than
0.5 million people. In terms of radiotherapy health care, the rec-ommended ratio of 5e6 linear accelerators per million inhabitants would imply an installed park of around 60 treatment units.
As of April 2012, there were 44 linear accelerators installed in Portugal, including 2 units in Madeira and none in Azores. They pertain to 24 radiotherapy centres. 8 out of these 24 centres are public hospitals and own 18 of these linacs. The other 16 are private RT centres with one or two machines, each owning the remaining 26 treatment units. The installed treatment units park covers more than 70% of the national needs but the geographical distribution is not optimal[8]. During the audit project a questionnaire also pro-posed by the IAEA was answered by all RT centres about the typical characteristics of RT treatments and we concluded that at present more than 80% of the radiotherapy treatments offered to patients in Portugal can be classified as 3D-CRT treatments.
All 24 RT centres have volunteered to participate in the audit project. Due to logistic reasons it was decided that just one linear accelerator would be involved in the audit in each centre. The total number of linear accelerators used in the audit was 25 out of 44 because in one centre 2 linacs have been used. From the 25 linacs used in the audit, 15 are Varian machines, 6 Elekta and 4 Siemens. More than 90% of the linacs are less than 10 years old. The oldest unit was installed in the year 2000.
The 25 linacs corresponded to 50 high energy photon beams distributed as follows according to the nominal energy: 4 MV(1); 6 MV(24); 10 MV(6); 15 MV(14); 16 MV(2) and 18 MV(3). Just photon energies have been tested in the audit.
25 TPSs have been audited grouped from three main commer-cial names: 14 Eclipse (Varian); 9 XiO (CMS/Elekta) and 2 Oncentra (Nucletron/Elekta), corresponding to 32 tested algorithms. They have been grouped according to broad types for volume scatter integration and heterogeneity modeling without the reference to the particular version in each case. Thus we have labeled PB (Pencil Beam) those models that ignore the lateral transport of electrons and where inhomogeneity corrections are primarily based on the equivalent path length. Two TPSs have this kind of algorithm e Eclipse (from Varian) in 9 of the participating centres and Oncentra (from Nucletron/Elekta) in 2 centres. The other algorithmse Ana-lytic Anisotropic Algorithm, AAA (in Eclipse) in 9 centres; Super-position and Fast SuperSuper-position (in XiO/Elekta) in 7 centres and Collapsed Cone, CC (in Oncentra) in 1 centre e correspond to models that in some extent incorporate the lateral transport of electrons. These two kinds of models will be further referred in this work as Type A and Type B algorithms, respectively, following the terminology used in Ref.[9].
Audit phases
Pilot centre audit
The pilot centre was audited with the presence of the IAEA expert. Two scans of the CIRS phantom have been done in the local CT-scanner (Somaton Sensation Open, from Siemens), according to the IAEA methodology. After the planning of the 8 test cases, the corresponding irradiations for 6 and 15 MV in an Oncor Avant-Garde from Siemens linac have been performed.
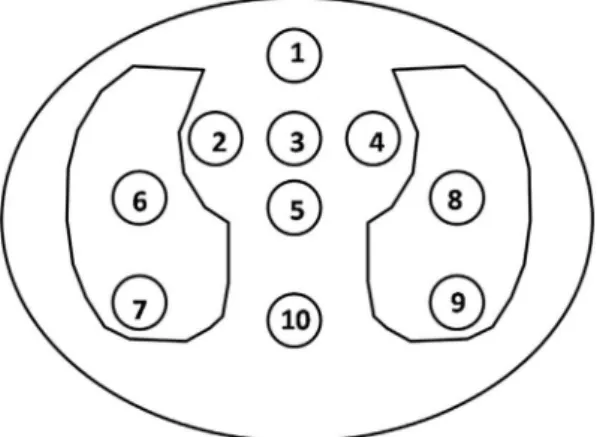
dosimetric reference system (in the sense of IAEA TRS 398[10]), composed by a Farmer type chamber (30013 e 0046, PTW-Freiburg) and a UNIDOS 10370 electrometer also from PTW, Frei-burg. For this comparison the point 3 in Test Case 1 has been used (seeFig. 1). This corresponds to a setup of SSD¼100 cm and a 1010 cm2
field size with point 3 at 7 cm depth and located in a homogeneous region of plastic water within the CIRS phantom. This dose comparison aimed at verifying the dose calibration ac-curacy of the pilot reference dosimetric system in order to enable its assignment as the national dosimetric reference within this project.
CT scans of the CIRS phantom
The IAEA methodology included two scans of the CIRS phantom. For thefirst scan 6 holes in the phantom werefilled with 6 inserts of reference materials corresponding to the known relative electron densities (RED), as given inTable 1. A seventh hole was left empty to correspond to air, in the lung phantom region.
For the second scan of the phantom all the standard inserts have been placed in the corresponding holes. This second scan consti-tuted the basis for planning the test cases.
The relationship between the numbers (read in the CT-scanner monitor) and the REDs was compared with the conver-sion curve CT-to-RED included in the TPS. The acceptance criterion was20 HU according to Ref.[2]. This constituted one of the non-dosimetric tests. The other non-non-dosimetric test was made in order to check the accuracy of the measurement distances before and after the image transfer from the CT-scanner to the TPS, and also after plotting the central phantom slice.
Irradiation of the test cases
As it was mentioned above, the TPS audit in Portugal was con-ducted by the national coordinator including two rounds through the participating centres. After thefirst round (where the CT scans have been performed) each centre was given sufficient time for planning the eight test cases summarized inTable 2, in terms of each test objectives.Figure 1shows a representation of the central
slice of the CIRS phantom where the locations and corresponding labels of the ten possible insertion points for the ionization chamber are presented. The adopted agreement criterion for each point dose was derived from TRS-430[2]with the normalization to the reference dose point for each test case, according to:
D
½% ¼ 100*ðDcal DmeasÞ=Dmeas;ref (1)whereDmeas,DcalandDmeas,refare respectively the measured dose, the TPS calculated dose and the dose value measured at the refer-ence point specified for each test case. The need for referrefer-ence point is dictated by the limited number of measurements points available in CIRS phantom (this is to follow TECDOC 1540[11]for estimation of deviations). The agreement criteria take into account the complexity of test cases and varied from 2% for the calibration test case (Test Case 1, point 3) to 5% for Test Case 6 corresponding to measurements in lung in the penumbra region (point 7) and in bone belowfield blocks (point 10). All 33 dose results are labeled in Table 3where the corresponding agreement criteria are presented.
Figure 1.Representation of the central slice of the CIRS phantom with location and corresponding labels for the dose measuring points. The phantom materials corre-spond to: points 1e5, plastic water; points 6e9, lung and point 10, bone.
Table 1
Relative electron densities of reference materials inserts for the CIRS phantom.
Insert material Relative electron density
Lung substitute 0.207
Adipose substitute 0.949
Water (a syringefilled with water) 1
Muscle substitute 1.042
Bone substitute 1.506
Dense bone substitute 2.005
Table 2
List of the objectives of the 8 test-cases including the labels of the 10 measuring points. Test case Measuring points Test objectives
1 3, 9, 10 Testing for referencefield based on CT data 2 1 Oblique incidence, wedge, lack of scattering
and tangentialfields
3 3 Significant blocking of thefield corners
4 5, 6, 10 Fourfield box; dose per incidence; coach absorption 5 2, 7 Automatic expansion and customized blocking 6 3, 7, 10 Oblique incidence with irregularfield and blocking
the centre of thefield
7 5 Threefields, two wedge-paired, asymmetric collimation 8 5 Non coplanar beams with couch and collimator rotation
Table 3
Labels for the 33 dose results and corresponding agreement criteria.
Case/Point/Field Label of dose results Agreement criteria (%)
C1.P3 1 2
C1.P9 2 4
C1.P10 3 3
C2.P1 4 3
C3.P3 5 3
C4.P5.F1 6 2
C4.P5.F2 7 3
C4.P5.F3 8 3
C4.P5.F4 9 3
C4.P5.SUM 10 3
C4.P6.F1 11 4
C4.P6.F2 12 3
C4.P6.F3 13 4
C4.P6.F4 14 3
C4.P6.SUM 15 4
C4.P10.F1 16 3
C4.P10.F2 17 3
C4.P10.F3 18 3
C4.P10.F4 19 4
C4.P10.SUM 20 3
C5.P2 21 3
C5.P7 22 4
C6.P3 23 3
C6.P7 24 5
C6.P10 25 5
C7.P5.F1 26 2
C7.P5.F2 27 4
C7.P5.F3 28 4
C7.P5.SUM 29 3
C8.P5.F1 30 3
C8.P5.F2 31 3
C8.P5.F3 32 3
It was assumed that the measurements are conducted in small water cavities within the various inserts in order to derive the absorbed dose to water from ionization chamber measurements. The agreement criteria also include the difference between perturbation factors caused by the ion chamber in these materials relative to that of water.
Each centre was given an option to use one or more algorithms included in the local TPS(s) depending on the clinical routine. Any doubts and questions have been addressed in an open collaboration with the national coordinator, during the planning stage.
Apart from the 8 test cases also some benchmark input data (according to the Radiological Physics Center (RPC) standard data acceptation[12e14]) supplied by the IAEA for each linac make and energy, namely wedge factors (WF) and total scatter correction fac-tors (Sc,p) for a wide range offield sizes corresponding to reference setups in water have been taken as the reference. These input data corresponded to measurements on 5 Varian HE, 5 Elekta Synergy and 5 Siemens Primus accelerators produced between 2006 and 2011 and averaged for each accelerator type. These setups could be reproduced in the TPSs and the calculated input beam parameters compared with the reference input data for each beam quality.
In each centre the irradiations were always preceded by the dose comparison between the reference dosimetric system of the pilot centre and the local reference system for the beam qualities to be audited. Point 3 of Test-Case 1 was used for this dose comparison.
The dosimetric daily quality control tests results have not been taken into account. Nevertheless all centres have reported that they were within tolerance (2e3% depending on the centre) in the audit day.
Results
Dose comparison
The dose comparison between the reference dosimetric system from the pilot centre and the one from the IAEA expert was within 0.2% for 6 and 15 MV beams. This result conferred the status of na-tional reference for the dosimetric audit to the reference dosimetric system from the pilot centre that has then traveled around the participating centres where the audit started by the dose comparison with the local reference dosimetric system. All 50 beam dose cali-brations were within 1.5 and 2.2% (average of 0.140.8%) when compared with the pilot centre measurement (Test Case 1, point 3). Different types of ionization chamberse11 Farmer type chambers from PTW; 5 Farmer type chambers from IBA and 8 small thimble chambers of 0.125 cc from PTWewith corresponding electrometers constituted the local reference system in each centre. 9 out of 24 of the systems had a calibration certificate from the Portuguese SSDL, 6 have been calibrated at PTW, Freiburg and 3 in IBA laboratories. No correlation was found with chamber type nor with the origin of the calibration.
TPS input data check
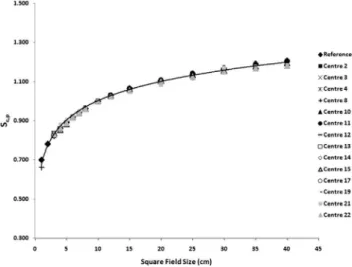
Generally a very good consistency with the referred benchmark data supplied by the IAEA was shown for all linac makes and beam energies, concerning both output factors (Sc,p) and wedge factors (WF). Some exceptions have been investigated, explained or corrected. InFig. 2theSc,pare shown for 6 MV in Varian machines. Four-teen centres have got this beam/machine combination and as it can be seen the calculatedSc,pare all within the stipulated3% toler-ance from the reference data. The same pattern has been observed for the other energies and linac makes. InFig. 3another example is given, concerning 60 wedge factors (WF) for 15 MV in Elekta machines. There werefive centres with this beam/machine com-bination. As it can be seen the results from two centres deviate from
tolerance when compared with the reference data. Nevertheless the causes for the observed deviations were different. For centre 1 the dependence of WF withfield size is the same as for the refer-ence data and it was concluded that the shift towards higher values came from the physical characteristics of the 60-wedge in centre 1 that were different from the corresponding to the benchmark data. In fact also for Varian machines similar differences have been identified in two other participating centres where systematic de-viations of 9.5% (for 15WF) and 13.5% (for 30 WF) have been observed and attributed to physical wedges corresponding to different part numbers within Varian references.
The deviations observed in Fig. 3 for centre 20 were not explained by that reason. Theflat behavior observed in the WFs in 15 MV has also been observed for the other energies (6 and 10 MV)
Figure 2.Total scatter correction factors (Sc,p) for 6 MV in Varian linear accelerators. The reference data was provided by the IAEA and corresponds to measurements on 5 Varian HE accelerators produced between 2006 and 2011 and averaged. The error bars correspond to3% tolerance from reference values for eachfield size. All 14 centres with this type of linac and beam energy have calculatedSc,pfor the samefield sizes and using the specified setup (Sc,pat SAD¼100 cm, 10 cm depth in water).
and inSc,pvalues for this centre. It was concluded that the water phantom used in the TPS for calculating these basic input data in this centre was too small preventing the full lateral and back scattering to be taken into account. The replacement of the virtual water phantom by a larger one led to corrected values within tolerance.
Non-dosimetric tests
From the 24 CT scanners that entered the audit, most of them were RT dedicated scanners. The majority of the centres used a constant kVp value for the planning CTs and a customized CT to RED curve. Nevertheless a general failure of CT to RED conversion has been observed in bone (92% failures) and dense bone (75% failures) which was probably due to the use of different reference materials for CT calibration. The weak influence of this kind of deviations in dose calculations was verified in one centre where a study with different CT-to-RED curves has been performed, confirming previ-ous published results[15]. InFig. 4the audit measurements and corresponding calibration curve (2011) are compared with the in-ternal curve used in that centre since 2001 where a different CIRS phantom model had been used for CT calibration. The deviations in dense bone were justified by the extrapolation of the old curve in the high density region. Also the different shapes, sizes and com-positions of the two CIRS phantoms could contribute to the re-ported deviations. Nevertheless dose differences of just up to 0.5% were found when the dose distributions for Test-Case 4 (box technique) were compared using the old and the new CT-to-RED curves (in a 2D dose difference analysis). Despite the confirmed reduced influence in dose calculations, most centers have replaced
their internal conversion curves, using the new results obtained for bone and dense bone.
The Oncentra (Nucletron/Elekta) TPS has a unique feature con-cerning CT-to-RED conversion as it does not deal directly with electron densities. In this TPS the CT Hounsfield Units, or the manually specified density, are mapped to a list of typical tissue types. For each of these tissue types a lookup table exists containing the elemental composition and parameters describing the radio-logical properties for this elemental composition derived from Ref. [16]. Should the HU value fall between two tissue types, then these parameters will be interpolated. So for this TPS no possible curve adjustment was possible.
Dosimetric tests
In total globally, 68 sets of algorithm-beam combination were analyzed using the 8 test cases corresponding to 33 dose results for each set, including individualfields in multi-field test cases and 5 sum results. The results were grouped by beam energy and the type of TPS algorithm as follows: 4 MV beam energy with 2 algorithms and corresponding to 2 participating centres; 6 MV beam energy with 6 algorithms and corresponding to 32 participating centres; 10 MV beam energy with 4 algorithms and corresponding to 8 participating centres; 15 MV beam energy with 6 algorithms and corresponding to 21 participating centres; 18 MV beam energy with 4 algorithms and corresponding to 5 participating centres. The details of this distribution are shown inTable 4.
Each point dose result has been evaluated for all 68 algorithm-beam combination sets. The larger number of failures per point dose result considering all 68 algorithm-beam sets corresponded to Test Case 4 (box technique) for individual incidencesemeasuring point 6 (lung) for the right-lateral incidence had 28/68 dose results out of the agreement criterion of3% and for point 10 (bone) for posterior incidence 22/68 measurements were recorded outside the tolerance level of3%. Fortunately, when the sum result for the four incidences (box-technique) was computed for these points the number of failures for individualfields almost canceled out (0 and 3 out of 68, respectively).
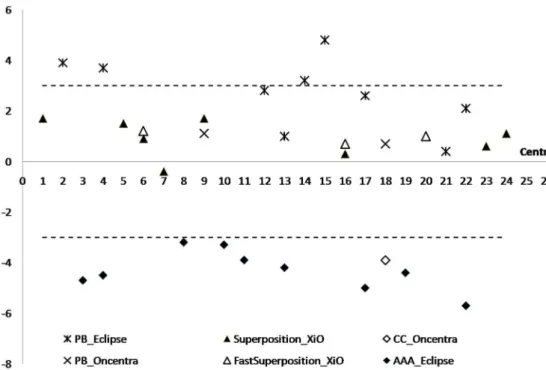
An interesting result from this kind of analysis is that the same pattern could be observed for the same type of algorithm regardless the participating centre, which gives good consistency to the different algorithm implementations in the various sites. This common pattern is documented inFig. 5where the results of Test Case 4 in 6 MV for point 6 (lung) and left-lateral incidence are presented. PB_Eclipse (Type A algorithm) failed by excess in 4 centres and AAA_Eclipse failed by default in all 9 centres together with CC_Oncentra in one centre, both algorithms of Type B. In fact, a positive deviation according to eq.(1)means that the TPS calcu-lated dose value is higher than the measured dose, leading to underdosage and vice-versa, a negative deviation means that the delivered dose is higher than the desired dose, leading to an overdosage. InFig. 5we can observe that all points corresponding
Figure 4.Comparison between the conversion curves CT-to-RED obtained in 2001 and in the present audit (2011) together with the audit measurements for one of the participating centres.
Table 4
Distribution of the different algorithms and number of centres per beam energy, including in total 68 algorithm-beam energy combination sets.
Energy (mV) TPS algorithm (number of centres)
4 AAA_Ecla(1) PB_Ecl (1)
6 AAA_Ecl (9) PB_Ecl (9) Spos_XiOb(8) F Spos_XiOc(3) PB_Oncd(2) CC_Onc (1)
10 AAA_Ecl (1) Spos_XiO (6) F Spos_XiO (2) PB_Onc (1)
15 AAA_Ecl (5) PB_Ecl (6) Spos_XiO (4) F Spos_XiO (1) PB_Onc (2) CC_Onc (1)
18 AAA_Ecl (2) PB_Ecl (1) Spos_XiO (1) F Spos_XiO (1)
aEcl¼Eclipse. bSpos¼Superposition. c F Spos¼Fast Superposition. d Onc
Figure 5.Results of the percentage deviations between measured and calculated doses, normalized to the measured dose in point 5 in each of the 24 centres, for left-lateral incidence in point 6 (lung) and Test Case 4, for 6 MV. Different algorithms are represented by different symbols. Horizontal dashed lines represent the agreement criterion of 3% for this point dose.
to Type A algorithms (including PB_Eclipse and PB_Oncentra) are above the horizontal axis. For XiO algorithms (Superposition and Fast Superposition), both of Type B, all points except one are above the horizontal axis and all are within tolerance regardless the participating centre, for this point dose result.
The measurements in bone (point 10, both in Test Case 1 and Test Case 4) revealed a global trend to overdosage, meaning that all al-gorithms calculated a lower dose than the measured one. In Test Case 1 the average deviation in bone taking into account all 68 combina-tion sets was 1.51.4% and for the sum of all four beam incidences in bone in Test Case 4 the average deviation was 1.31.3%. The dose underprediction inside high-density materials for high-energy X-ray beams is due to the fact that in general the dose calculation algo-rithms cannot accurately model the increase of the interaction co-efficient inside the bone and only account for the decreased transmission through the high-density medium[17].
Compatible (in the sense that the same tendency was observed) but not directly comparable results (because the setups or purposes are different) can be found in literature concerning dose calcu-lations in low and high density heterogeneities with different setups and both experimental and calculated arrangements[18,19]. A global picture of the results is given in Fig. 6 in terms of average deviation over the 68 algorithm-beam energy sets and the corresponding standard deviation for each point dose. For each point also the agreement criterion is indicated, according toTable 3. As it can be seen the overall results are good, meaning that the vast majority of all bars are inside the agreement criteria limits. Nevertheless, there are some algorithm-beam energy sets signifi -cantly out of tolerance for some dose points: in lungeC1.P9 (label 2), C4.P6.F3 (label 13), C4.P6.F4 (label 14) and C6.P7 (label 24), and in boneeC4.P10.F3 (label 18). It is worthwhile to have a deeper look into these deviations so they have been unfolded into low energy (4 and 6 MV), medium energy (10 MV) and high energy (15 and 18 MV) groups and also by Type A and Type B algorithms.
The summary of these results is presented in Table 5. The conclusion was that Type A algorithms in all energies were the major contributors for the larger deviations. Nevertheless, for the posterior field in bone (C4.P10.F3) Type B algorithms fail more. The shadowing used in the table helps to realize that higher energies do worse than lower ones, also in agreement with published results[17e19].
The Collapsed Cone algorithm in Oncentra TPS (CC_Oncentra) deserves a specific mention because it is the algorithm that pre-sented the higher number of failures, namely for 15 MVe19 failures over the 33 dose points results (in 6 MV, for CC algorithm just 8 dose points failed). It must be stressed that the IAEA methodology was developed for the systems which report dose to a water cavity inside
a medium. CC algorithm in Oncentra TPS reports dose to media so the results would at least need a correction through the ratio of stopping powers material/water which would imply the knowledge about the atomic composition of the phantom materials to enable a more ac-curate inclusion in the TPS internal conversion table.
Conclusions
The IAEA TPS audit project carried out in Portugal between September 2011 and April 2012 had 100% of participation of the radiotherapy centres in the country. It was an important initiative to strengthening the scientific relationships among the medical physics national community.
The overall results revealed that the national status of TPS cal-culations and dose delivery for 3D conformal radiotherapy was globally within acceptable standards with no major causes for concern.
The dose comparison for the audited 50 photon beam energies was remarkably good with an average value for the percentage difference from pilot of 0.140.8% (min: 2.2% and máx: 1.5%). In general, a very good consistency was observed for the same type of algorithm in all centres and for each photon beam energy. The known calculation limitations of TPS algorithms in heteroge-neities have been confirmed, namely for dose calculations in lung and bone. From all 24 centres just 6 (25%) still uses just Type A algorithms. Whenever more than one algorithm type is available at the local TPS there is a general trend to gradually move to more advanced algorithms in the clinical practice.
This tendency will probably be intensified as the present pattern characterized by more than 80% of the RT treatments being clas-sified as 3D-CRT is rapidly changing towards more modern and sophisticated techniques (IMRT, arc delivery techniques, stereotaxy, etc.), which enhances the need for corresponding extension of this kind of auditing project in a near future.
Conflict of interest statement
All authors disclose any financial and personal relationships with other people or organizations that could inappropriately in-fluence (bias) their work.
Acknowledgments
To all participants in the audit; to the IAEA for lending the phantom; to the Medical Physics Division of the Portuguese Physics Society (DFM_SPF) for supporting the project.
Table 5
Average deviations (D%) and corresponding standard deviations (s%) for thefive worse dose points for three beam energy groups (4/6 MV, 10 MV and 15/18 MV) organized by
References
[1] ICRP Publication 112: Preventing accidental exposures from new external beam radiation therapy technologies. Elsevier; 2010.
[2] IAEA Technical Report Series 430. Commissioning and quality assurance of comput-erized planning systems for radiation treatment of cancer. Vienna: IAEA; 2005. [3] IAEA TECDOC 1583. Commissioning of radiotherapy treatment planning systems:
testing for typical external beam treatment techniques. Vienna: IAEA; 2008. [4] Gershkevitsh E, Schmidt R, Velez G, Miller D, Korf E, Yip F, et al. Dosimetric
verification of radiotherapy treatment planning systems: results of IAEA pilot study. Radiother Oncol 2009;89:338e46.
[5] Rutonjski L, Petrovic B, Bauca M, Teodorovic M,Cudi c O. Dosimetric verifi -cation of radiotherapy treatment planning systems in Serbia: national audit. Radiat Oncol 2012;7:155.http://dx.doi.org/10.1186/1748-717X-7-155. [6] Gershkevitsh E, Peshnyak C, Petrovic B, J Grezdo, Chelminski K, Lopes MC,
et al. Results of the IAEA project on TPS audit in radiotherapy in Europe. Radiother Oncol 2012;103(Suppl. 1):S138.
[7] Censos 2011. Instituto Nacional de Estatística; 19 July 2011.
[8] ERS, Acesso. Concorrência e Qualidade no Setor da Prestação de Cuidados de Saúde de Radioterapia Externa July 2012.
[9] Knoos T, Wieslander E, Cozzi L, Brink C, Fogliata A, Albers D, et al. Comparison of dose calculation algorithms for treatment planning in external photon beam therapy for clinical situations. Phys Med Biol 2006;51:5785e807. [10] IAEA Technical Report Series 398. Absorbed dose determination in external
beam radiotherapy. An international code of practice for dosimetry based on standards of absorbed dose to water. Vienna: IAEA; 2000.
[11] IAEA TECDOC 1540. Specification and acceptance testing of radiotherapy treatment planning systems. Vienna: IAEA; 2007.
[12] Cho SH, Ibbott GS. Reference photon dosimetry data: a preliminary study of in-air off-axis factor, percentage depth dose, and output factor of the Siemens Primus linear accelerator. J Appl Clin Med Phys 2003;4(4):300e6.
[13] Lowenstein J, Kry S, Molineu A, Alvarez P, Aguirre J, Summers P, et al. High-energy photon standard dosimetry data: a quality assurance tool. Med Phys 2012;39(6):3754.
[14] Followill DS, Kry SF, Qin L, Lowenstein J, Molineu A, Alvarez P, et al. The Radiological Physics Center’s standard dataset for small field size output factors. J Appl Clin Med Phys 2012;13(5):282e9.
[15] Chua JC, Nia B, Krizc R, Saxena VA. Applications of simulator computed to-mography number for photon dose calculations during radiotherapy treat-ment planning. Radiother Oncol 2000;55:65e73.
[16] Knöös T, Nilsson M, Ahlgren L. A method for conversion of Hounsfield number to electron density and prediction of macroscopic pair production cross-sec-tions. Radiother Oncol 1986;5:337e45.
[17] Carrasco P, Jornet N, Duch MA, Panettieri V, Weber L, Eudaldo T, et al. Com-parison of dose calculation algorithms in slab phantoms with cortical bone equivalent heterogeneities. Med Phys 2007;34(8):3323e33.
[18] Aspradakis M, Morrison R, Richmond N, Steele A. Experimental verification of convolution/superposition photon dose calculations for radiotherapy treat-ment planning. Phys Med Biol 2003;48:2873e93.