Application of multivariate techniques in the evaluation of pure lines of beans
Aplicação de técnicas multivariadas na avaliação de linhas puras de feijão
Rodolfo SchmitI Rita Carolina de MeloI Thayse Cristine Vieira PereiraI Mattheus BeckI Altamir Frederico GuidolinI Jefferson Luís Meirelles CoimbraI*
ISSN 1678-4596
ABSTRACT
The objective of this study was to apply multivariate techniques, canonical discriminant analysis, and multivariate contrasts, indicating the most favorable inferences in the evaluation of pure lines of beans. The study was conducted at
the experimental field of the Institute for Breeding and Molecular Genetics, in Lages, SC, Brazil. The experiment was composed of 24
pure lines of beans from the Santa Catarina test of cultivars. Plant height, numbers of pods and grains per plant, and stem diameter
were the variables measured. The complete randomized block
design was used with four replications. The data were subjected to multivariate analysis of variance, canonical discriminant analysis,
multivariate contrasts and univariate contrasts. The first canonical
discriminant function has captured 81% of the total variation in the data. The Scott-Knott test showed two groups of inbred lines at
the average –of scores of the first canonical discriminant function. It was considered that testing hypotheses with the canonical scores
may result in loss of information obtained from the original data.
Multivariate contrasts indicated differences within the group
formed by the Scott-Knott test. The canonical discriminant analysis and multivariate contrasts are excellent techniques to be combined in the multivariate assessment, being used to explore and test hypotheses, respectively.
Key words: Phaseolus vulgaris L., multivariate analysis of variance, multivariate contrasts, canonical discriminant analysis.
RESUMO
O objetivo deste estudo foi aplicar técnicas multivariadas (análise discriminante canônica e contrastes multivariados) indicando as inferências mais vantajosas na
avaliação de linhas puras de feijão. O estudo foi conduzido na área experimental do Instituto de Melhoramento e Genética Molecular em Lages, SC. O experimento foi composto por 24
linhas puras de feijão provenientes do ensaio catarinense de cultivares. Os caracteres mensurados foram: estatura da planta, números de legumes e grãos por planta e diâmetro do caule. Foi
usado o delineamento experimental em blocos casualizados,
com quatro repetições. Os dados foram submetidos à análise de variância multivariada, análise discriminante canônica, contrastes multivariados e univariados. A primeira função linear discriminante canônica captou 81% da variação total contida nos dados. O teste de Scott-Knott formou dois grupos de linhas puras na média dos escores da primeira função linear discriminante canônica. Considera-se que testar as hipóteses com os escores canônicos pode causar perda de informações valiosas obtidas pelos dados originais. Os contrastes multivariados evidenciaram diferenças dentro do grupo formado pelo teste de Scott-Knott. A análise discriminante canônica e os contrastes multivariados são técnicas excelentes para serem combinadas na avaliação multivariada, sendo efetuadas para explorar e testar hipóteses, respectivamente.
Palavras-chave: Phaseolus vulgaris L., análise de variância multivariada, contrastes multivariados, análise discriminante canônica.
INTRODUCTION
Many response variables are frequently observed in the plot from the same experimental design. Thus, all response variables can be simultaneously subjected to the same statistical analysis (multivariate analysis). The continuous development of computer technology, which was almost unimaginable a few decades ago, has facilitated its application and attracted a growing interest in the use of multivariate
IPrograma de Pós-graduação em Ciências Agrárias, Departamento de Agronomia, Instituto de Melhoramento e Genética Molecular da
UDESC (IMEGEM), Universidade do Estado de Santa Catarina (UDESC), Av. Camões, 2090, Conta Dinheiro, 88520 -000, Lages, SC, Brasil. E-mail: [email protected]. *Corresponding author.
techniques (FERREIRA, 2008). Multivariate analysis
of variance identifies the phenomenon of mutual
dependence between response variables. Such information is not covered by the univariate analysis of variance (HAIR et al., 2007).
Multivariate analysis of variance is only the initial stage in the evaluation of a data set.
When mean vectors of treatment have significant
variance, deriving complete inferences with multivariate techniques is necessary. These can be
classified in two main purposes: discrimination of
treatments and contrasts of mean vectors of interest. The discrimination techniques are used to classify treatments, in order to predict, explore, and describe possible hypotheses (AFIFI, MAY & CLARK, 2003). In addition, the second analysis contributes to test the
significance of hypotheses of interest, and can be
aided by investigation of results.
Canonical discriminant analysis is an example of multivariate technique that represents the multivariate dispersion of qualitative explanatory variables, e.g., pure lines of beans. Transformation of original variables in new abstract variables that form a canonical discriminant linear function is the principle of the technique. The experimental design is considered in the analysis, partitioning the matrix information according to the existing treatments (SIVAKUMAR et al., 2013). The technique aims to reduce the number of response variables facilitating inferences to be made and incorporating the maximum
variations in the first canonical discriminant linear
function. The technique is much applied in various
fields of science to explore hypotheses (ZHAO &
MCLEAN, 2000; ROSÁRIO et al., 2007).
The multivariate contrast technique allows testing hypotheses, not to reduce data dimension, but to work with all existing variations and compare
specific treatments. Technique partitions the treatment
matrix (H) only for the elements under comparison, and calculates a value with multivariate distribution, which can also be done by different statistical methods such as (Wilks), maximum root (Roy), and Trace (Pillai; Hotteling-Lawley). By using the
standardized canonical coefficients, the contribution
of response variables can be determined in each contrast (RENCHER, 2002). Although application of the multivariate contrasts is simple, they are not
commonly used by the scientific community in Brazil.
Assays with pure lines of beans are frequently performed to select and obtain new productive cultivars. Discrimination of pure lines starting from multivariate techniques allows to detect the phenotypic variability for all the characters
of agronomic interest (STÄHLEIN et al., 2011). Thus, the agronomic ideotype can be obtained by simultaneous selection of grain yield, characters related to architecture of the ideal plant, resistance to abiotic and biotic stress factors, and nutritional
quality of the final product.
The objective of this study was to apply multivariate techniques, canonical discriminant analysis, and multivariate contrasts, and indicate the most advantageous inferences in the evaluation of pure lines of beans.
MATERIALS AND METHODS
This study was conducted in the experimental area of the Institute for Breeding and Molecular Genetics (UDESC, IMEGEM; Lages, SC, Brazil; 27º 48’ S and 50º 19’ W). This site is characterized by a wet mesothermal climate and mild summer. The altitude in Lages is 930 meters. The soil
is classified as aluminic Humic Cambisol. The relief
is undulating and the soil texture is clayey, with mean density of about 1.35g cm-3.
The data are from an experiment formed by 24 pure lines of beans, which were evaluated in the farm crop of 2009/10. The experimental unit consisted of four 4-m long rows. Lines had a
0.45-m floor space between them. The seeding density
was 15 seeds per linear meter (spaced evenly). Cultivation treatments were applied according to technical recommendations for bean crop. The useful area consisted of two central lines of the parcel, excluding 50cm in the border between plants. Five plants were collected from the useful area to measure the agronomic characters: plant height (in cm), numbers of pods and grains per plant, and stem diameter (in mm). A randomized block design was used with four replications.
The statistical model (matrix notation) is
represented by: Y = Xβ + Zu + ɛ, where Y corresponds
to the measurement vector of the four variables
analyzed in the parcels; X is the fixed-factor incidence matrix adopted in the design; β is the fixed-parameter vector, i.e., the effect of pure lines of beans; Z is
the random-factor incidence matrix adopted in the design; u is the random-parameter vector that refers
to the block effect; ɛ is the experimental-error vector
(RENCHER, 2001).
discrimination rate (PDR) was calculated from the
product of standardized canonical coefficients and
canonical correlation (BARETTA et al., 2008). One canonical mean score was calculated for each treatment (KHATTREE & NAIK, 2000). The mean
scores of the first canonical discriminant linear
function were compared by the Scott-Knott test at
5%-error probability (CRUZ-CASTILLO et al.,
1994). Graphic dispersion analysis was performed
from the canonical scores of the first two canonical
discriminant linear functions. The canonical discriminant analysis was performed using the statistical SAS 9.2 software and the CANDISC (SAS Institute, 2009) procedure.
The experimental data were subjected to multivariate contrasts analysis for comparison between pure lines or groups of pure lines of beans. The hypotheses of multivariate contrasts were tested by the Wilks’ Lambda statistics with 5%-error probability. In
each contrast, standardized canonical coefficients were
calculated, informing the contribution of each response variable. The multivariate contrasts were carried out in the SAS 9.2 software using the GLM (SAS Institute, 2009) procedure.
RESULTS AND DISCUSSION
The multivariate analysis of variance
resulted in a significant variation (P
≤
0.05) for thepure line factor, when applied to the Wilks’ Lambda test (Table 1). Thus, difference was observed between at least two pure lines of beans. Rejection of the null hypothesis suggested questions about the origin of difference between pure lines and which agronomic characters contributed to this result (FERREIRA, 2006). Therefore, use of more accurate multivariate techniques is necessary for a full interpretation of results.
The first canonical discriminant linear
function captured 81% of the accumulated variance
in the eigenvalues, being significant at 5%-error
probability in the F test (Table 1). According to
CRUZ et al. (2012), satisfactory interpretations of
the variability shown by the treatments are obtained with 80% of the cumulative variance. Thus, only one dimension should identify the contribution of agronomic characters and discriminate the pure lines of beans. The plant height character showed a value of 1.42 for the TDP, exhibiting the highest discriminant potential in the pure lines of beans (MALUCHE-BARETTA et al., 2006).
The 24 pure lines of beans were grouped
by the first canonical score using the Scott-Knott test
at 5%-error probability. This test showed differences between the pure line 10 in relation to the others
(Table 2). The univariate evaluation of the first
canonical score is performed when the cumulative variance is greater than 80%, and the multivariate difference between the pure lines of beans can
be then tested (CRUZ-CASTILLO et al., 1994; BARETTA et al., 2008). However, simplification of
the matrix information can be questioned regarding
its efficiency to test hypotheses, because exploring
hypotheses of interest is the only purpose of the use this multivariate technique (AFIFI et al., 2003).
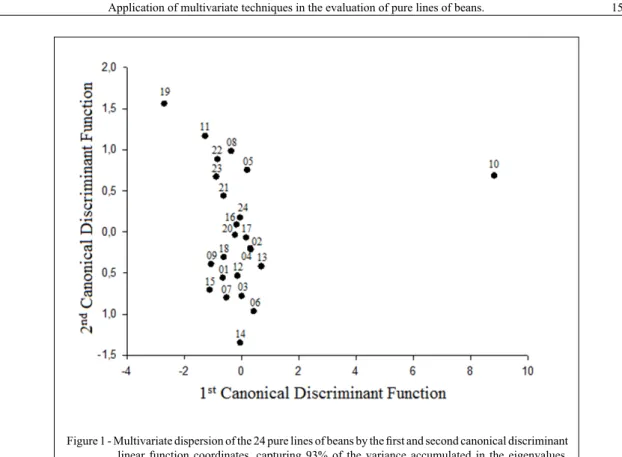
The multivariate dispersion of the 24 pure
lines of beans is illustrated by the scores for the first
and second canonical discriminant linear function, which together inform 93% of total variance (Figure 1). It is possible to visually perceive the discrepancy between pure line 10 and others, and
this statement is confirmed by the Scott-Knott
test (Table 2). However, it is possible to raise new hypotheses about pure lines if additional information is provided. For example, the values for the pure
lines 15 and 11 are close if only the first canonical
discriminant is considered, but they are distant by the second canonical score coordinates (Table 2; Figure 1). The canonical discriminant analysis with 81% of the variation resulted in incomplete results, and this can change discrimination of pure lines of beans.
The most appropriate technique for situation depends mainly on the research objectives. In general, the purpose of multivariate analysis is to simplify, i.e., summarize a large data set by means of a few parameters that describe the data set properly. The study of AMARANTE et al. (2006) was clearly an exploratory analysis that was conducted to identify the response variables (nutritional attributes) that contributed most to discriminate the bitter pit severity degrees in apple culture. However, testing the severity
levels of bitter pit by averaging the first canonical
score was not the goal of this study. In addition, they
refined a technique that possibly was not created to be
applied in such a way.
An evaluation performed by a scalar (canonical score) from the vector product may be
a fearful simplification. In addition, it does not
these variables becomes null (KHATTREE &
NAIK, 2000). Thus, comparing coefficients that are
supposedly independent is inconsistent.
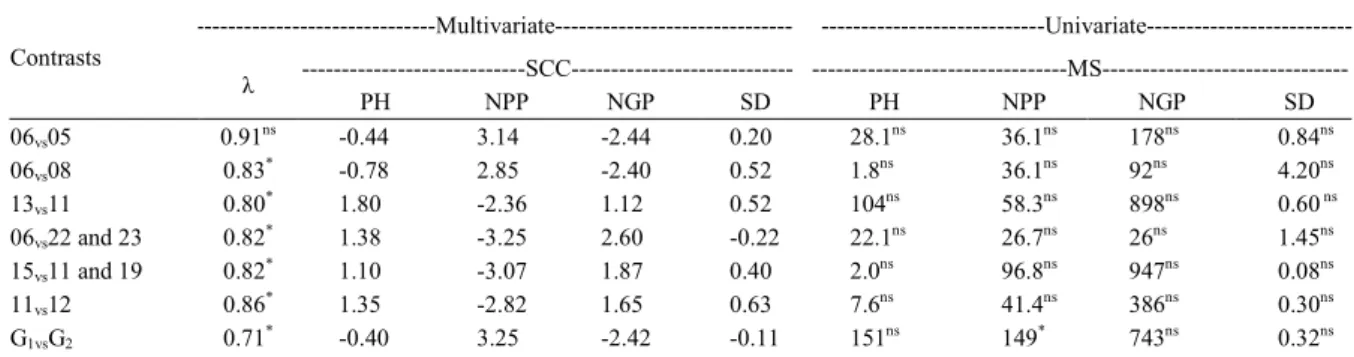
The multivariate contrasts shown above were strategically chosen to exemplify the additional information of this technique, and revealed differences
Table 1 - Analysis of multivariate variance for the 24 pure lines of beans using the Wilks' Lambda (λ) test; representability of the canonical discriminant linear functions (CDF) from the cumulative variance (CV) and F test; parallel discrimination rate for agronomic characters: plant height (PH), numbers of pods (NPP) and grains (NGP) per plant, and stem diameter (SD); UDESC-IMEGEM; Lages, SC, Brazil; 2016.
Causes of variation ---NDF--- ---DDF--- ---λ
---Pure line ---92--- ---263.73--- ---0.06*
---CDF CV (%) F PH (cm) NPP NGP SD (mm)
1st 81 3.05* 1.42 -1.06 0.06 0.01
2nd 93 1.20 ns -0.04 -0.02 -2.07 0.01
3rd 97 0.79 ns 0.11 -0.11 -0.48 0.37
4th 100 0.71ns -0.14 0.26 0.42 0.04
*Significant at 5%-error probability; nsNon significant at 5%-error probability; NDF: Numerator degrees of freedom; DDF: Denominator degrees of freedom.
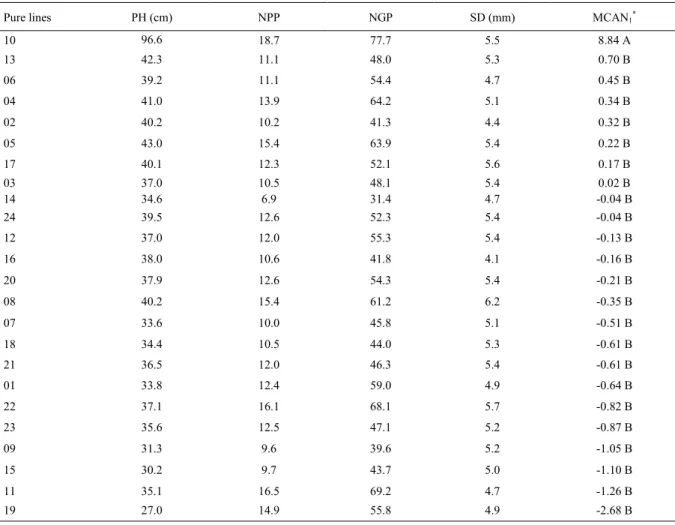
Table 2 - Mean values for the agronomic characters: plant height (PH), numbers of pods (NPP) and grains (NGP) per plant, and stem diameter (SD).Mean scores of the first canonical discriminant linear function (MCAN1) for the 24 pure lines of beans. UDESC-IMEGEM; Lages, SC, Brazil; 2016.
Pure lines PH (cm) NPP NGP SD (mm) MCAN1*
10 96.6 18.7 77.7 5.5 8.84 A
13 42.3 11.1 48.0 5.3 0.70 B
06 39.2 11.1 54.4 4.7 0.45 B
04 41.0 13.9 64.2 5.1 0.34 B
02 40.2 10.2 41.3 4.4 0.32 B
05 43.0 15.4 63.9 5.4 0.22 B
17 40.1 12.3 52.1 5.6 0.17 B
03 37.0 10.5 48.1 5.4 0.02 B
14 34.6 6.9 31.4 4.7 -0.04 B
24 39.5 12.6 52.3 5.4 -0.04 B
12 37.0 12.0 55.3 5.4 -0.13 B
16 38.0 10.6 41.8 4.1 -0.16 B
20 37.9 12.6 54.3 5.4 -0.21 B
08 40.2 15.4 61.2 6.2 -0.35 B
07 33.6 10.0 45.8 5.1 -0.51 B
18 34.4 10.5 44.0 5.3 -0.61 B
21 36.5 12.0 46.3 5.4 -0.61 B
01 33.8 12.4 59.0 4.9 -0.64 B
22 37.1 16.1 68.1 5.7 -0.82 B
23 35.6 12.5 47.1 5.2 -0.87 B
09 31.3 9.6 39.6 5.2 -1.05 B
15 30.2 9.7 43.7 5.0 -1.10 B
11 35.1 16.5 69.2 4.7 -1.26 B
19 27.0 14.9 55.8 4.9 -2.68 B
within the group formed by the Scott-Knott test (Table 3). This is contrary to what was observed in
the univariate contrasts, where significant differences
were not found at 5%-error probability. Therefore, these results can be explained by the set of agronomic characters whose information was not incorporated in the canonical scores. The use of mean comparison tests with the first canonical score may have caused the loss of valuable information in discriminating pure lines of beans.
After a careful examination of the canonical scores in the second canonical discriminant linear function (Figure 1), it is possible to suggest that two new groups of pure lines are formed. The upper points (2, 5, 8, 11, 16, 17, 20, 21, 22, 23, and 24) may characterize group 1 (G1) and the lower ones (1, 3, 4, 6, 7, 9, 12, 13, 14, 15, and 18) group 2 (G2).
In fact, a significant difference was detected between
the groups when this hypothesis was tested. This can be explained by the contribution of the number of pods per plant (3.25), i.e., this is the essentially discriminating character between the groups of pure lines tested (Table 3).
Canonical discriminant analysis was not advantageous for hypotheses testing in the evaluation of pure lines of beans. This analysis allows to suggest hypotheses about the pure lines which will be tested. Evaluation of distances based on the graph coordinates is subjective (STHÄLEIN et al., 2011).
E.g., pure line 6 shows a significant difference
in relation to pure line 23 when analyzed by the multivariate contrasts. Conversely, pure line 6 do not
show a significant difference in relation to pure line
5, although the distance is equal to that used in the previous comparison (Figure 1; Table 3). Therefore,
each multivariate technique has specific principles
that should be taken into account for a proper application. Knowing these principles is crucial for a researcher who intends to apply multivariate analysis techniques.
The multivariate contrasts technique was supposedly made to test hypotheses, and it can be an excellent alternative to supplement the canonical discriminant analysis. The multivariate contrasts
technique is available to researchers, being flexible
enough to test any combination between pure lines of
beans according to their interests (RENCHER, 2002).
The use of canonical coefficients allows inferring
about the contribution of each agronomic character for contrast. However, this information cannot be obtained using the Scott-Knott test.
These techniques can be used, for example, in value for cultivation and use (VCU) trials. The purpose of these trials is to compare each pure line with one or more commercial controls (usually more than one). Therefore, the multivariate contrast can be used before launching a cultivar for simultaneous comparison between a pure line and commercial controls, taking into account a set of agronomic characteristics of interest such as grain yield, cycle, plant diseases, nutritional quality of the grain, and any other crucial character.
CONCLUSION
The use of canonical discriminant analysis
to test hypotheses is not justifiable when other
appropriate methods such as the multivariate contrasts can be used. The canonical discriminant analysis and multivariate contrasts are excellent techniques to be combined in a multivariate evaluation, allowing
to detect the origin of significant variations and
contribution of response variables.
ACKNOWLEDGEMENTS
The Universidade do Estado de Santa Catarina (UDESC), Conselho Nacional de Desenvolvimento Científico e Tecnológico (CNPq) and the Fundação de Apoio à Pesquisa Científica e Tecnológica do Estado de Santa Catarina (FAPESC) for financial support in the development of this work.
REFERENCES
AFIFI, A. et al. Computer-aided multivariate analysis. 4.ed. Los Angeles: Chapman & Hall/CRC, 2003. 512p.
AMARANTE, C.V.T. de et al. Multivariate analysis of nutritional attributes associated with bitter pit in ‘Gala’ apples. Pesq Agropec Bras, v.41, n.5, p.841-846, 2006. Available from: <http://seer.sct. embrapa.br/index.php/pab/article/view/7214/4259>. Accessed: Feb. 24, 2013. doi: 10.1590/S0100-204X2006000500017.
BARETTA, D. et al. Análise multivariada de atributos microbiológicos e químicos do solo em florestas com Araucaria angustifolia. R Bras Ci Solo, v.32, p.2683-2691, 2008. Available from: <http://www.scielo.br/scielo.php?script=sci_arttext&pid =S0100-06832008000700011>. Accessed: Feb. 29, 2013. doi: 10.1590/S0100-06832008000700011.
CRUZ, C.D. et al. Modelos biométricos aplicados ao melhoramento genético. Viçosa, MG: UFV, 2012. 585 p.
CRUZ-CASTILHO, J.G. et al. Applications of canonical discriminant analysis in horticultural research. Hort Science, v.29. p.1115-1119, 1994. Available from: <http://hortsci.ashspublications. org/content/29/10/1115.full.pdf>. Accessed: Dec. 16, 2012.
FERREIRA, D.F. Estatística multivariada. Lavras: UFLA, 2008. 651p.
HAIR, J.F. et al. Análise multivariada de dados. São Paulo: Bookmam, 2007. 593p.
KHATTREE, R.; NAIK, D.N. Multivariate data reduction and discrimination with SAS software. Cary, NC: SAS Institute, 2000. 558p.
MALUCHE-BARETTA, C.R.D. et al. Análise multivariada de atributos do solo em sistemas convencional e orgânico de produção de maças. Pesq Agropec Bras, v.41, p.1531-1539, 2006.
RENCHER, A.C. Methods of multivariate analysis. 2.ed. Utah: Wiley-Interscience, 2002. 738p.
Table 3 -Pure lines and groups of pure lines of beans analyzed for multivariate contrasts by the Wilks' Lambda test (λ) and univariate contrasts by the F test. Standard canonical coefficients (SCC) and mean squares (MS) for the response variables: plant height (PH), numbers of pods (NPP) and grains per plant (NGP), and stem diameter (SD). UDESC-IMEGEM; Lages, SC, Brazil; 2016.
---Multivariate---
---Univariate---SCC--- ---MS---Contrasts
λ
PH NPP NGP SD PH NPP NGP SD
06vs05 0.91ns -0.44 3.14 -2.44 0.20 28.1ns 36.1ns 178ns 0.84ns
06vs08 0.83* -0.78 2.85 -2.40 0.52 1.8ns 36.1ns 92ns 4.20ns
13vs11 0.80* 1.80 -2.36 1.12 0.52 104ns 58.3ns 898ns 0.60 ns
06vs22 and 23 0.82* 1.38 -3.25 2.60 -0.22 22.1ns 26.7ns 26ns 1.45ns 15vs11 and 19 0.82* 1.10 -3.07 1.87 0.40 2.0ns 96.8ns 947ns 0.08ns
11vs12 0.86* 1.35 -2.82 1.65 0.63 7.6ns 41.4ns 386ns 0.30ns
G1vsG2 0.71* -0.40 3.25 -2.42 -0.11 151ns 149* 743ns 0.32ns
*Significant at 5%-error probability; nsNon significant at 5%-error probability; G
ROSÁRIO, M.F. et al. Canonical discriminant analysis applied to broiler chicken performance. Animal, v.2, n.3, p.419-424, 2007. Available from: <http://www.lce.esalq.usp.br/tadeu/Millor_ Silva_Coelho_Savino_Tadeu.pdf>. Accessed: Ago. 26, 2013. doi: 10.1017/S1751731107001012.
SAS INSTITUTE. SAS/STAT: user’s guide. Version 9.2. Cary, 2009. 7869p.
SIVAKUMAR, V. et al. Discrimination of Acacia seeds at species and subspecies levels using an image analyzer. For Sci Pract, v.15, n.4, p.253-260, 2013. Available from: <http://link.springer.
com/article/10.1007%2Fs11632-013-0414-4>. Accessed: Apr. 10, 2014. doi: 10.1007/s11632-013-0414-4.
STÄHLEIN, D. et al. Screening multivariado entre acessos e cultivares de feijão do grupo preto para utilização em blocos de cruzamento. Biotemas, v.24, n.1, p.95-103, 2011. Available from: <https://periodicos.ufsc.br/index.php/biotemas/article/view/18149>. Accessed: Apr. 16, 2013. doi:10.5007/2175-7925.2011v24n1p95.