CORRELATION BETWEEN AUDIOMETRIC PROFILE,
AGE AND WORKING TIME IN BUS DRIVERS
Correlação entre o peril audiométrico, idade
e o tempo de atividade em motoristas de ônibus
Raquel Fernanda Bisi (1), Jozeane Dias dos Santos Coifman (2), Maria Inês Dornelles da Costa Ferreira (3), Edson Ibrahim Mitre(4)
(1) Speech and Language Pathologist; Technician in charge of the Phonoaudiology Department of Nova Roma do Sul; Specialist in Audiology from Cefac.
(2) Speech and Language Pathologist; Director of Audioclin Assistência Fonoaudiológica; Specialist in Audiology from Cefac.
(3) Speech and Language Pathologist; Phonoaudiology Pro-fessor at Centro Universitário Metodista – Ipa, in Porto Ale-gre, and Faculdade Nossa Senhora de Fátima, in Caxias do Sul; PhD in Applied Linguistics from Pontifícia Universi-dade Católica do Rio Grande do Sul.
(4) Othorrinolaringologist, professor at the School of Medicine of Santa Casa in São Paulo, PhD. in Medicine from the School of Medicine of Santa Casa in São Paulo.
Conlict of interests: non-existent
Hearing loss induced by high sound pressure levels (HLIHSPL) related to work is the gradual decrease of hearing acuity resulting from the continuing exposure to high levels of sound pressure 2-12. HLIHSPL is characterized by
altera-tions in the external hair cells of the organ of Corti, which are sensitive to strong and prolonged sound pressures, resulting in irreversible hearing impair-ments, tinnitus and even dizziness, because of the proximity between the cochlea and the vestibular system. Therefore, alterations in the hearing thresholds are sensorineural, initially affecting one or more frequencies of the 3-6 KHz range 13-17. On
the other hand, higher and lower frequencies may take longer to be affected, according to the continuity of exposure; once the exposure to noise is discon-tinued, the process of hearing reduction ceases 9,18.
Therefore, the impairment is usually proportional to time of exposure to noise 9, although there are
subjects that, being more susceptible to high sound pressure levels, have reduced hearing acuity even with a short period of exposure 19.
A study has reported that 110 million people are currently exposed to high levels of sound pressure, and 25% of the world population has some level of HLIHSPL 12.
INTRODUCTION
Hearing is one of the most important senses for the psychosocial development of human beings, and every situation that may compromise it should be carefully studied.
Noise is characterized as the absence of wave periodicity, when frequency and its components do not have harmonic relationships1. Noise at high
sound pressure levels (HSPL) causes discomfort and/or intolerance and may provoke hearing impairment.
ABSTRACT
Purpose:to relate the audiometric proile of bus drivers with age and time activity. Method: this is a retrospective Cohort study, individual, comparative, using data from the audiological evaluation of bus drivers in Porto Alegre and its metropolitan area. Results: there were 1113 drivers with an average of 40.33 years and average service time of 4.16 years. Bilateral sensorineural hearing loss were found in the range of 3 to 6 KHz, with a trend of biggest change in hearing thresholds for the left ear in the range from 05 to 2 KHz. Workers with more time of service and age were the most affected, mainly in the range of high frequencies. Conclusion: there was a worsening in hearing thresholds at high frequencies in relation to time of service when comparing the results between the irst and the last evaluation of each worker.
After the implementation of the Regulation Norm nr.7 (NR7) in 1996, concerns with workers’ health have grown. Thus, it is necessary that professionals and employers can obtain more information about such disease in order to reduce its incidence or mitigate its effects 6.
HLIHSPL is the second most common pathology of sensorineural hearing loss in adults, following presbycusis. Age is an important variable to be considered. Other studies have evidenced that aging is likely to cause some kind of hearing loss 2-11, 20-25. Presbycusis is characterized by
hearing decline due to the aging process. Clinically, it has been addressed as a common type of hearing loss caused by cochlear degeneration, which mainly affects the basal portion of the cochlea, thus hindering auditory perception of high frequencies as it occurs in HLIHSPL 19,26-29.
Besides being frequently exposed to noise produced by the road trafic (car horns, engines and exhaust systems), drivers are also exposed to other conditions, such as climate, relationship with commuters and great responsibility, which lead to stress. This may cause health problems and poor professional performance 30,31. Furthermore,
front-engine buses are still common and may be even more harmful to hearing.
The aim of this study was to relate bus drivers’ audiometric proile to the age and working time variables.
METHOD
The present research was evaluated by the Committee of Ethics of CEFAC, and approved under the protocol number 105/10 on October, 20th 2010.
It is a retrospective, individual, comparative cohort study. The factor considered is workers subject to noise, and the results are the possible variations in the audiometric threshold in bus drivers.
Research data consisted of both the reference audiometric test and the last sequential audiometric exam of 1113 bus drivers working in Porto Alegre and surrounding areas. In this population study, data were obtained from an existing database of a medical clinic with 36 years of experience in Occupational Medicine in Porto Alegre. All drivers from the database provided by the clinic were included, totalizing 1113 participants.
The variables of this study are the auditory thresholds, working time and age.
Audiometric tests were performed by the speech and language pathologist working at the clinic, following the occupational anamnesis and the inspection of the external acoustic meatus. Air conduction laminar tone audiometry was performed
in 0.5 – 8 KHz frequencies. In case of alteration, bone conduction audiometry was also performed in 0.5 – 4 KHz. To carry out these procedures, an audiometer properly calibrated was used, respecting the worker’s auditory resting time of 14 hours in all examinations.
The analysis related to the variation of audio-metric thresholds was carried out from the following tonal means: 0.5 to 2 KHz and 3 to 6 KHz.
For the statistical analysis, the computational program SAS System for Windows (Statistical Analysis System) version 8.02 was used.
To describe the sample’s proile according to the variables under study, frequency tables of the categorical variables (gender, occupation and others) were created, with absolute frequency values (n) and percentage (%), and descriptive statistics of continuous variables (age, working time, audiometric thresholds, and others), with mean values, standard deviation, minimum and maximum values, median and quartiles.
For comparison of the categorical variables between groups, the chi-square test was used or, if necessary, Fisher’s exact test for the presence of expected values below ive. To compare the numerical variables between three or more groups, the Kruskal-Wallis test was applied; to analyze the relationship between the numerical variables, the Spearman’s correlation coeficient was employed due to the absence of normal distribution of the variables.
To study the variation of audiometric thresholds
between the initial and inal measures, the differ
-ences between values were estimated; the Wilcoxon test was used for related samples, and the McNemar test was used for categorical variables. Next, delta values of the thresholds were compared to the other variables using the tests above. The results of the audiometric variation were also classiied as worsening and non-worsening between the groups.
The level of signiicance adopted for the statis
-tical tests was 5%, i.e. p<0.05.
RESULTS
Concerning the characteristics of the population studied, it was observed that the mean age of the participants in this study was 40.33, with standard deviation of 9.61; the minimal age found was 19, and the maximum was 68.
In order to facilitate the analysis, the population was divided into working time ranges. From the total of participants, 185 had worked as bus drivers for less than 1 year (16.62%); 650 had been bus drivers from 1 to 5 years (58.40%); 172, from 6 to 10 years (15.45%); 67, from 11 to 15 years (6.02%); 24, from 16 to 20 years (2.16%); and 15 participants had more than 20 years of experience as bus drivers (1.35%). The mean working time was 4.16 years, and the maximum was 33 years, showing high variability in terms of working time.
The time period between the reference audio-metric test and the audioaudio-metric exam performed for this study, i.e. the sequential audiometric test, was also divided into ranges. Of the total of participants, 280 (25.16%) had undergone the initial audio-metric evaluation less than one year before the sequential exam performed for data collection in this study; a period from one year and one month to two years had passed between the two exams for 283 (25.43%) participants; the reference exam of 161 (14.47%) workers had been performed from two years and one month to three years before the sequential audiometric test; 153 (13.75%) drivers had not undergone an audiometric test in a period from three years and one month to four years; and
the last audiometric exam of 81 (13.3%) participants had been performed in a period from four years and one month to ive years before the sequential test. Information about seven participants was not found in the database. The mean time between exams was 2.56 years, and the maximum time was 10.8 years.
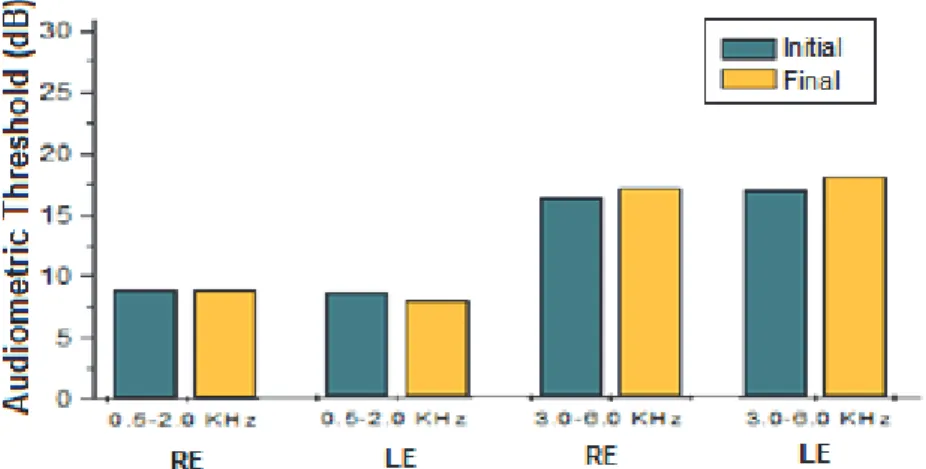
Figure 1 shows the mean variation of audiological thresholds, considering the tritonal means studied. In the 0.5 – 2 KHz range in the right ear, a mean of 8.81 dB (hearing level – HL) was obtained in the reference audiometric test, and 8.92 dB (HL) in the inal audiometric exam. In the same range, in the left ear, the mean of 8.59 dB (HL) was obtained from the reference audiometric testing, and 7.98 dB (HL) in the last sequential audiometric test. In the range from 3 to 6 KHz in the right ear, the mean in the reference audiometric test was 16.32 dB (HL), and 17.12 dB (HL) in the sequential audiometric exam. In the same range in the left ear, a mean of 16.99 dB (HL) was obtained in the reference audiometric exam and 18.08 dB (HL) in the inal audiometric test. Therefore, increased auditory thresholds were observed for the audiometric range between 3 and 6 KHz.
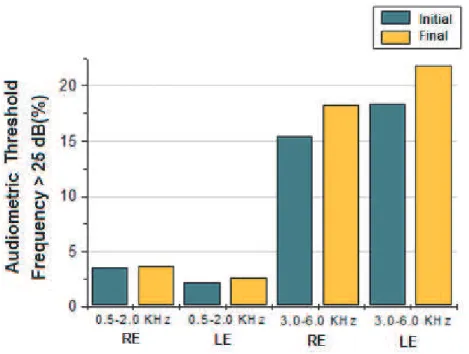
Figure 2 shows the frequency of participants whose audiometric thresholds were analyzed in a categorized way (above 25 dB (HL)), considering the means of 0.5 – 2 KHz and 3 – 6 KHz for both ears. In the 0.5 – 2 KHz range in the right ear, 3.59% of participants had hearing loss in the reference
audiometric exam, and 3.68% in the inal audio
-metric test. With regard to the same range in the left ear, 2.25% of the participants had hearing loss in
the reference audiometric exam, and 2.61% in the inal exam. Considering the range from 3 to 6 KHz in the right ear, 15.45% of the participants had hearing loss in the reference audiometric test, and 18.33 % in the sequential test. In the same range for the left ear, 18.42% of participants had their examina-tions altered in the reference audiometric test and 21.83% in the inal audiometric evaluation.
Figure 2 – Frequency of participants whose audiometric thresholds were analyzed in a categorized way (>25dB), considering the mean of 0.5 – 2 KHz and 3 – 6 KHz in the Right Ear (RE) and in the Left Ear (LE)
Table 1 shows the variation of the audiometric thresholds between the irst and the last audiometric exams considering the means studied of 0.5 – 2 KHz, and 3 – 6 KHz for both ears. In the right ear, there was no statistically signiicant difference for the 0.5 – 2 KHz range (p=0.125). For the 3 – 6 KHz range, there was a statistically signiicant difference (p=0.001).
For the left ear, there was also a statistically signiicant difference in both frequency ranges (p<0.001).
Table 2 shows that there was a signiicant corre
-lation between age and the audiometric thresholds. The higher thresholds were found in older partici-pants for the ranges analyzed (0.5 – 2 KHz and 3 – 6 KHz).
It is also possible to visualize the signiicant correlation between working time and audiometric thresholds, mainly in high frequencies (3 – 6 KHz).
DISCUSSION
Mean age of the population studied was 40.33 years, similarly to a research with young adult workers whose age ranged from 30 to 49 years old 17.
It was possible to notice high variability of working time in the population of drivers; the mean working
time was 4.16 years. This data was observed in a research whose population had less than six years of work experience 17. Maybe this is due to the great
responsibility and poor living quality of these profes-sionals, leading to stress 30.
In this study, Figure 1 shows the highest threshold increase in the 3 – 6 KHz range, in both
Audiometric Mean
Variable Initial Final SD p value *
RE - 0,5 a 2 KHz 8.81 8.92 6.78 p=0.125
LE - 0,5 a 2 KHz 8.59 7.98 6.14 p=<0.001
RE - 3 a 6 KHz 16.32 17.12 7.73 p=0.001
LE - 3 a 6 KHz 16.99 8.11 8.11 p=<0.001
0.5 - 2 KHz Range 3 - 6 KHz Range
RE LE RE LE
Initial Final Initial Final Initial Final Initial Final
Age r 0.2509 0.2393 0.2434 0.1921 0.4476 0.4795 0.4186 0.4811
p <.0001 <0.001 <.0001 <.0001 <.0001 <0.0001 <.0001 <.0001
Working Time
r 0.1241 0.028 0.0912 0.0147 0.1392 0.1428 0.098 0.13946 p <.0001 0.3479 0.0023 0.6249 <.0001 <.0001 0.0012 <.0001
Table 1 – Variation of the audiometric threshold between the irst and the last audiometric exam
(n=1113)
* p value refers to the Wilcoxon test for related samples to compare the initial and the inal audiometric exams. SD – standard deviation, RE – right ear, LE – left ear.
Table 2 – Correlation of age and working time to the audiometric thresholds
* r = Spearman’s correlation coeficient; p = value<p, n = number of subjects (n=1113), RE – right ear, LE – left ear
the right and the left ear, thus conirming one of the characteristics of HLIHSPL3,4,25,29.
Greater hearing loss was seen in the 3 – 6 KHz frequency range in both ears, and the difference between the initial and the inal auditory threshold was higher in that frequency range and in the left ear. Other studies also found higher thresholds for the left ear 4,31.
Another aspect to be highlighted is the variation of the audiometric thresholds between the irst and the last audiometric test. This variation was not signiicant in the right ear in the 0.5 – 2 KHz range, but there was signiicance in the other ranges. Such inding indicates greater progression of the thresholds in the high frequencies. This is in accordance with the indings of other studies of HLIHSPL4,25.
In this study, age and working time were associated with the alterations in the auditory thresholds. Mean working time of the workers was 4.16 years. Another study observed high employee turnover evidenced by low working time means, indicating that the working time in a company did not correspond to the time of exposure to noise
21. Besides, in the present study, it has been seen
that the time of exposure to noise contributes to the occurrence of hearing losses, in the same way as older age is also a predictive factor for hearing decline; such inding has been corroborated by the literature 2,7,22-24 with the prevalence of HLIHSPL
increasing with age.
Another point to be considered is the narrow relationship existing between age and working time or exposure, since a worker who dedicates a long period of his life to work in noisy environments will probably have his hearing acuity diminished. This may be related either to the exposure to occupational noise or to the incidence of presbycusis 7,11,22-24.
Presbycusis is one of the most frequent causes of hearing loss in adults, prevailing in high frequencies; its evolution acquires aspects of high severity when it is preceded by a work life of exposure to noise. The present study did not verify the possible correlation between working time and the degree of hearing loss, an aspect that depends on the variations of sound pressures and time of exposure to noise 26,27.
Regarding the frequency of worsening in the audiometric thresholds, a higher increase was seen in older individuals in the 3 – 6 KHz frequency range,
a inding that is in agreement with the literature13-17,
and in the left ear, as another study has shown25.
This may be due to the fact that the driver’s left ear is directed to the trafic noise.
Workers older than 50 years showed better results in the 0.5 – 2 kHz range than workers younger than 49. However, no studies explaining such fact have been found.
The results obtained evidence work condi-tions that harm these professionals’ physical and mental health, such as daily exposure to trafic, mainly in the rush hours, fatigue and concern with the commuters’ safety. This indicates a need for the implementation of preventive actions that offer better work conditions, since these professionals are very important to the community and the welfare of users of collective transportation means depends on them.
CONCLUSION
Worsening of hearing thresholds in high frequencies was observed in relation to working time when the results of the irst and the last sequential audiometric exams of each worker were compared.
RESUMO
Objetivo: relacionar o peril audiométrico dos motoristas de ônibus com as variáveis idade e tempo
de atividade. Método: foi realizado um estudo de Coorte retrospectivo, individual, comparativo,
uti-lizando dados da avaliação audiológica de motoristas de ônibus de Porto Alegre e região metropo
-litana. Resultados: foram avaliados 1113 motoristas com média de 40,33 anos de idade, e média
de tempo de serviço de 4,16 anos. Observou-se perda auditiva neurossensorial bilateral na faixa de 3 a 6KHz, com tendência de maior alteração dos limiares auditivos para a orelha esquerda na faixa de 0,5 a 2 KHz. Os trabalhadores com mais idade e tempo de serviço foram os mais afetados, prin-cipalmente na faixa de frequências altas. Conclusão: observou-se uma piora nos limiares auditivos em frequências agudas em relação ao tempo de serviço quando comparados os resultados entre a primeira e última avaliação de cada trabalhador.
REFERENCES
1. Speaks C. Introduction to sound: acustics for the hearing and speech sciences. San Diego, Singular Publishing Group, 1999.
2. Guerra MR, Lourenço PMC, Bustamante-Teixeira MT, Alves MJMA. Prevalência de perda auditiva induzida por ruído em empresa metalúrgica. Rev Saúde Pública. 2005;39(2):238-44.
3. Cepinho PC, Corrêa A, Bernardi APA. Ocorrência de perda auditiva em motoristas de São Paulo. Rev CEFAC. 2003;5(2):181-6.
4. Freitas GFF, Nakamura HY. Perda auditiva induzida por ruído em motoristas de ônibus com motor dianteiro. Saúde Rev. 2003;5(10):13-9. 5. Brasil, Portaria do INSS com respeito à perda auditiva por ruído ocupacional. Diário Oicial nº 131, sexta-feira, 11 de Julho de 1997, seção 3. Edital Nº 3, de 9 de julho de 1997.
6. Harger MRHC, Barbosa-Branco A. Efeitos auditivos decorrentes da exposição ocupacional ao ruído em trabalhadores de marmorarias no Distrito Federal. Rev Assoc. Med. 2004;50(4):396-9.
7. Caldart AU, Adriano CF, Terruel I, Martins RF, Caldart AU, Mocellin M. Prevalência da perda auditiva induzida pelo ruído em trabalhadores de indústria têxtil. Arq. Int. Otorrinolaringol. 2006;10(3):192-6.
8. Azevedo, APM, Wissmann W. Efeito de produtos químicos e ruído na gênese de perda auditiva ocupacional [Tese]. Rio de Janeiro (RJ): Escola Nacional de Saúde Pública, Fundação Oswaldo Cruz. 2004.
9. Araujo SA. Perda auditiva induzida pelo ruído em trabalhadores de metalúrgica. Rev. Bras. Otorrinolaringol. 2002;68(1):47-52.
10. Brasil. Norma Regulamentadora 7. Programa de controle médico de saúde ocupacional. Diário Oicial da União. Brasília (29 Dez. 1994).
11. Santos JD, Ferreira MIDC. Variação dos limiares audiométricos em trabalhadores submetidos a ruído ocupacional. Arq. Int. Otorrinolaringol. 2008;12(2):201-9.
12. Brasil. Ministério da Saúde (2006). Perda Auditiva Induzida por Ruído (Pair).Brasília: Editora MS; 7-32.
13. Brasil. Portaria nº 19, de 09 de abril de 1998. Estabelece a necessidade de diretrizes e parâmetros mínimos para a avaliação e o acompanhamento da audição dos trabalhadores, expostos a níveis de pressão sonora elevados e o texto técnico. Ministério do Trabalho e Emprego, Brasília.
14. Melnick W. Saúde auditiva do trabalhador, In: KATZ J. Tratado de Audiologia Clínica. São Paulo: Manole, 1999,4:529-46.
15. Fernandes M, Morata TC. Estudo dos efeitos auditivos e extra-auditivos da exposição ocupacional a ruído e vibração. Rev. Bras. de Otorrinolaringol. 2002;68(5):705-13.
16. Comitê Nacional de Ruído e Conservação Auditiva. Perda auditiva induzida por ruído relacionada ao trabalho. 1999.
17. Fernandes JC, Marinho T, Fernandes VM. Avaliação dos níveis de ruído e perda auditiva em motoristas de ônibus na cidade de São Paulo. XI Simpósio de Engenharia de Produção (SIMPEP); 2004 Nov; Bauru: Universidade Estadual Paulista-UNESP; 2004:1-10.
18. Castro Junior N, Santos AS. Audiometria de tronco encefálico em motoristas de ônibus com perda auditiva induzida pelo Ruído. Rev. Soc. Bras. Fonoaudiol. 2009;75(5):753-9.
19. Gonçalves CGO. O ruido, as alterações auditivas e o trabalho: estudo de casos em industrias metalurgicas de Piracicaba [Tese]. Campinas (SP): Universidade Estadual de Campinas; 2003.
20. Veras RP, Mattos LC. Audiologia do envelhecimento: revisão da literatura e perspectivas atuais. Rev. Bras. Otorrinolaringol. 2007;73(1):128-34.
21. Miranda CR, Dias CR, Pena PGL, Nobre LCC, Aquino R. Surdez ocupacional em trabalhadores industriais da região metropolitana de Salvador, Bahia. Rev Bras. Otorrinolaringol. 1998;64(2):109-14.
22. Andrade WTL, Borba DM, Rockland A, Lima MLL, Leite-Barros PMA. Achados audiométricos em trabalhadores expostos a ruído de uma usina sem programa de conservação auditiva. Fono Atual. 2006;36(2):17-22.
23. Dias A, Cordeiro R, Corrente JE, Gonçalves CGO. Associação entre perda auditiva induzida pelo ruído e zumbidos. Cad Saúde Pública. 2006;22(1):63-8.
24. Gonçalves CGO, Iguti AM. Análise de programas de preservação da audição em quatro indústrias metalúrgicas de Piracicaba, São Paulo, Brasil. Cad Saúde Pública. 2006;22(3):609-18.
25. Corrêa Filho HR, Costa LS, Hoehne EL, Pérez AG, Nascimento LCR, Moura EC. Perda auditiva induzida por ruído e hipertensão em condutores de ônibus. Rev Saúde Pública. 2002;36(6):693-701. 26. Kwitko A. Coletânea – Pair, pairo, ruído, epi, epc, cat, pericias, reparação e outros tópicos sobre audiologia ocupacional. São Paulo: LTr ; 2001:10-140.
28. Almeida SIC. Diagnóstico diferencial da disacusia neuro-sensorial por ruído. Em: Nudelmann AA. PAIR – Perda auditiva induzida pelo ruído. Porto Alegre: Editora Bagaggem Comunicação Ltda; 1997. p. 181-7.
29. Lacerda A, Figueiredo G, Neto JM, Marques JM. Achados audiológicos e queixas relacionadas à audição dos motoristas de ônibus urbano. Rev Soc Bras Fonoaudiol. 2010;15(2):161-6.
30. Zanelato LS. Manejo de stress, coping e resiliência em motoristas de ônibus urbano. [tese] Bauru (SP): Universidade Estadual Paulista Júlio Mesquita Filho (UNESP) – Faculdade de Ciências; 2008.
31. Silva GLL, Gomez MVSG, Zaher VL. Peril audiológico de motoristas de ambulância de dois hospitais na cidade de São Paulo – Brasil. Arq. Int. Otorrinolaringol. 2006;10(2):132-40.
Received on: July 23, 2012 Accepted on: May 06, 2013
Mailing address: Raquel Fernanda Bisi
Rua Sarmento Leite 1538, Ap 1101 Caxias do Sul – RS
CEP: 95084-000