A resposta auditiva de estado estável na avaliação auditiva:
aplicação clínica******
Auditory steady-state response in the auditory evaluation: clinical
application
*Fonoaudióloga. Mestre em Fonoaudiologia pela Faculdade de Odontologia de Bauru - Universidade de São Paulo. Endereço para correspondência: Departamento de Fonoaudiologia da Faculdade de Odontologia de Bauru - Universidade de São Paulo. Alameda Doutor Otávio Pinheiro Brisolla, 975 Bauru SP -CEP 17012-901
(josileneduarte@uol.com.br)
**Fonoaudióloga. Professora Livre Docente do Curso de Fonoaudiologia da Faculdade de Odontologia de Bauru - Universidade de São Paulo.
***Fonoaudióloga. Especialista em Audiologia pela Faculdade de Odontologia de Bauru - Universidade de São Paulo. Profissional da Prática Profissionalizante em Fonoaudiologia do Departamento de Fonoaudiologia da Faculdade de Odontologia de Bauru -Universidade de São Paulo
****Otorrinolaringologista. Professor Titular do Curso de Fonoaudiologia da Faculdade de Odontologia de Bauru -Universidade de São Paulo.
*****Neurofisiologista. Doutor em Medicina - Neurologia pela Universidade Federal de São Paulo. Professor Adjunto do Departamento de Neuropsiquiatria da Faculdade de Medicina da Universidade Federal de Pernambuco.
******Trabalho Realizado no Departamento de Fonoaudiologia da Faculdade de Odontologia de Bauru -Universidade de São Paulo.
Artigo Original de Pesquisa
Artigo Submetido a Avaliação por Pares
Conflito de Interesse: não
Recebido em 28.08.2007. Revisado em 26.03.2008.
Aceito para Publicação em 3.06.2008.
Abstract
Background: the auditory steady state response (ASSR) is an electrophysiological procedure that evaluates, at the same time, the hearing thresholds of both ears at various frequencies. This procedure reduces the time of testing and enables the stimulation of levels close to 125dB HL, characterizing residual hearing. Aim: to verify the applicability of the ASSR to determine the hearing thresholds in different levels of sensorineural hearing loss. Method: 48 individuals aged 7-30 years, with different levels of hearing loss were assessed. The Pure tone Audiometry (PTA) and the ASSR were carried out in following carrier frequencies 0.5; 1; 2 and 4k Hz. The carrier frequencies in the ASSR were modulated in amplitude and frequency, with multiple dicotic stimulation for mild and moderate hearing loss. Simple stimulation was used to test the other hearing deficit levels. Results: there was a significant association (p<0.01) between the thresholds obtained in the PTA and in the ASSR for all of the tested frequencies, especially for the severe levels. However, for some patients, the hearing loss level was overestimated in the ASSR. Conclusion: the ASSR can be used to estimate the PTA threshold; nevertheless, it should not be analyzed in an isolated way, but seen as a complementary procedure to the behavioral auditory assessment.
Key Words: Auditory Evoked Potential; Steady-State; Audiometry; Sensorineural Hearing Loss.
Resumo
Tema: a resposta auditiva de estado estável (RAEE) é um procedimento eletrofisiológico que permite avaliar ao mesmo tempo os limiares auditivos de várias freqüências em ambas às orelhas, reduzindo assim o tempo de teste, e permite estimular até níveis próximos a 125dB HL, caracterizando assim a audição residual. Objetivo: verificar a aplicabilidade da RAEE para determinar os limiares auditivos nos diferentes graus de perda auditiva neurossensorial coclear. Método: foram avaliados 48 indivíduos com idade entre sete e trinta anos e diferentes graus de perdas auditivas. A Audiometria Tonal Liminar (ATL) e a RAEE foram avaliadas nas seguintes freqüências portadoras, 0,5; 1; 2 e 4k Hz. As freqüências portadoras na RAEE foram moduladas em amplitude e freqüência, com estimulação múltipla e dicótica nas perdas auditivas de grau leve e moderado. Estimulação simples foi utilizada nos outros graus de perdas auditivas. Resultados: houve associação significante (p < 0,01) entre os limiares obtidos na ATL e RAEE para todas as freqüências testadas, principalmente para perdas auditivas de grau profundo. Contudo em alguns pacientes o grau da perda auditiva pode ser super-estimado. Conclusão: a RAEE pode ser utilizada para predizer os limiares auditivos da ATL, porém não deve ser analisada de forma isolada, mas de forma complementar a avaliação audiológica comportamental.
Palavras-Chave: Potenciais Evocados Auditivos; Estado Estável; Audiometria; Perda Auditiva Neurossensorial.
Referenciar este material como:
Duarte JL, Alvarenga KF, Garcia TM, Costa Filho OA, Lins OG. Auditory steady-state response in the auditory evaluation: clinical application (original title: A resposta auditiva de estado estável na avaliação auditiva: aplicação clínica). Pró-Fono Revista de Atualização Científica. 2008 abr-jun;20(2):105-10.
Josilene Luciene Duarte* Kátia de Freitas Alvarenga** Tatiana Manfrini Garcia*** Orozimbo Alves Costa Filho Otávio G Lins*****
Introduction
The Auditory Steady-State Response (ASSR) is an electrophysiological exam that has been used in large services as an auxiliary procedure on the diagnosis of infantile hearing losses. One of its most important advantages is the possibility to assess several frequencies simultaneously while presenting them to both ears at the same time (1,2,3,4) thus decreasing the testing time if compared to the same assessment using the Auditory Brainstem Response (ABR) with tone burst stimulus (5,6,7). The use of test stimulus that allows the assessment even of frequencies near 125dBHL contributes to the measurement of auditory residuals in cases of severe and profound hearing losses with no responses on ABR assessments (5,8). Furthermore, the decision about response presence or absence is defined with the use of statistical techniques (9,10).
In cases of sensorial hearing losses the thresholds determined by the ASSR has shown strong correlations with behavioral thresholds determined by the Visual Reinforcement Audiometry (VRA) and/or conditioned audiometry (6,11,12,13,14,15,16), as well as by the pure tone audiometry (PTA) (17,18,19,20,21). In what refers to the degree of sensorial hearing loss the studies show weaker correlations with the less severe losses (22,7,23,24). However, most of the studies focused mostly on hearing losses of severe and profound degrees showing the necessity of research about the relations between PTA and ASSR also in less severe hearing losses. The aim of the present study was to verify the association between tonal thresholds and the ones obtained in the ASSR in individuals with varying degrees of sensorial hearing losses.
Method
The study was conducted on the Hearing, Speech and Language Clinic of Bauru Dental School and on the Center of Audiology Research of the Hospital for Rehabilitation of Craniofacial Anomalies, both of the University of Sao Paulo
The ASSR was realized in both ears with the exception of the subjects with which it was done only on the right ear because the child woke-up and didn't return to continue the test.
Assessment procedure
All subjects were examined by a otorhinolaringologist in order to guarantee adequate conditions for auditory assessment.
The pure tone audiometry was realized in an acoustic cabin with a Madsen audiometer of Midimate 622 model using TDH-39 over-aural phones. The frequencies of 0.5, 1, 2 and 4 kHz were assessed by bone conduction in both ears in order to confirm the hearing thresholds and the audiogram's configuration on the testing day. Maximum intensity tested were 60dBHL by bone conduction and 115, 120, 115 and 115 dBHL by air conduction to the frequencies of 0.5, 1, 2, and 4 kHz respectively. A timpanometry was also conducted to guarantee the middle ear functionality on the moment of assessment.
Auditory Steady-State Response (ASSR)
The ASSR thresholds were assessed on the same day of the conventional audiologic evaluation using the MASTER (Multiple Auditory Steady-State Response) system on its 2.04.i00 version by Bio-logic Systems Corp.
Stimulus
Two parameters of stimulus presentation were used due to the different degrees of hearing loss and to the sound presentation patterns available by the equipment.
First parameter (mild, and moderate hearing losses)
Second parameter (severe and profound hearing losses)
The frequencies of 0.5; 1; 2 and 4 kHz were assessed with simple and dichotic stimulation because the equipment doesn't allow multiple stimulation of the same ear on intensities above 80dBHL. The assessment of the ASSR threshold started with the 0.5 kHz frequency, followed by 4 kHz, 1 kHz and 2 kHz, respectively. The frequencies were 1005 modulated for amplitude and 20% for frequency with 69.141Hz as the modulation frequency to the right ear and 66.797Hz to the left ear on all the frequencies assessed. The stimuli were presented through 3A insertion phones starting with 100dBHL of intensity to individuals with severe hearing loss and with the maximum intensity provided by the equipment with individuals with profound hearing loss. The intensities were 117 dBHL to the 0.5 kHz frequency, 121 dBHL to the 1 kHz frequency, 119 dBHL to the 2 kHz frequency and 118 kHz to the 4 kHz frequency. The threshold was determined by decreasing steps of 10dB until no response was observed and increasing with 5dB steps to determine the electrophysiological threshold.
ASSR record
To the ASSR record the individual comfortably laid in natural sleep or relaxed on a gurney placed inside a cabin with acoustic and electrical isolation within an acoustic treated room. Disposable electrodes were positioned in Fz (active electrode), Oz (reference) and Fpz (ground) with impedances kept below 5 Kohm and differences among impedances lesser than 2 Kohm. The electroencephalogram was obtained using a 50000 gain, low-pass filter of 1Hz to 300 Hz, 6 dB/ octave and analogical-digital (AD) conversion rhythm of 1kHz.
Each screening lasted 16 seconds and had 16 periods of 1 second each. A period was rejected if the amplitude exceeded ± 40 µV. The number of screening was determined based on the response onset or on the intensity tested. On intensities equal
or above 90 dBHL it varied from 10 to 12. On intensities equal or below 80 dBHL it varied from 18 to 45. The intensity was decreased in 10 dB when the response statistically significant and didn't change in 12 consecutive screenings (26).
ASSR analysis
The screenings were automatically analyzed using the frequency range resulting from the Fast Fourier Transform (FFT). It consisted on the verification of the ASSR amplitude on a specific frequency of modulation compared to the adjacent frequencies (60 frequency bins bellow and 60 frequency bins above the response) and analized through a F test with confidence interval of 95% (27). A response was considered present with p value p<0.05.
Data analysis
The data analysis used the Pearson (r) correlation coefficient to compare the thresholds obtained by PTA and ASSR and the study of the agreement rate of the degree of the hearing loss and its respective agreement rate (Kappa).
Results
On the individual analysis of the results it was observed that some individuals with profound sensorial hearing losses presented responses on the PTA and didn't on the ASSR or presented no response on either procedure. The Pearson correlation coefficients that compared PTA and ASSR thresholds on 0.5, 1, 2 and 4 kHz were respectively 0.88; 0.93; 0.93 and 0.88 to the right ear and 0.82; 0.87; 0.90 and 0.90 to the left ear. These coefficients were statistically significant (p<0.01).
TABLE 1. Distribution of the population according to the classification of the hearing level determined to the right ear defined by the average of the thresholds on 0.5 and 4 kHz frequencies (WHO, 1997) of the Pure Tone Audiometry and of the Auditory Steady-State Response.
Hearing Level Classification – Right Ear *ASSR
**PTA # Normal Mild Moderate Severe Profound Total
n % n % n % n % n % n %
Normal 1 2 2 2 1 4 - - - - 4 8
Mild - - 1 2 5 10 1 2 - - 7 15
Moderate - - - - 2 4 5 10 4 8 11 23
Severe - - - 2 4 6 13 8 17
Profound - - - 18 38 18 38
Total 1 2 3 6 8 17 8 17 28 58 48 100
Legend: *ASSR – Auditory Steady-State Response; **PTA – Pure Tone Audiometry, # Individual with descendant audiometric curve configuration on the right ear
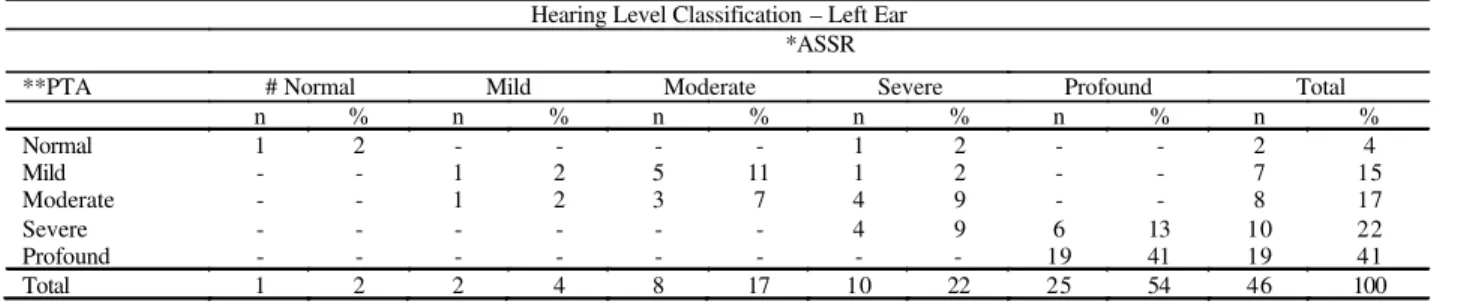
TABLE 2. Distribution of the population according to the classification of the hearing level determined to the left ear defined by the average of the thresholds on 0.5 and 4 kHz frequencies (WHO, 1997) of the Pure Tone Audiometry and of the Auditory Steady-State Response.
Hearing Level Classification – Left Ear *ASSR
**PTA # Normal Mild Moderate Severe Profound Total
n % n % n % n % n % n %
Normal 1 2 - - - - 1 2 - - 2 4
Mild - - 1 2 5 11 1 2 - - 7 15
Moderate - - 1 2 3 7 4 9 - - 8 17
Severe - - - 4 9 6 13 10 22
Profound - - - 19 41 19 41
Total 1 2 2 4 8 17 10 22 25 54 46 100
Legend: *ASSR – Auditory Steady-State Response; **PTA – Pure Tone Audiometry, # Individual with descendant audiometric curve configuration on the left ear
TABLE 3. Values of Kappa agreement coefficient between the degree of the hearing loss on the Pure Tone Audiometry and the Auditory Steady-State Response on both ears.
Confidence interval (95%)
EAR Observed
agreement (%) Kappa Low Limit High Limit
Right 50 0.74 0.58 0.84
Left 61 0.77 0.58 0.87
Discussion
The implementation of the newborn hearing screening on programs of hearing health the professionals that work on reference centers must be able to perform audiological diagnosis and treatment, if necessary, on newborns identified as being at risk for hearing loss.
Among the available procedures to the hearing
It can be observed that there was a significant association (p<0.01) of the hearing thresholds determined by the PTA and by the ASSR and that the correlation coefficients (r) have shown strong correlation between the procedures, agreeing with other studies (17, 18, 19, 20).
Several studies reported fewer correlations of PTA and ASSR thresholds on the 0.5 kHz frequency (17, 7, 23) as well as on the 4kHz frequency (21). A possible explanation could be the type of stimulus modulation because instead of amplitude modulation or amplitude and frequency modulation (7, 21) this study used the exponential amplitude modulation associated to the modulation of frequency. The exponential modulation generates larger amplitudes to all frequencies, allowing better observation of the 0.5 and 4 kHz frequencies (28).
With the aim to verify if the threshold determined by PTA and ASSR classified hearing losses on a similar way, the 1997 WHO classification (25) which considers the average of 0.5 to 4 kHz frequencies was used (Tables 1 and 2).
The Kappa agreement coefficient to the hearing loss degree was 0.74 to the right ear and 0.77 to the left ear with the lower limit of the confidence interval near 0.60 what may suggest that on some moments the agreement was moderate (Table 3). According to Tables 1 and 2 it was possible to observe that in some individuals the ASSR pointed out to a higher level of hearing loss than the PTA specially in those with less severe hearing losses.
Analyzing specifically the profound hearing loss there was a stronger agreement of the procedures. The findings agree with the ones described on the literature (22,7,23). However, it was observed that even with few occurrences, the profound hearing loss defined by the ASSR referred to severe and moderate hearing losses defined by the PTA (Tables 1 and 2).
Therefore, the possibility that the ASSR overestimate the degree of the hearing loss in some patients should be considered, as it is already the case with the evoked brainstem auditory potentials. This difference is to be expected once procedures
that evaluate different responses are being compared. That is the pure tone audiometry evaluates the auditory functions and on the contrary the electrophysiological procedures are directly dependent on the structure of the hearing system that generates the response.
This way, the thresholds determined by the ASSR as other procedures used in the audiological evaluation of children should not be used as the single information while defining the adjustments on the individual hearing aids. It is also import to note that the maximum and best use of the hearing aid device is essential to the cochlear implant indication, electronic device used in severe and profound hearing losses which do not benefit from amplification.
It is important to point out that despite this study compare ASSR with PTA and not with VRA (Visual Reinforced Audiometry) and/or conditioned audiometry that are used with infant and preschoolers the finding were similar (11,12,13,16,14,15,16) in what refers to the strong correlations of VRA and/or conditioned audiometry and ASSR to sensorial hearing losses, with larger differences between thresholds in mild hearing losses (11,12) and smaller on the more severe ones (12). However, no study with an analysis similar to the one presented in this research was found on the literature.
The results obtained have shown that the ASSR is a valid procedure to predict the hearing threshold, especially in the cases of more severe hearing losses. However future studies should focus on the infantile population more specifically in newborns and babies, ages in which the procedure has larger clinical applicability once it is not possible to obtain precise responses on behavioral tests.
Conclusion
References
1. Stürzebecher E, Cebulla M, Pschirrer U. Efficient stimuli for recording of the amplitude modulation following response. Audiology. 2001 Mar-Apr;40(2):63-8. 2. Cebulla M, Stürzebecher E, Wernecke KD. Objective detection of the amplitude modulation following response (AMFR). Audiology. 2001 Sept-Oct;40:245-52.
3. Pethe J, Mühler R, Von Specht H. Amplitude modulation following responses in audiological diagnostics. HNO. 2002 Dec;50(12):1045-52.
4. Ohtake Y. Objective audiometry using amplitude-modulation following responses elicited by compound sinusoidal amplitude-modulated tones. Nippon Jibiinkoka Gakkai Kaiho. 2003 Oct;106(10):1045-54.
5. Rance G, Dowell RC, Rickards FW, Beer DE, Clark GM. Steady-state evoked potential and behavioral hearing thresholds in a group of children with absent clique-evoked auditory brain stem response. Ear Hear. 1998 Feb;19(1):48-61.
6. Luts H, Desloovere C, Kumar A, Vandermeersch E, Wouters J. Objective assessment of frequency-specific hearing thresholds in babies. Int J Pediatr Otorhinolaryngol. 2004 July;68(7):915-26.
7. Swanepoel D, Hugo R, Roode R. Auditory Steady-State response for children with severe to profound hearing loss. Arch Otolaryngol Head Neck Surg. 2004 May;130:531-35.
8. Hall JW. ABRs or ASSRs? The application of Tone-Burst ABRs in the ERA of ASSRs. Hearing Review [Serial on the internet]. 2004 Aug [cited 2006 may 28]; 11(8):[about 10 p.]. Available from: http:// www.hearingreview.com/article.php?s=HR/2004/08&p=2. 9. Lins OG, Picton TW, Boucher BL, Durieux-Smith A, Champagne SC, Moram LM, et al. Frequency-specific audiometry using steady-state responses. Ear Hear. 1996 Apr;17(2):81-96.
10. Batterjee R, Dutt SN. Introduction to auditory steady-state response: will it replace the ABR? EntNews. The bi-monthly review of ENT and Audiology. 2006 Jan/Feb;14. 11. Rance G, Briggs RJS. Assessment of hearing in infants with moderate to profound impairment: the Melbourne experience with auditory steady-state evoked potential testing. Ann Otol Rhinol Laryngol Suppl. 2002 May;189:22-8.
12. Rance G, Rickards F. Prediction of hearing threshold in infants using auditory steady-state evoked potentials. J Am Acad Audiol. 2002 May;13(5):236-45.
13. Stueve MP, O'rourke C. Estimation of hearing loss in
15. Rance G, Roper R, Symons L, Moody LJ, Poulis C, Dourlay M, et al. Hearing Threshold estimation in infants using auditory steady-state responses. J Am Acad Audiol. 2005 May;16(5):291-300.
16. Han D, Mo L, Liu H, Chen J, Huang L. Threshold estimation in children using auditory steady-state responses to multiple simultaneous stimuli. ORL J Otorhinolaryngol Relat Spec. 2006 Jan;68(2):64-8.
17. Dimitrijevic A, John MS, Van Roon P, Purcell DW, Adamonis J, Ostroff J, et al. Estimating the audiogram using multiple auditory steady-state responses. J Am Acad Audiol. 2002 Apr;13:205-24.
18. Lins OG. Audiometria fisiológica tonal utilizando respostas de estado estável auditivas do tronco cerebral [tese]. São Paulo (SP): Escola Paulista de Medicina, Universidade Federal de São Paulo; 2002.
19. Luts H, Wouters J. Hearing assessment by recording multiple auditory steady-state response: the influence of test duration. Int J Audiol. 2004 Sept;43(8):471-8. 20. Schmulian D, Swanepoel D, Hugo R. Predicting pure-tone thresholds with dichotic multiple frequency auditory steady state responses. J Am Acad Audiol. 2005 Jan; 16(1): 5-17.
21. Attias J, Buller N, Rubel Y, Raveh E. Multiple auditory steady-state responses in children and adults with normal hearing, sensorineural hearing loss, or auditory neuropathy. Ann Otol Rhinol Laryngol. 2006 Apr;115:268-76. 22. Herdman AT, Stapells DR. Auditory steady-state response thresholds of adults with sensorineural hearing impairment. Int J Audiol. 2003 July;42:237-48.
23. Picton TW, Dimitrijevic A, Perez-Abalo MC, Van Roon P. Estimating audiometric thresholds using auditory steady-state responses. J Am Acad Audiol. 2005 Jan;16(3):140-56.
24. Canale A, Lacilla M, Cavalot AL, Albera R. Auditory steady-state responses and clinical applications. Eur Arch Otorhinolaryngol. 2006 June;263:499-503.
25. Prevention of blindness and deafness: Grades of hearing impairment [database on the internet]. World Health Organization. c. 2006 - [cited 2006 Dec 05] Available from: < h t t p : / / h t t p : / / w w w . w h o . i n t / p b d / d e a f n e s s / hearing_impairment_grades/en/>.