INTRODUCTION
One of the aims of plant regeneration by tissue cul-ture is to produce individuals genetically identical to the explant’s donors and to themselves (i.e., a clone). The ef-ficiency of this biotechnological process depends not only on the number of plants obtained in vitro but also on the genetic stability after the regeneration cycles. Somaclonal variants may be produced by in vitro culture (Evans and Sharp, 1983; D’Amato, 1985; Lee and Phillips, 1988), and these heritable changes might produce an increase in ge-netic variability available for breeding programs, but if cloning genotypes was desired this variation should be minimized (Skirvin et al., 1994). Phenotypic markers showing a known inheritance pattern may be considered to evaluate the genetic stability of the regenerated plants (Gavazzi et al., 1987), and De Klerk (1990) emphasized the importance of the use of metric traits as phenotypic markers to evaluate genetic stability.
Multivariate analysis gives a measure of the total variation in different samples of individuals (Chatfield and Collins, 1986), and it is possible to apply this methodol-ogy to the evaluation of modifications of regenerated plants in respect to the explant’s donors.
The goal of this experiment was to use principal com-ponent analysis to measure the stability of metric traits in tomato (Lycopersicon spp.) plants obtained from in vitro
culture after one regeneration cycle with the aim of de-veloping a new approach for detecting the effects of in vitro culture on these traits.
MATERIAL AND METHODS
Regenerated plants of different genotypes of L. esculentum, L. esculentum var. cerasiforme, L. pimpi-nellifolium, L. peruvianum and L. hirsutum (Pratta et al., 1997) were used (Table I), the in vivo adaptation of the re-generated plants being accomplished according to the pro-tocol described in Pratta et al. (1995). Acclimatized plants were kept in a greenhouse for flowering and fructification. The stability of metric traits in the in vitro regener-ated plants was assessed through a progeny test, for which two groups of plants were assayed: group 1, the experi-mental group, was non-regenerated plants (NP) consist-ing of the explant’s donor plants (NP1) and their progeny (NP2) (L. esculentum (N = 24), L. esculentum var.
cerasiforme (N = 19), L. pimpinellifolium (N = 13), L. peruvianum (N = 9) and L. hirsutum (N = 7) (N = 72)). Group 2 consisted of the progeny of the regenerated plants (PRP) (L. esculentum (N = 12), L. esculentum var.
cerasiforme (N = 43), L. pimpinellifolium (N = 14), L. peruvianum (N = 1) and L. hirsutum (N = 9) (N = 79)).
The metric traits evaluated in both groups were stem perimeter (in cm) at the base (PB), the middle (PM) and the top (PA) of the plant and the number of flowers per clus-ter (FC). Seeds of NP1 were sown in the first crop cycle, while seeds of NP2 and PRP were sown in the next cycle. Annual effect was assessed by comparing the mean values for each variable in NP1 plants and NP2 plants with the Stu-dent t-test (Snedecor, 1964). Analysis of the effect of in vitro culture on plant stability was accomplished by
princi-METHODOLOGY
Multivariate analysis as a tool for measuring the stability of morphometric
traits in
Lycopersicon
plants from
in vitro
culture
Guillermo Pratta, Roxana Zorzoli and Liliana Amelia Picardi
Abstract
The phenotypic stability of morphometric traits in Lycopersicon spp. (stem perimeter at the base, middle and top, and number of flowers per cluster) was measured by multivariate analysis through a progeny test in order to estimate the genetic stability of these traits. Principal components were calculated for two groups of Lycopersicon spp., non-regenerated plants and the progeny of regenerated plants. Analysis of variance was performed to support principal component analysis. Both groups presented similar eigenvalues and eigenvec-tors, while no significant differences were found between any of the traits studied. These results indicated that the phenotypic structure was the same among the progeny of regenerated and non-regenerated plants, so that no variation would occur in in vitro culture. Multivariate analysis proved to be an appropriate methodology for the measurement of the stability of morphometric traits after one regeneration cycle.
CONICET (Consejo Nacional de Investigaciones Científicas y Técnicas) CIUNR (Consejo de Investigaciones de la Universidad Nacional de Rosario) -Cátedra de Genética, Facultad de Ciencias Agrarias, Universidad Nacional de Rosario, Caixa Postal 14, 2123 Zavalla, Argentina.
pal components (PC) analysis (Chatfield and Collins, 1986), which was applied firstly to the groups to compare respective PC values, then to the total data in order to test if any modification was produced in the values and lastly to the genotypes within each group. In the latter case ge-notypic variances for the PC (i.e., the respective eigenva-lues) were compared by the homogeneity of variance test (Snedecor, 1964).
An ANOVA test was applied to compare the mean val-ues for each variable in the NP and PRP groups in order to verify the principal component analysis.
RESULTS
No significant difference was found between NP1 and NP2 for any variable, indicating that there were no signifi-cant differences between years which influenced the ex-pression of the traits. It was therefore possible to pool both subgroups in the NP sample.
No significant differences were detected by ANOVA between NP plants and PRP plants for PB, PM, PA and FC (Table II).
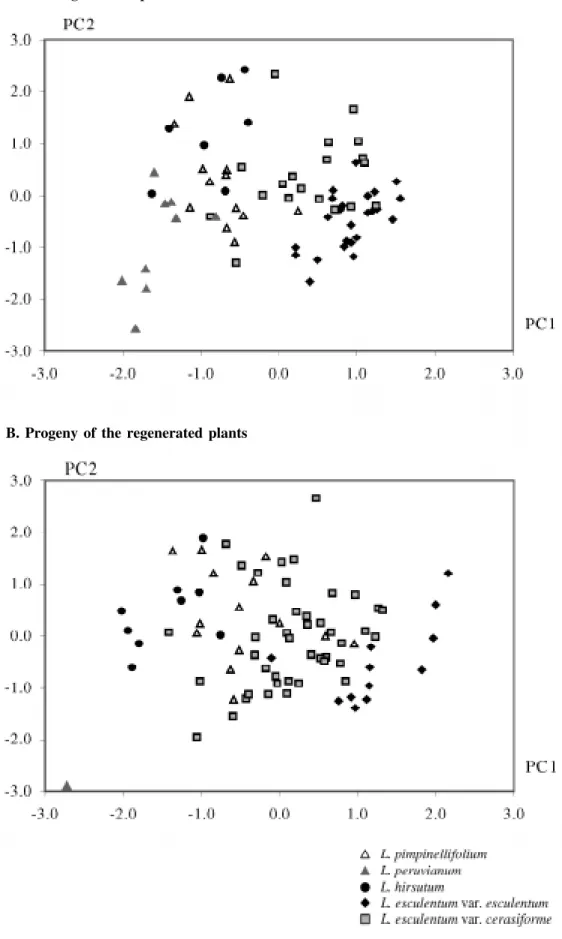
The first two PC (PC1 and PC2) accounted for a high proportion of the total variability (92%) in NP plants (Table III). The subsequent PC had a small contribution to the whole and will not, therefore, be considered further. Fig-ure 1A displays the NP plants following multivariate analy-sis on the baanaly-sis of these two first PC.
Results corresponding to the PRP plants are shown in Table IV. The respective eigenvectors and eigenvalues were the same as those of the NP plants. PC1 and PC2 values for PRP plants are plotted in Figure 1B. In this case, associa-tions of individuals were similar to those in NP plants.
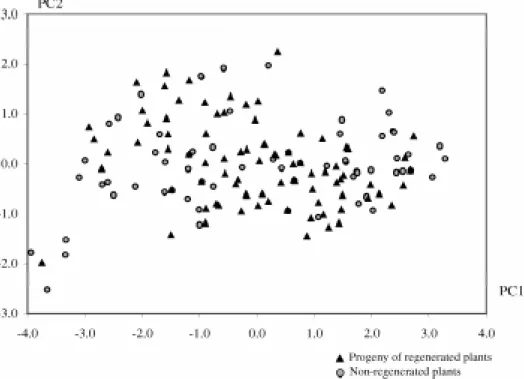
No modification was observed when PC values were calculated for the total data (Table V). A similar arrange-ment of plants was again obtained (Figure 2). Addition-ally, it was not possible to observe any separation of the individuals according to their origin (i.e., regenerated plants vs. non-regenerated plants).
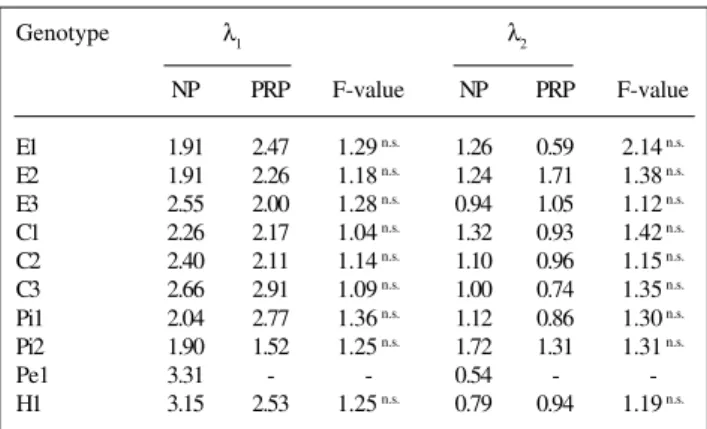
The first two eigenvalues of the PC by genotype are presented in Table VI. No significant difference among groups was detected by the homogeneity of variance test.
Table II - Mean values ± standard deviation of the morphometric traits in the non-regenerated plants (NP) and in the progeny of the regenerated
plants (PRP) by genotype of different Lycopersicon species.
Genotype PB PM PA FC
E1 NP 3.23 ± 0.23 2.73 ± 0.27 2.25 ± 0.30 5.67 ± 1.86 PRP 3.05 ± 0.21 2.55 ± 0.21 2.20 ± 0.10 4.50 ± 2.12 E2 NP 2.92 ± 0.49 2.69 ± 0.29 2.12 ± 0.22 5.15 ± 1.07 PRP 2.98 ± 0.39 2.70 ± 0.61 2.05 ± 0.59 6.50 ± 1.29 E3 NP 3.12 ± 0.42 2.78 ± 0.35 2.25 ± 0.27 4.33 ± 0.52 PRP 2.80 ± 0.07 2.24 ± 0.13 2.02 ± 0.13 3.60 ± 0.55 F-value 0.63 n.s. 0.46 n.s. 0.12 n.s. 0.11 n.s.
C1 NP 2.70 ± 0.34 2.37 ± 0.30 1.98 ± 0.30 10.00 ± 2.53 PRP 2.55 ± 0.35 2.18 ± 0.27 1.80 ± 0.29 10.12 ± 2.85 C2 NP 3.05 ± 0.56 2.50 ± 0.44 2.02 ± 0.36 8.33 ± 1.75 PRP 2.57 ± 0.27 2.02 ± 0.30 1.80 ± 0.29 7.38 ± 1.12 C3 NP 2.91 ± 0.58 2.23 ± 0.59 2.07 ± 0.59 7.57 ± 2.07 PRP 2.36 ± 0.40 1.98 ± 0.29 1.68 ± 0.49 5.80 ± 0.45 F-value 0.10 n.s. 0.37 n.s. 0.25 n.s. 0.58 n.s.
Pi1 NP 2.43 ± 0.37 1.69 ± 0.25 1.31 ± 0.39 8.57 ± 1.51 PRP 2.48 ± 0.45 1.95 ± 0.24 1.80 ± 0.43 7.75 ± 0.96 Pi2 NP 2.12 ± 0.24 1.72 ± 0.21 1.35 ± 0.27 13.50 ± 2.42 PRP 2.32 ± 0.32 1.81 ± 0.27 1.54 ± 0.20 13.20 ± 2.35 F-value 0.65 n.s. 0.16 n.s. 0.46 n.s. 0.80 n.s.
Pe1 NP 1.53 ± 0.19 1.06 ± 0.34 0.89 ± 0.34 9.11 ± 2.42
PRP 1.50* 0.50* 0.50* 7.00*
F-value 0.74 n.s. 0.38 n.s. 0.28 n.s. 1.00 n.s.
H1 NP 2.27 ± 0.53 1.64 ± 0.30 1.41 ± 0.26 13.57 ± 2.23 PRP 2.01 ± 0.21 1.56 ± 0.23 1.18 ± 0.27 13.89 ± 1.76 F-value 0.24 n.s. 0.89 n.s. 0.20 n.s. 0.69 n.s.
List of genotypes by species: L. esculentum: E1: cv. Nor, E2: cv. Platense Italiano, E3: cv. Caimanta; L. esculentum var. cerasiforme: C1: LA 1385, C2: LA 1673, C3: Z 1994; L. pimpinellifolium: Pi1: LA 722, Pi2: Z 1995; L. peruvianum: Pe1: LA 2151; L. hirsutum: H1: LA 2128. PB: Stem perimeter at the base (cm); PM: stem perimeter in the middle (cm); PA: stem perim-eter at the top (cm); FC: mean number of flowers per cluster. *Data corre-sponding to only one plant. n.s.Nonsignificant.
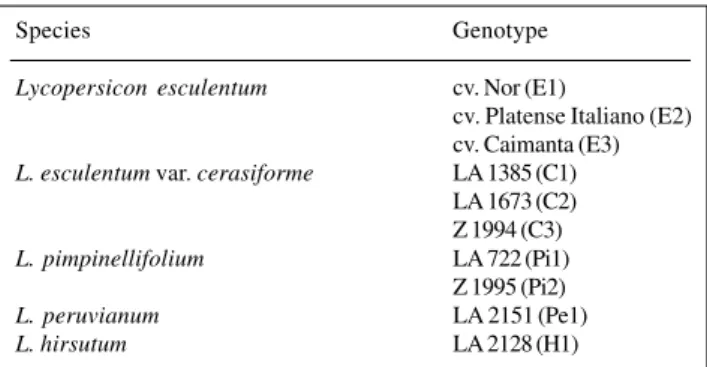
Table I - Genotypes of Lycopersicon investigated.
Species Genotype
Lycopersicon esculentum cv. Nor (E1)
cv. Platense Italiano (E2) cv. Caimanta (E3)
L. esculentum var. cerasiforme LA 1385 (C1) LA 1673 (C2) Z 1994 (C3)
L. pimpinellifolium LA 722 (Pi1)
Z 1995 (Pi2)
L. peruvianum LA 2151 (Pe1)
L. hirsutum LA 2128 (H1)
Table III - Principal components (PC), eigenvalues (E) and proportions of explained variances (EV) and accumulated variances (AV) for the
non-regenerated plants (NP) of different Lycopersicon species.
PC1 PC2 PC3 PC4
PB 0.53- (0.91) 0.25 (0.21) -0.74 (-0.33) -0.33 (-0.11) PM 0.54- (0.93) 0.18 (0.15) 0.67- (0.30) -0.48 (-0.17) PA 0.55- (0.94) 0.13 (0.15) 0.09- (0.04) 0.81- (0.28) FC -0.35 (-0.60) 0.93 (0.79) 0.05- (0.02) 0.03- (0.01)
E 2.95 0.73 0.20 0.12
EV 0.74 0.18 0.05 0.03
AV 0.74 0.92 0.97 1.00
Correlation coefficient between the PC and each variable in parentheses. For abbreviations see legend to Table II.
DISCUSSION
in-Figure 1 - Individual plants by species on the basis of principal component 1 (PC1) and principal component 2 (PC2). A. Non-regenerated plants
terpretation of the phenotypic structure (and any eventual changes) of the groups. In this case, PC1 may be consid-ered as a general variability trait, since it represented about 74% of the total phenotypic variation observed in both groups and was highly correlated to all the variables. It allowed differentiation of the species according to the ratio vegetative development/reproductive development, and was positively associated with PB, PM and PA, and nega-tively associated with FC. The species with high PB, PM and PA values and low FR values showed the greatest PC1 values. For instance, L. esculentum and L. esculentum var.
cerasiforme were both situated in the extreme right of the PC1 axis of both Figures 1 and 2. On the other hand, PC2 was narrowly associated to FC, which could be interpreted as a potential productivity factor. Even though PC2 ex-plained a smaller percentage of the total variability (18%), it permitted differentiation within the larger arrangements defined by PC1. Indeed, L. esculentum var. cerasiforme
(which had a greater number of flowers per cluster) was situated above L. esculentum in both Figures 1 and 2. Also,
L. pimpinellifolium and L. hirsutum were situated in the upper left quadrant of both Figures 1 and 2 while L. peruvianum was below them.
Multivariate analysis appeared to be an appropriate methodology for measuring the stability of metric traits after one regeneration cycle. Similar arrangement of NP plants and PRP plants based on the principal components was observed. These associations were preserved when ana-lyzing all the data, suggesting that neither the means nor the variances of the regenerated plants were modified by ef-fect of in vitro culture. It follows that both groups of plants
Table IV - Principal components (PC), eigenvalues (E) and proportions of explained variances (EV) and accumulated variances (AV) for the progeny
of the regenerated plants (PRP) of different Lycopersicon species.
PC1 PC2 PC3 PC4
PB 0.53- (0.88) 0.19 (0.16) -0.71 (-0.41) 0.43- (0.19) PM 0.54- (0.90) 0.12 (0.10) 0.70- (0.40) 0.45- (0.20) PA 0.53- (0.88) 0.34 (0.28) 0.03- (0.02) -0.77 (-0.34) FC -0.38 (-0.63) 0.91 (0.76) 0.04- (0.02) 0.14- (0.06)
E 2.78 0.70 0.33 0.19
EV 0.69 0.18 0.08 0.05
AV 0.69 0.87 0.95 1.00
Correlation coefficient between the PC and each variable in parentheses. For abbreviations see legend to Table II.
Table V - Principal components (PC), eigenvalues (E) and proportions of explained variances (EV) and accumulated variances
(AV) for all data (non-regenerated and progeny of regenerated plants) of different Lycopersicon species.
PC1 PC2 PC3 PC4
PB 0.53- (0.90) 0.23 (0.20) -0.72 (-0.35) 0.39- (0.15) PM 0.54- (0.92) 0.15 (0.13) 0.69- (0.34) 0.45- (0.17) PA 0.55- (0.94) 0.24 (0.20) 0.05- (0.02) -0.80 (-0.31) FC -0.36 (-0.61) 0.93 (0.79) 0.05- (0.02) 0.04- (0.02)
E 2.89 0.72 0.24 0.15
EV 0.72 0.18 0.06 0.04
AV 0.72 0.90 0.96 1.00
Correlation coefficient between the PC and each variable in parentheses. For abbreviations see legend to Table II.
Table VI - Eigenvalues (λ) of principal component 1 and principal component 2 by genotype within group of different Lycopersicon
species and F-values for the homogeneity of variance test.
Genotype λ1 λ2
NP PRP F-value NP PRP F-value
E1 1.91 2.47 1.29 n.s. 1.26 0.59 2.14 n.s.
E2 1.91 2.26 1.18 n.s. 1.24 1.71 1.38 n.s.
E3 2.55 2.00 1.28 n.s. 0.94 1.05 1.12 n.s.
C1 2.26 2.17 1.04 n.s. 1.32 0.93 1.42 n.s.
C2 2.40 2.11 1.14 n.s. 1.10 0.96 1.15 n.s.
C3 2.66 2.91 1.09 n.s. 1.00 0.74 1.35 n.s.
Pi1 2.04 2.77 1.36 n.s. 1.12 0.86 1.30 n.s.
Pi2 1.90 1.52 1.25 n.s. 1.72 1.31 1.31 n.s.
Pe1 3.31 - - 0.54 -
-H1 3.15 2.53 1.25 n.s. 0.79 0.94 1.19 n.s.
NP: Non-regenerated plants; PRP: progeny of the regenerated plants. For list of genotypes by species, see legend to Table II. n.s.Nonsignificant.
showed the same magnitude and source of variation in the phenotypic structure. According to De Klerk (1990), no variation would have been produced in the genetic systems influencing those traits.
CONCLUSIONS
No significant effect of in vitro culture on the morpho-metric traits was detected in Lycopersicon plants obtained from in vitro culture by principal component analysis.
Multivariate analysis is an appropriate methodology for the measurement of the stability of morphometric traits after one regeneration cycle.
RESUMO
Nesta experiência a estabilidade fenotípica dos caracteres métricos perímetro do culmo na base, no meio e no alto e número
de flores por racemo foi medida mediante a prova de progênie com análise multivariada. Desta forma, uma nova metodologia para avaliação da estabilidade genética depois de um ciclo de regeneração in vitro foi proposta. Os componentes principais foram calculados para dois grupos de plantas de Lycopersicon
spp.: o não regenerado e a progênie das plantas regeneradas. A ANOVA foi empregada como controle da análise de componentes principais. As diferenças entre grupos não foram estatisticamente significantes para nenhum caráter. Ambos os grupos apresentaram autovalores e autovetores similares. Os resultados obtidos indicaram que a estrutura fenotípica das plantas não foi modificada. Assim, nenhuma variação foi causada pela cultura in vitro. A análise multivariada mostrou ser uma metodologia apropriada para a medida da estabilidade dos caracteres métricos depois de um ciclo de regeneração.
REFERENCES
Chatfield, C. and Collins, A.J. (1986). Introduction to Multivariate Analy-sis. Chapman and Hall, London.
D’Amato, F. (1985). Cytogenetics of plant cells and tissue cultures and their regenerates. Plant Sci. 3: 73-112.
De Klerk, G.J. (1990). How to measure somaclonal variation. Acta Bot. Neerl. 39: 129-144.
Evans, D.A. and Sharp, W.R. (1983). Single gene mutation in tomato plants regenerated from tissue culture. Science 221: 949-951.
Gavazzi, G., Tonelli, C., Todesco, G., Arreghini, E., Raffaldi, F., Vecchio, F., Barbuzzi, G., Biasini, M.G. and Sala, F. (1987). Somaclonal variation versus chemically induced mutagenesis in tomato (Lycopersicon esculentum L.). Theor. Appl. Genet. 74: 733-738.
Lee, M. and Phillips, R. (1988). The chromosomal basis of somaclonal varia-tion. Ann. Rev. Plant Physiol. 39: 413-437.
Pratta, G., Zorzoli, R. and Picardi, L.A. (1995). Adaptation of Lycopersicon
plants from in vitro culture. Comun. Biol. 13: 448 (Abstract). Pratta, G., Zorzoli, R. and Picardi, L.A. (1997). Intra- and interspecific
vari-ability of in vitro culture response in Lycopersicon (tomatoes). Braz. J. Genet. 20: 75-78.
Skirvin, R.M., Cheeters, K.D. and Norton, M. (1994). Sources and frequency of somaclonal variation. HortScience 29: 1232-1237.
Snedecor, G. (1964). Métodos Estadísticos. 5ta Edición. Companía Editorial, México D.F.