Heitor B. Bastos
1, Evonnildo C. Gonçalves
1, Stephen F. Ferrari
2, Artur Silva
1and Maria Paula C. Schneider
1 1Laboratório de Polimorfismo do DNA, Departamento de Genética, Universidade Federal do Pará, Belém,
PA, Brazil.
2
Departamento de Biologia, Universidade Federal de Sergipe, São Cristóvão, SE, Brazil.
Abstract
We genotyped 15 microsatellite loci in order to evaluate the effects of habitat fragmentation, caused by flooding of the Tucuruí reservoir, on the genetic structure of Alouatta belzebul in eastern Amazonia. The analysis included two populations sampled in 1984, representing both margins of the Tocantins river, and three populations sampled 18 years later. Minimal differences in the diversity levels between present-day (Ho = 0.62-0.69 and AR= 6.07-7.21) and
pre-flooding (Ho = 0.60-0.62 and AR= 6.27-6.77) populations indicated there was no significant loss of genetic
vari-ability, possibly because of successful management strategies applied during the flooding. The changes observed were limited to shifts in the composition of alleles, which presumably reflect the admixture of subpopulations during flooding. Given this, there were significant differences in the Rst values (p = 0.05) in all but one between-site compar-ison. Both present-day and original populations showed a deficit of heterozygotes, which suggests that this may be typical of the species, at least at a local level, perhaps because of specific ecological characteristics. The relatively large number of private alleles recorded in all populations may be a consequence of the Wahlund effect resulting from population admixture or a process of expansion rather than the loss of rare alleles through genetic drift. Addi-tionally, the levels of genetic variability observed in this study were higher than those reported for other species of Neotropical primates, suggesting good fitness levels in these A. belzebul populations. Regular genetic monitoring of remnant populations, especially on islands, should nevertheless be an integral component of long-term manage-ment strategies.
Key words: Alouatta belzebul, Amazonia, conservation, genetic structure, habitat fragmentation.
Received: October 28, 2009; Accepted: July 13, 2010.
Introduction
Endemic to Brazil, the red-handed howler (Alouatta belzebul) is found in the southeastern Amazon basin and northern Atlantic Forest (Gregorin, 2006). Like other mem-bers of the genus (Di Fiore and Campbell, 2007), the red-handed howler is relatively tolerant of anthropogenic habitat disturbance (Bonvicino, 1989; Pintoet al., 2003; Camargo CC, MSc Dissertation, Museu Paraense Emílo Goeldi, Belém, PA, 2005), although Atlantic Forest popu-lations have been reduced to critical levels by deforestation. In contrast, Amazonian populations are relatively abun-dant, despite the comparatively high deforestation rates that affect the densely-populated southeastern basin (Lopes and Ferrari, 2000).
Among other major impacts in this region, the con-struction in the early 1980s of the world’s fourth-largest hy-droelectric dam (based on generating capacity) at Tucuruí
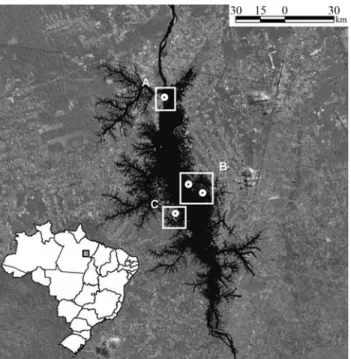
on the Tocantins river resulted in the creation of a 2500 km2 reservoir and the formation of more than 1600 islands. In addition to increasing the distance between opposite banks of the river from approximately 1 km to up to 30 km in places, construction of the dam initiated a process of in-tense human colonization in the area around the reservoir, which resulted in the fragmentation of most of the sur-rounding forest (Figure 1). Howlers were among the most abundant mammals prior to the flooding (Mascarenhas and Puorto, 1988), and currently have high population densi-ties, especially on islands (Camargo and Ferrari, 2007), al-though the area’s total population is almost certainly much smaller than it was prior to the flooding. Similarly, while there are no data on migration patterns, either before or af-ter the flooding, it seems likely that dispersal is now re-stricted to the islands closest to each margin of the Tocan-tins and that cross-river transfer is practically nil.
Samples collected from some of the animals rescued during the flooding are still available, and the primary aims of the present study were to investigate the genetic structure of the original populations they represent, using molecular
techniques not available in the 1980s, and to assess the long-term effects of the flooding on the structure of pres-ent-day populations. The isolation of relatively small popu-lations on islands may lead to increased inbreeding and random effects such as genetic drift (Couvet, 2002; Fran-kham, 2003). These processes may cause a loss of genetic variability, and possible fixation of deleterious alleles, which in turn can lead to the loss of long-term population viability (Bjilsma et al., 2000; Frankham et al., 2002; Keller and Waller, 2002; Reed and Frankham, 2003).
Material and Methods
Samples and DNA extraction
The samples analyzed in this study represent five spa-tially and temporally distinct populations of eastern Ama-zonian red-handed howlers (Alouatta belzebul) from the area of the Tucuruí hydroelectric reservoir (4°15’S, 49°31’ W) in the Brazilian state of Pará (Figure 1). Blood samples (3-6 mL) were collected via venal puncture from 989 of the howlers captured during flooding of the reser-voir, in 1984 and 1985. Aliquots of these samples were stored at the Universidade Federal do Pará in Belém. Most of these samples were used in the study of Schneideret al.
(1991), but for the present study, it was only possible to
ex-tract DNA from 40 of the specimens. Of these, 30 were col-lected on the left bank (LB85) of the Tocantins and 10 on the right bank (RB85).
In 2002, howlers were captured live at three sites in the Tucuruí reservoir using a Pneu-dart rifle and tranquil-izer darts containing 0.1 mL of ketamine hydrochloride per kg body weight. Captures were authorized by the federal environment agency (IBAMA) and were supervised by a veterinarian from the National Primate Center in Belém. All procedures were conducted in compliance with federal animal care legislation. Blood samples of ~ 3 mL were col-lected from the femoral vein of anesthetized howlers and stored in Falcon tubes containing 300mL of 0.02 M EDTA. Thirty blood specimens were collected from howlers on the 129-ha Germoplasma Island (LB02), close to the pres-ent-day left bank of the Tocantins, and from 22 individuals on the right bank: 15 from Base 4 (RB02) and seven from Cornélio Island (RB02B; Figure 1), which is similar in size to Germoplasma Island. DNA was obtained from all sam-ples using a standard protocol (Sambrooket al., 1989).
Analysis of microsatellite loci
Fifteen microsatellite loci were analyzed (Table 1). Ten of these were developed specifically forA. belzebul
(Gonçalveset al., 2004), whereas the remaining five were specific for Callithrix jacchus (Nievergelt et al., 1998),
Alouatta palliata(Ellsworth and Hoelzer, 1998) andCebus apella (Escobar-Páramo, 2000). Polymerase chain reac-tions (PCRs) were done in a final volume of 20mL, contain-ing 0.5 unit ofTaqDNA polymerase, 5 ng of DNA, 25mM of each dNTP, 50 mM KCl, 10 mM Tris-HCl and 0.4mM of each primer. Optimal conditions for the 15 primers were determined by varying the temperature of association (Ta-ble 1), number of cycles and the concentration of MgCl2.
Figure 1- Map of the study area based on satellite imagery, showing the Tucuruí reservoir (center) and the sampling localities mentioned in the text. The Tocantins river (in black) runs south-north. In the surrounding matrix, darker gray areas are forest, while lighter coloration indicates pas-ture or plantations. A includes LB02 = Germoplasma Island in 2002, rep-resenting the left bank of the Tocantins post-flooding, B includes RB85 = Base 4 in 1985, representing the right bank prior to flooding, RB02 = Base 4 in 2002, representing the right bank post-flooding, and RB02B = Cornélio Island in 2002, an isolated post-flooding right bank population, C includes LB85 = Base 3 in 1985, representing the left bank prior to flooding of the reservoir.
Table 1- The 15 microsatellite loci analyzed in this study.
Locus Temp (ºC) Original species Allele length (bp)
Ab04 62 Alouatta belzebul 147-167
Ab06 50 Alouatta belzebul 265-293
Ab07 60 Alouatta belzebul 178-202
Ab09 53 Alouatta belzebul 168-204
Ab10 56 Alouatta belzebul 228-284
Ab12 60 Alouatta belzebul 223-293
Ab13 52 Alouatta belzebul 197-261
Ab16 58 Alouatta belzebul 198-244
Ab17 63 Alouatta belzebul 193-263
Ab20 67 Alouatta belzebul 242-304
Cj12 50 Callithrix jacchus 120-134
Cj14 50 Callithrix jacchus 138-148
Ap68 49 Alouatta palliata 180-206
Ap74 52 Alouatta palliata 128-158
size in 8% polyacrylamide gels in an ALF Express II auto-matic DNA sequencer (Amersham Bioscience). The size of the amplified fragments was determined using Allelinks 1.0 software.
Detection of bottleneck events
Recent bottleneck events often present genetic char-acteristics that can be detected in microsatellite data. Typically, allelic diversity is lost more quickly than hetero-zygosity, and observed heterozygosity is different from that expected based on the number of alleles under mutation-drift equilibrium (Cornuet and Luikart, 1996; Luikart and Cornuet, 1998). Allele frequencies were tested for the pres-ence of an excess of heterozygotes using the sign test (Cornuet and Luikart, 1996) and Wilcoxon’s signed-rank test, run on the Bottleneck program described by Piryet al.
(1999). As the mechanisms of mutation in microsatellite markers are unknown, these tests were based on three dif-ferent mutational models: the stepwise mutation model (SMM) (Kimura and Ohta, 1978), the infinite allele model (IAM) (Kimura and Crow, 1964), and the two-phase model (TPM) (Di Rienzoet al., 1994). The TPM was used in con-junction with 95% SMM and 5% IAM, which, according to Piryet al.(1999), is appropriate for microsatellite markers.
Statistical analysis
To characterize the genetic diversity of each popula-tion, allele frequencies, the mean number of alleles (A), ob-served (Ho) and expected (He) heterozygosities according to Hardy-Weinberg equilibrium, and their means, were cal-culated using Popgene32 (Yehet al., 1997). Allelic rich-ness (AR), an index of the number of alleles independent of
sample size, was estimated using the Goudet (1995) FSTAT application via the rarefaction method adapted for genetic data by Petitet al.(1998). Possible deviations from Hardy-Weinberg equilibrium and an excess or deficiency
molecular variance (AMOVA) (Excoffier et al., 1992), which estimates the proportion of overall variance attrib-uted to differences within and among artificial groups of the populations, and among individuals within each popu-lation. This analysis was done on all possible combinations of the five populations studied, although only the results (after Bonferroni correction; Rice, 1989) of the four most informative arrangements are presented here.
Results
Genetic variability and bottlenecks
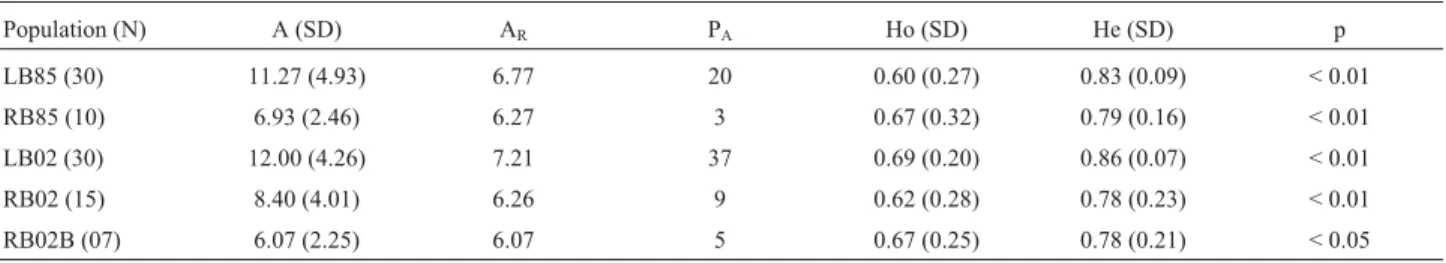
Some of the loci, such as Cj12 and Cj14, were rela-tively homogeneous in terms of allele length, whereas oth-ers, in particular Ab12 and Ab20, were more variable (Table 1). The mean number of alleles per locus was rela-tively large in all populations, ranging from 6.1 at RB02B to 12.0 at LB02; estimates of allelic richness varied less, from 6.07 at RB02B to 7.21 at LB02 (Table 2).
Observed heterozygosity was relatively high (³0.60) in all populations (Table 2), although these values were consistently lower than expected (He³0.78) for each popu-lation. All differences between the observed and expected heterozygosities were significant, even after applying the Bonferroni correction (Rice, 1989). This indicates that none of the populations was in Hardy-Weinberg equilib-rium.
The results of the Bottleneck analyses (Table 3) var-ied considerably, depending on the mutational model used and the type of statistical test. In the case of the IAM, the analyses indicated that some populations (LB85, LB02 and RB02B) had or have suffered recent bottleneck events. However, this model is more appropriate for protein stud-ies, and when the SMM and TPM were applied, this trend disappeared. In the case of SMM, the sign test yielded a sig-nificant result for LB85, although this was contradicted
em-Table 2- Summary of the characteristics of 15 microsatellite loci in theA. belzebulpopulations studied at Tucuruí, and analysis of the deviation from Hardy-Weinberg equilibrium.
Population (N) A (SD) AR PA Ho (SD) He (SD) p
LB85 (30) 11.27 (4.93) 6.77 20 0.60 (0.27) 0.83 (0.09) < 0.01
RB85 (10) 6.93 (2.46) 6.27 3 0.67 (0.32) 0.79 (0.16) < 0.01
LB02 (30) 12.00 (4.26) 7.21 37 0.69 (0.20) 0.86 (0.07) < 0.01
RB02 (15) 8.40 (4.01) 6.26 9 0.62 (0.28) 0.78 (0.23) < 0.01
RB02B (07) 6.07 (2.25) 6.07 5 0.67 (0.25) 0.78 (0.21) < 0.05
See Figure 1 and text for definition of populations. A = mean number of alleles per locus, AR= allelic richness, He = expected heterozygosity, Ho =
phatically by the Wilcoxon value (Table 3). Overall, these analyses indicated that none of the populations was experi-encing or had experienced a recent bottleneck event.
Genetic differentiation
Values of pairwise Rst varied from -0.0109 (RB85vs.
RB02) to 0.2277 (LB85vs.RB02B) (Table 4). With the ex-ception of the comparison RB85vs.RB02 (the same site in different years), all comparisons were significant (p < 0.05), and those involving RB02B generally returned the highest values, as expected from the relative configura-tion of the sites,i.e., LB02 was more similar to LB85 than RB85, and so on. Despite being the most differentiated population, the Rst values for RB02B were consistent with its location in time and space, with smaller values for the RB populations and the smallest for the more recent RB02.
Other patterns were more complex, however, in par-ticular the relatively low values recorded for RB02. Indeed, the negative value obtained for RB85vs.RB02 suggested that there was more differentiation within each population than between them. RB02 was nevertheless more similar to
both LB populations than it was to RB02B. This almost cer-tainly reflects the admixture resulting from the release of rescued animals at Base 4, in contrast to Cornélio Island, which has remained isolated since the flooding.
Analysis of molecular variance (AMOVA)
Within-population variation accounted for > 90% of the molecular variance in all combinations of populations, except where RB02B was compared with the remaining populations (Table 5). In all other cases, the absence of variation between banks and the reduced variation among populations of the same bank was due to the inclusion of RB02B in the analysis.
Discussion
Genetic variability
A relatively large number of alleles was recorded per locus compared with other platyrrhines, e.g. Leonto-pithecus rosalia(Grativolet al., 2001) andMico argentatus
(Gonçalveset al., 2009). Despite these values, there was Table 3- Values of p recorded for the statistical analyses (sign and Wilcoxon tests) of the different mutational models used to evaluate the probability of recent bottleneck events in the study populations, calculated using the Bottleneck program of Piryet al.(1999).
Value of p according to
Infinite alleles model Stepwise mutation model Two-phase model
Population Sign test Wilcoxon test Sign test Wilcoxon test Sign test Wilcoxon test
LB85 0.00043 0.00002 0.01191 0.95837 0.42747 0.68066
RB85 0.38652 0.15140 0.10613 0.87381 0.09296 0.83487
LB02 0.00550 0.00005 0.23770 0.80530 0.42810 0.61923
RB02 0.00858 0.00009 0.44556 0.40387 0.27522 0.33490
RB02B 0.12625 0.07571 0.59758 0.33939 0.22683 0.24435
See Figure 1 and text for definition of populations.
Table 4- Matrix of Rst values for pairwise comparisons betweenA. belzebulpopulations from Tucuruí.
Population LB85 RB85 LB02 RB02
RB85 0.0484*
LB02 0.0592** 0.1001**
RB02 0.0370* -0.0109 0.0504**
RB02B 0.2277** 0.1170* 0.1994** 0.1090*
See Figure 1 and text for definition of populations. *p < 0.05; **p < 0.01.
Table 5- AMOVA results for the principal arrangements of theA. belzebulpopulations from Tucuruí.
Arrangement Between groups Among populations within each group Within populations
LB85 - RB85vs.RB02B - LB02 - RB02 -1.13% 8.90% 92.23%
LB02vs.LB85 - RB85 - RB02B - RB02 -0.68% 8.54% 92.14%
RB02vs.LB85 - RB85 - LB02 - RB02B -5.52% 10.43% 95.09%
RB02Bvs.LB85 - RB85 - LB02 - RB02 14.76% 4.35% 80.89%
al. (2004) have shown that mean allele excess may be strongly influenced by sample size andq-values, and this seems to be the case with our data (not shown).
Unfortunately, the allelic richness parameter has not been used widely in studies of platyrrhines, which reduces its value for interspecific comparisons, although it does permit more conclusive inferences on differences among the populations studied here, without the bias of sample size. A comparison of allelic richness values (Table 2) indi-cated that overall the populations were relatively similar.
The heterozygosity values recorded here reconfirmed the relatively high genetic variability of the A. belzebul
populations from Tucuruí, both before and after flooding of the reservoir. Once again, these values are also relatively high when compared with those for other microsatellite studies in platyrrhines: 0.49 (range: 0.34-0.65) inL. rosalia
(Grativolet al., 2001), 0.26 (0.11-0.39) inM. argentatus
(Gonçalves et al., 2009), 0.33 (0.09-0.65) in C. moloch
(Menescal et al., 2009) and 0.47 (0-0.86) in Alouatta palliata(Miltonet al., 2009).
The observed heterozygosity was significantly lower than expected in all five populations. However, this may be related to sampling questions, such as the Wahlund effect. In this case, the situation in the original populations (LB85 and RB85) might be explained by the admixture of differ-ent local subpopulations during flooding, although it seems likely that these populations, especially those on islands, have been relatively stable since then. However, the 18 years that separate the two periods represent only two or three howler generations (Di Fiore and Campbell, 2007), which may not yet have been sufficient for the populations to achieve equilibrium.
Differences among populations
The Rst values (Table 4) indicated relatively limited differentiation among populations, except for comparisons involving Cornélio Island. By comparison, Grativolet al.
(2001) obtained values between 0.25 and 0.45 for pairwise comparisons of four isolated populations ofL. rosaliain a fragmented habitat. In particular, the similarity between the left and right bank populations ofA. belzebulsuggests that the original course of the Tocantins river was not a very ef-fective barrier to dispersal between the region’s original populations. This might be expected, given the preference of Amazonian howlers for flooded forest ecosystems (Queiroz, 1995; Peres, 1997) and the original topography of the area, which was characterized by a complex of fluvial islands.
have been reinforced by the fact that, since howlers may survive to up to 20 years in the wild (Wang and Milton, 2003), at least part of the 2002 population may have been present at the site before the flooding. However, few data are available on the longevity of howlers in the wild (and none onA. belzebul), although studies at other sites have in-dicated a maximum life span of much less than 10 years (Di Fiore and Campbell, 2007), which would preclude this pos-sibility.
The more pronounced differences between Cornélio Island and all other populations (confirmed by the Rst val-ues and AMOVA results) may reflect the relative isolation of this island population. It is possible that formation of the island led to the isolation of a relatively differentiated local subset of the right bank population, which was not sampled in 1985, and has been reinforced by its subsequent isola-tion.
Implications for conservation of the species
Overall, the populations of A. belzebul show rela-tively ample genetic variability, with little evidence of sig-nificant bottleneck events or loss of variability in comparison with the original, pre-flooding populations. The changes observed were limited to shifts in allelic com-position, presumably because of the admixture of local subpopulations during flooding. The phenotypic effects of inbreeding are not apparent at the moment, although the rel-atively small populations on islands are likely to be suscep-tible to inbreeding and genetic drift over the long term (Frankham, 1998).
The relatively large number of private alleles re-corded in all populations (Table 2) may be a consequence of the Wahlund effect resulting from population admixture, a conclusion supported by the linkage disequilibrium ob-served in some pairs of loci (not shown). Alternatively, this excess of private alleles may reflect a process of expansion rather than the loss of rare alleles through genetic drift, par-ticularly since rapid population growth enhances the reten-tion of new mutareten-tions (Avise et al., 1984; Rogers and Harpending, 1992). Since genetic variability is essential for the adaptation of a species to novel environments (Fran-kham, 2003), this parameter is an important indicator of the relatively good genetic viability of the populations, at least in the short term.
thrive in fragmented landscapes. Despite their ecological flexibility, which is based on folivory, howlers are not ex-empt from the long-term effects of the loss of genetic diver-sity or the accumulation of deleterious alleles. Tucuruí is unusual because of the effective isolation of fragments (= islands) by water, rather than a terrestrial matrix, across which howlers may disperse more easily. Given this, the regular monitoring of the genetic variability of these popu-lations, especially those on islands, should be an integral component of long-term management strategies.
Acknowledgments
This study was supported by FINEP, Eletronorte S.A. and CNPq research fellowships to ECG (152757/2007-4), SFF (302747/2008-7), AS and MPCS. Live captures in 2002 were authorized by IBAMA through special license 080/02-DIFAS/DIREC/IBAMA. We thank Paulo Castro, Eldianne Lima, Simone Martins and local field assistants for collecting specimens, and Rubens Ghilardi Jr., Tacachi Hatanaka and Edilene Nunes for their help with planning and logistics. We also thank an anonymous reviewer for helpful comments on an earlier version of the manuscript.
References
Avise JC, Neigel JE and Arnold J (1984) Demographic influences on mitochondrial DNA lineage survivorship in animal popu-lations.J Mol Evol20:99-105.
Bjilsma R, Bundgaard J and Boerema AC (2000) Does inbreeding affect the extinction risk of small populations? Predictions fromDrosophila. J Evol Biol 13:502-514.
Bonvicino CR (1989) Ecologia e comportamento de Alouatta
belzebul (Primates, Cebidae) na Mata Atlântica. Rev
Nordest Biol 6:149-179.
Camargo CC and Ferrari SF (2007) Interactions between tayras (Eira barbara) and red-handed howlers (Alouatta belzebul) in eastern Amazonia. Primates 48:147-150.
Chiarello AG (2003) Primates of the Brazilian Atlantic Forest: The influence of forest fragmentation on survival. In: Marsh LK (ed) Primates in Fragments. Kluwer Academic Press, New York, pp 99-121.
Cornuet JM and Luikart G (1996) Description and power analysis of two tests for detecting recent population bottlenecks from allele frequency data. Genetics 144:2001-2014.
Couvet D (2002) Deleterious effects of restricted gene flow in fragmented populations. Conserv Biol 16:369-376. Di Fiore A and Campbell CJ (2007) The atelines: Variation in
ecology, behavior, and social organization. In: Campbell CJ, Fuentes A, MacKinnon KC, Panger M and Bearder SK (eds) Primates in Perspective. Oxford University Press, New York, pp 155-185.
Di Rienzo A, Peterson AC, Garza JC, Valdes AM, Slatkin M and Freimer NB (1994) Mutational processes of simple-sequence repeat loci in human populations. Proc Natl Acad Sci USA 91:3166-3170.
Ellsworth JA and Hoelzer GA (1998) Characterization of micro-satellite loci in a New World primate, the mantled howler monkey (Alouatta palliata). Mol Ecol 7:657-658.
Escobar-Páramo P (2000) Microsatellite primers for the wild brown capuchin monkeyCebus apella. Mol Ecol 9:107-108. Excoffier L, Smouse PE and Quattro JM (1992) Analysis of mo-lecular variance inferred from metric distances among DNA haplotypes: Application to human mitochondrial DNA re-striction data. Genetics 131:479-491.
Ferrari SF, Iwanaga S, Ravetta AL, Freitas FC, Sousa BAR, Souza LL, Costa CG and CoutinhoPEG (2003) Dynamics of primate communities along the Santarém-Cuiabá highway in south-central Brazilian Amazonia. In: Marsh LK (ed) Pri-mates in Fragments. Kluwer Academic Press, New York, pp 123-144.
Frankham R (1998) Inbreeding and extinction: Island popula-tions. Conserv Biol 12:665-675.
Frankham R (2003) Genetics and conservation biology. C R Biol 326:22-29.
Frankham R, Ballou JD and Briscoe DA (2002) Introduction to Conservation Genetics. Cambridge University Press, Cam-bridge, 642 pp.
Gilbert AK (2003) Primates and fragmentation of the Amazon forest. In: Marsh LK (ed) Primates in Fragments. Kluwer Academic Press, New York, pp 145-157.
Gonçalves EC, Silva A, Barbosa MSR and Schneider MPC (2004) Isolation and characterization of microsatellite loci in Ama-zonian red-handed howlers Alouatta belzebul (Primates, Plathyrrini). Mol Ecol Notes 4:406-408.
Gonçalves EC, Ferrari SF, Coutinho P, Menezes EV, Silva A and Schneider MPC (2009) Limited dispersal and genetic struc-ture of silvery marmosets (Mico argentatus) in the frag-mented landscape of central Amazonia. In: Davis LC, Ford SM and Porter LM (eds) The Smallest Anthropoids: The Marmoset/Callimico Radiation. Springer Verlag, New York, pp 205-220.
Goudet J (1995) FSTAT v. 1.2: A computer program to calculate F-statistics. J Hered 86:485-486.
Grativol AD, Ballou JD and Fleischer RC (2001) Microsatellite variation within and among recently fragmented populations of the golden lion tamarin (Leontopithecus rosalia). Con-serv Genet 2:1-9.
Gregorin R (2006) Taxonomia e variação geográfica das espécies do gêneroAlouattaLacépède (Primates, Atelidae) no Brasil. Rev Bras Zool 23:64-144.
Keller LF and Waller DM (2002) Inbreeding effects in wild popu-lations. Trends Ecol Evol 17:230-241.
Kimura M and Crow JF (1964) The number of alleles that can be maintained in a finite population. Genetics 49:725-738. Kimura M and Ohta T (1978) Stepwise mutation model and
distri-bution of allelic frequencies in a finite population. Proc Natl Acad Sci USA 75:2868-2872.
Leberg PL (2002) Estimating allelic diversity: Effects of sample size and bottlenecks. Mol Ecol 11:2445-2449.
Lopes MA and Ferrari SF (2000) Effects of human colonization on the abundance and diversity of mammals in eastern Bra-zilian Amazonia. Conserv Biol 14:1658-1665.
Luikart G and Cornuet JM (1998) Empirical evaluation of a test for identifying recently bottlenecked populations from allele frequency data. Conserv Biol 12:228-237.
palliata) on Barro Colorado Island, Panama. Conserv Genet 10:347-358.
Nievergelt CM, Mundy NI and Woodruff DS (1998) Micro-satellite primers for genotyping common marmosets ( Calli-thrix jacchus) and other callitrichids. Mol Ecol 7:1432-1434.
Peres CA (1997) Effects of habitat quality and hunting pressure on arboreal folivore densities in Neotropical forests: Acase study of howler monkeys (Alouatta spp.). Folia Primat 68:199-222.
Petit RJ, El Mousadik A and Pons O (1998) Identifying popula-tions for conservation on the basis of genetic markers. Con-serv Biol 12:844-855.
Pinto ACB, Ramos CA and Carvalho Jr O (2003) Activity pat-terns and diet of the howler monkeyAlouatta belzebulin ar-eas of logged and unlogged forest in ar-eastern Amazonia. Anim Biodiv Conserv 26:39-49.
Piry S, Luikart G and Cornuet JM (1999) BOTTLENECK: A computer program for detecting reductions in the effective size using allele frequency. J Hered 90:502-503.
Queiroz HL (1995) Preguiças e Guaribas: Os Mamíferos Folívo-ros Arborícolas do Mamirauá. Sociedade Civil Mamirauá and CNPq, Brasília, 120 pp.
Raymond M and Rousset F (1995) GENEPOP v. 1.2: Population genetics software for exact tests and ecumenicism. J Hered 86:248-249.
Reed DH and Frankham R (2003) Correlation between fitness and genetic diversity. Conserv Biol 17:230-237.
Rice WR (1989) Analyzing tables of statistical tests. Evolution 43:223-225.
Rodriguez-Toledo EM, Mandujano S and Garcia-Orduña F (2003) Relationships between forest fragments and howler monkeys (Alouatta palliata mexicana) in southern Vera
ing: A Laboratory Manual. Cold Spring Harbor Press, Cold Spring Harbor.
Schlötterer C, Kauer M and Dieringer D (2004) Allele excess at neutrally evolving microsatellites and the implications for tests of neutrality. Proc Biol Sci 271:869-874.
Schneider H, Sampaio MIC, Schneider MPC, Ayres JM, Barroso CML, Hamel AR, Silva BTF and Salzano FM (1991) Coat color and biochemical variation in Amazonian wild popula-tions ofAlouatta belzebul. Am J Phys Anthropol 85:85-93. Schneider S, Roessli E and Excoffier L (2000) Arlequin v. 3.11: A software for population genetic data analysis. Genetics and Biometry Laboratory, University of Geneva, Geneva. Wang E and Milton K (2003) Intragroup social relationships of
maleAlouatta palliateon Barro Colorado Island, Republic of Panama. Int J Primatol 24:1227-1243.
Wright S (1931) Evolution in mendelian population. Genetics 16:97-159.
Yeh FC, Yang RC and Boylet T (1997) POPGENE v. 1.32: Soft-ware Microsoft Windows based freeSoft-ware for population ge-netic analysis. University of Alberta, Canada.
Internet Resources
Arlequin: http://lgb.unige.ch/arlequin/ (August 2, 2009). Bottleneck:
http://www.ensam.inra.fr/URLB/bottleneck/bottle-neck.html (August 2, 2009).
Fstat: http://www2.unil.ch/popgen/softwares/fstat.htm (August 2, 2009).
Genepop on the web: http://genepop.curtin.edu.au/ (August 2, 2009).
Popgene: http://www.ualberta.ca/_fyeh/ (August 2, 2009).
Associate Editor: João S. Morgante